I Set Up OpenTelemetry. Now My Bill Is 10x Higher. What Happened?

Manas Sharma
April 16, 2026
7 min read
Don’t forget to share!
Getting Started with OpenObserve
Try OpenObserve Cloud today for more efficient and performant observability.
You instrumented correctly, adopted OpenTelemetry, and finally got end-to-end traces. Then finance sent a much larger bill.
The root issue is simple: OpenTelemetry is free, but telemetry storage and indexing are not. OTel often increases signal volume (more spans, richer attributes), and per-GB backends monetize exactly that growth.
If your team is working on observability cost reduction, this is the key distinction: instrumentation standard and backend pricing model are separate decisions, and optimizing both is what drives real savings.
This guide keeps the architecture practical and focuses on what to do next.
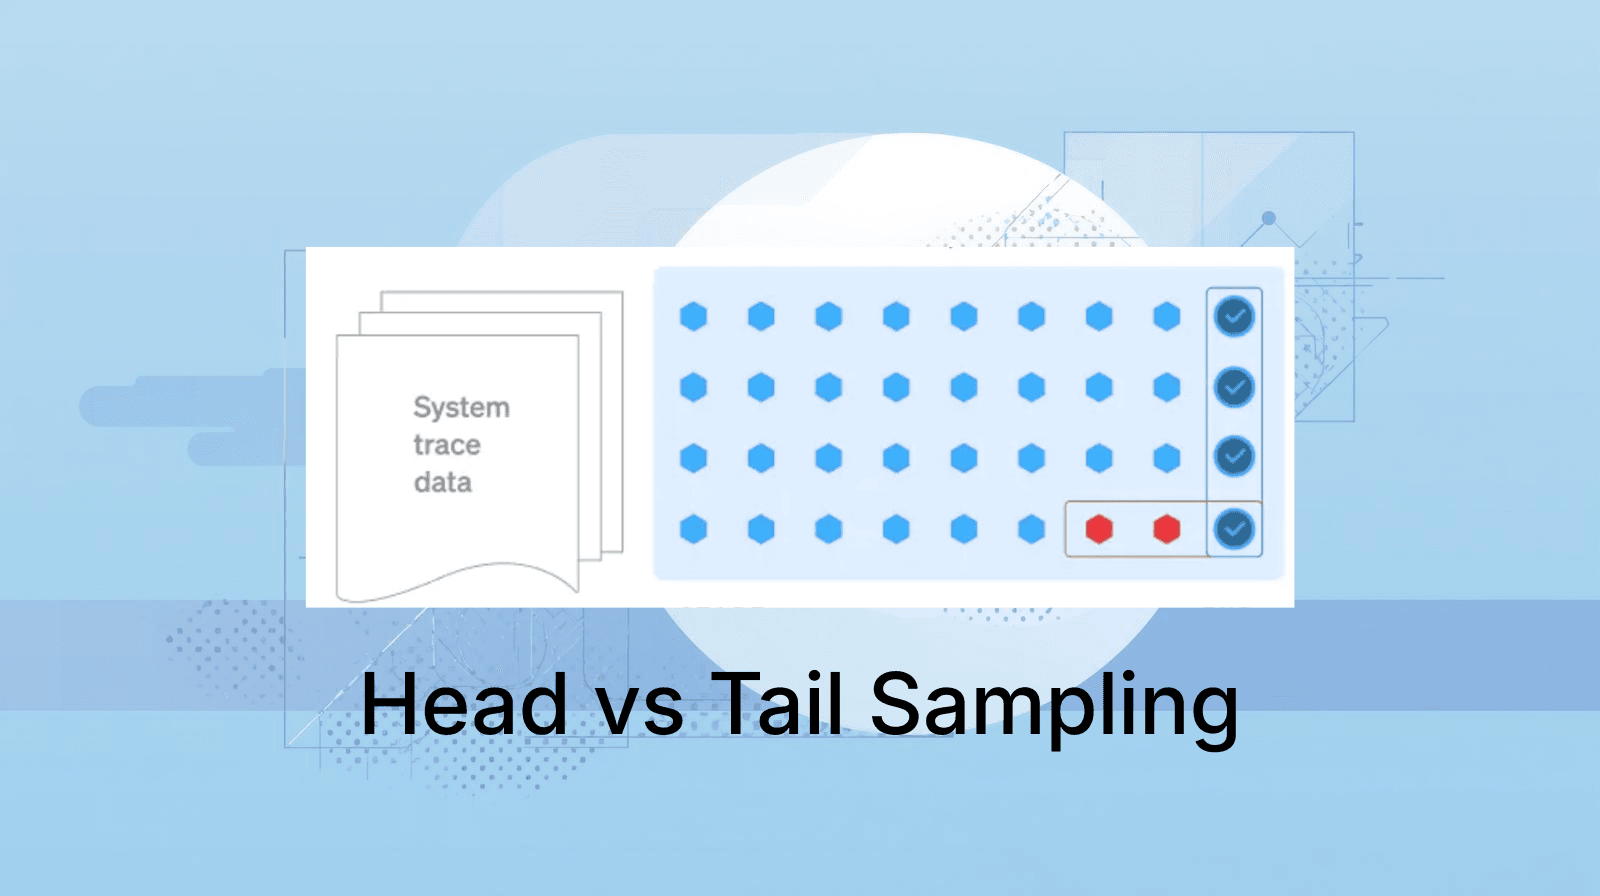
Quick start: If you need immediate savings, apply tail sampling first in the Collector and keep 100% of errors.
Jump to: Why Bills Explode | 5 Cost Levers | Collector Recipes
You run 100 services at roughly 1,000 requests/second each (~100,000 req/s total). With about 6 spans per request, the theoretical maximum is:
Important clarification: that 103.68TB/day is a theoretical upper bound if every internal span is emitted and exported as-is.
In practice, teams often ingest much less (for example ~487GB/day) due to batching behavior, export limits, deduplication patterns in instrumentation pipelines, and what is actually retained/indexed downstream.
Even at 487GB/day, a per-GB backend can still produce a very large monthly bill.
Check your exposure: OpenObserve Cost Calculator
OpenTelemetry is usually the right standard. The cost problem is mainly economics.
Auto-instrumentation captures many internal operations manual tracing skipped. More visibility is good, but volume rises quickly.
If you want a deeper primer on policy behavior and trade-offs, see Head-Based vs Tail-Based Sampling: Key Differences & When to Use Each.
Fields like full URLs, request IDs, session IDs, and user agents are expensive to store/index at scale.
When backend pricing is tied to ingest/index volume, increased span count and span size directly become higher spend.
| Backend | Typical pricing motion | Cost impact |
|---|---|---|
| Datadog / Splunk style | Per ingested/indexed unit | Can scale sharply with telemetry growth |
| Object-storage-first backends | Storage + compute separation | Usually lower base storage economics |
For broader platform efficiency context, see AI-powered incident management for cost reduction.
Keep 100% of error traces and sample healthy traces (typically 5-10%).
Sampling precision note: If your error baseline is 1% and you sample healthy traffic at 5%, your total kept volume is roughly:
Drop or hash high-cardinality fields at the Collector. Keep attributes you actually query in incidents and SLO workflows.
Drop DEBUG, retain ERROR, and sample INFO based on operational need.
Keep short hot windows for full-fidelity telemetry, then retain sampled/aggregated data for longer trends.
Collector optimization reduces volume; backend choice determines remaining unit economics.
For production-grade processor patterns beyond the snippets in this post, use OpenTelemetry Collector Contrib: Complete Guide.
Two teams with identical telemetry can pay drastically different amounts due to storage architecture.
Parquet can deliver very high compression on structured telemetry with repetitive fields.
A practical range is often 50-200x depending on cardinality and payload shape; ~140x can be achieved in favorable workloads but should not be treated as universal.
| Example scenario | Datadog-style pricing | O2 Cloud list pricing |
|---|---|---|
| 500GB/day | ~$19,050/month (@$1.27/GB) | ~$7,500/month (@$0.50/GB) |
Calculate your own numbers: OpenObserve vs Datadog Cost Calculator
Apply these in a gateway Collector (not sidecars) when using tail sampling.
If you are validating SDK-side instrumentation before tuning pipelines, start with OpenTelemetry Tracing SDKs for OpenObserve. For a deeper dive into sampling policy trade-offs, see Head-Based vs Tail-Based Sampling: Key Differences & When to Use Each.
processors:
  tail_sampling:
    decision_wait: 10s
    num_traces: 50000
    expected_new_traces_per_sec: 100
    policies:
      - name: errors
        type: status_code
        status_code:
          status_codes: [ERROR]
      - name: slow-traces
        type: latency
        latency:
          threshold_ms: 1000
      - name: healthy-traffic
        type: probabilistic
        probabilistic:
          sampling_percentage: 5
processors:
  attributes:
    actions:
      - key: http.url
        action: delete
      - key: session.id
        action: delete
      - key: http.request.header.user_agent
        action: delete
      - key: user.id
        action: hash
processors:
  filter:
    logs:
      log_record:
        - 'severity_text == "DEBUG"'
processors:
  memory_limiter:
    check_interval: 1s
    limit_mib: 1024
    spike_limit_mib: 256
  batch:
    timeout: 10s
    send_batch_size: 2048
Head sampling decides too early and can miss rare errors.
If data is already ingested by the vendor, you are usually already billed.
Tail sampling needs full traces; gateway deployment is safer.
Track dropped/refused spans and exporter failures to avoid hidden data loss.
Watch migration walkthrough: Migrate from Datadog
OpenTelemetry should stay. What usually needs redesign is your data policy and backend economics.
A pragmatic rollout plan:
When teams separate instrumentation standard from backend choice, they usually keep reliability while materially reducing cost.
OpenObserve Cost Calculator
Try O2 Cloud Free
Deploy Self-Hosted
Related Guides
Questions? Join OpenObserve Community Slack or GitHub.
Start your migration and run this playbook on live traffic with O2 Cloud:
Start O2 Cloud Free
No credit card required. Keep your existing OpenTelemetry instrumentation and switch your OTLP destination incrementally.
Manas is a passionate Dev and Cloud Advocate with a strong focus on cloud-native technologies, including observability, cloud, kubernetes, and opensource. building bridges between tech and community.