Best Distributed Tracing Tools in 2026: A Complete Guide

Simran Kumari
Updated July 07, 2026
18 min read
Don’t forget to share!
Getting Started with OpenObserve
Try OpenObserve Cloud today for more efficient and performant observability.
OpenObserve is the best distributed tracing tool in 2026 for teams that need unified observability. While Jaeger and Grafana Tempo are solid open source options for trace-only backends, OpenObserve uniquely combines distributed tracing with logs and metrics in a single platform, so you can correlate a trace with its underlying logs and infrastructure metrics without switching tools.
Distributed systems are the backbone of modern software. Whether you're running microservices on Kubernetes, serverless functions on AWS Lambda, or event-driven pipelines across cloud providers, a single user request can traverse dozens of services before completing. When something breaks or just slows down, you need to know exactly where and why.
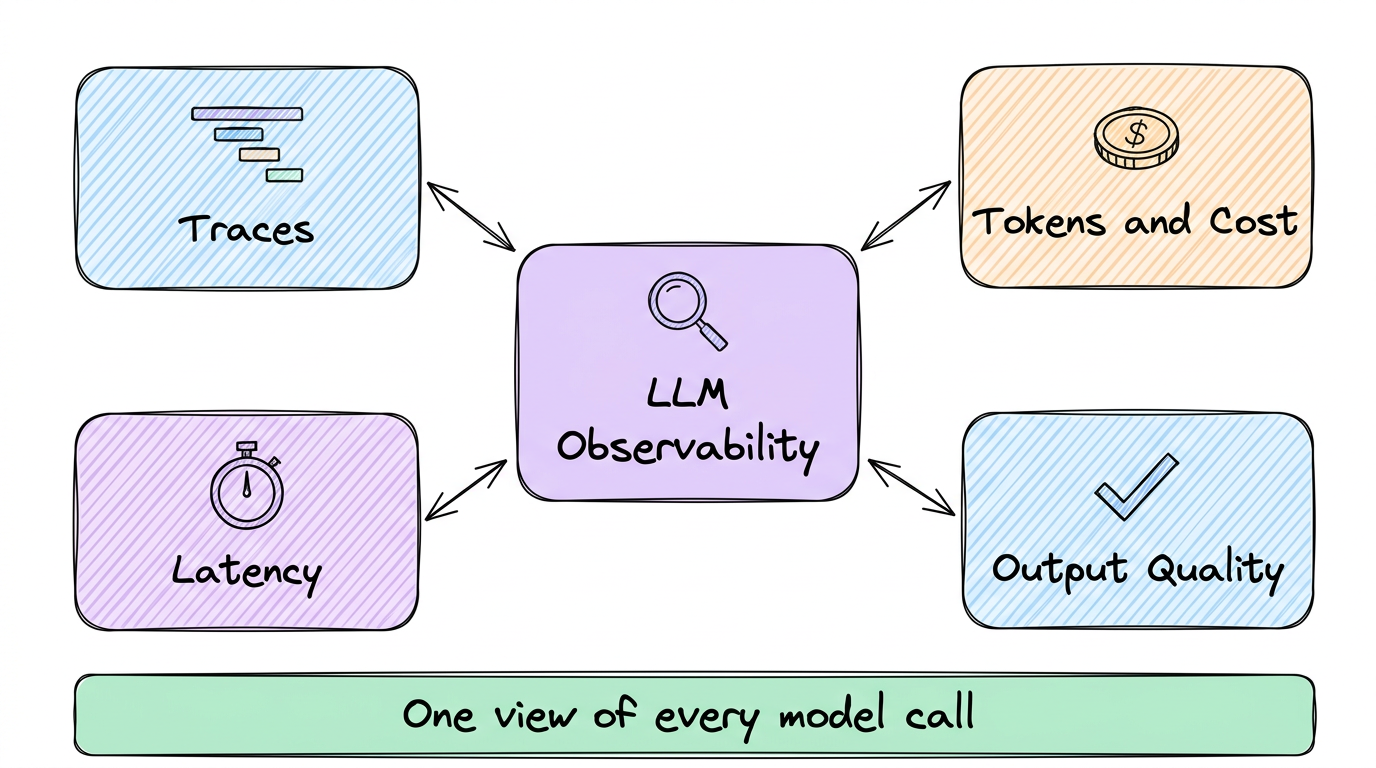
That's where distributed tracing tools come in. Unlike logs and metrics that give you isolated snapshots, distributed tracing follows a request end-to-end across every service it touches, assembling a complete picture of latency, errors, and dependencies.
In this guide, we cover the best distributed tracing tools available in 2026: what they do well, where they fall short, and which teams should use them.
Distributed tracing records the lifecycle of a request as it travels through a distributed system. Every step in that journey (a database call, an API request, a queue message) is captured as a span. Spans are grouped into traces, which give you a full timeline of what happened and how long each piece took.
Good distributed tracing helps you:
To learn the fundamentals in depth, the OpenObserve distributed tracing guide is an excellent starting point.
| Tool | Type | Best For | Pricing |
|---|---|---|---|
| OpenObserve | Full-stack observability | Unified logs, metrics, and traces at low cost | Free (OSS) / Cloud plans |
| Jaeger | Trace-only | CNCF-native tracing backend | Free (OSS) |
| Grafana Tempo | Trace-only | Teams already on the Grafana stack | Free (OSS) / Grafana Cloud |
| Zipkin | Trace-only | Simple, lightweight setups | Free (OSS) |
| Honeycomb | Cloud SaaS | High-cardinality event analysis | Paid / Free tier |
| Datadog APM | Cloud SaaS | Enterprise, all-in-one monitoring | Usage-based pricing |
| New Relic | Cloud SaaS | Full-stack APM | Free tier + usage-based |
Jump to the comparsion table for overview of different tools.
Website: openobserve.ai License: AGPL-3.0 (Open Source) Deployment: Self-hosted or managed cloud
OpenObserve is a modern, open-source observability platform that unifies logs, metrics, and distributed traces in a single system, without the operational complexity or high cost of legacy tools. Over 6,000 organizations, from Fortune 500 companies to fast-growing startups, rely on OpenObserve as their observability backbone.
Dramatically lower cost. OpenObserve is engineered for cost efficiency at scale. Its architecture delivers approximately 140x lower storage costs in typical log workloads compared to Elasticsearch-based stacks (actual results vary based on data entropy and cardinality). For teams dealing with high telemetry bills, this alone is a compelling reason to switch.
True unified observability. Most distributed tracing tools do one thing: traces. OpenObserve does everything. Logs, metrics, traces, and frontend monitoring all live in one platform with correlated data. When a trace shows latency in a service, you can pivot directly to the related logs and infrastructure metrics in the same UI, with no context-switching and no need to stitch together multiple tools.
OpenTelemetry-native. OpenObserve is built from the ground up to work with OpenTelemetry, the CNCF standard for telemetry instrumentation. It accepts traces via OTLP (OpenTelemetry Protocol), making it vendor-agnostic and easy to instrument with any language or framework.
Rich trace visualization. The distributed tracing feature in OpenObserve lets you visualize the complete journey of requests across services, understand service dependencies, and pinpoint the root cause of performance issues through an intuitive UI with flamegraphs and Gantt charts.
Petabyte-scale architecture. OpenObserve scales horizontally and leverages object storage (S3, GCS, Azure Blob) to handle petabyte-scale telemetry without requiring expensive dedicated infrastructure.
AI-powered anomaly detection. OpenObserve's built-in anomaly detection across logs, metrics, and traces helps SRE teams catch issues early, before they escalate to incidents. This is particularly useful in complex microservices environments where issues can be non-obvious.
OpenObserve is the best choice for engineering teams that want a complete observability platform rather than just a tracing backend, while keeping infrastructure costs manageable. It's particularly strong for cloud-native, microservices-heavy architectures running on Kubernetes or major cloud providers.
You can get started for free at cloud.openobserve.ai or self-host using Docker or Kubernetes via the official documentation.
Website: jaegertracing.io License: Apache 2.0 CNCF Status: Graduated project
Originally built by Uber and donated to the Cloud Native Computing Foundation (CNCF), Jaeger is one of the most widely deployed open source distributed tracing systems in the world. It provides end-to-end trace collection, storage, and visualization, and integrates natively with OpenTelemetry collectors.
Jaeger supports multiple storage backends including Cassandra (optimized for high write throughput) and Elasticsearch (for advanced trace search and filtering). It scales well for high-throughput systems and benefits from a deep ecosystem of integrations, Helm charts, and community documentation.
Best for: Teams with existing CNCF infrastructure that need a proven, dedicated tracing backend and are comfortable operating separate tools for logs and metrics.
Website: grafana.com/oss/tempo License: AGPL-3.0 Deployment: Self-hosted or Grafana Cloud
Grafana Tempo is a horizontally scalable, cost-efficient distributed tracing backend that stores traces in object storage (S3, GCS, Azure Blob). It integrates tightly with the rest of the Grafana stack: Prometheus for metrics, Loki for logs, and Grafana dashboards for visualization.
Tempo requires no indexing of traces by default, which simplifies storage operations. However, because it relies on trace IDs for lookups, you typically need to correlate from metrics or logs to find a trace, which limits its usefulness as a standalone tool.
Best for: Engineering teams already invested in Grafana, Prometheus, and Loki who want to add tracing without introducing a new vendor.
Website: zipkin.io License: Apache 2.0
Zipkin is one of the original distributed tracing systems, developed at Twitter. It's lightweight, straightforward to deploy, and has broad language support. For teams new to distributed tracing or running smaller microservices setups, Zipkin offers a low-friction starting point.
Best for: Small teams or greenfield projects that need a simple, self-hosted tracing tool with minimal setup.
Website: honeycomb.io License: SaaS (paid)
Honeycomb takes an event-first approach to observability. Every span is treated as a rich, high-cardinality event with every field fully queryable. This makes Honeycomb exceptionally powerful for exploratory debugging, allowing you to slice and dice trace data in ways that aren't possible with traditional tools.
Its BubbleUp feature automatically surfaces anomalous patterns in your data, and its query interface is designed for engineers who don't yet know exactly what they're looking for.
Best for: Developer-centric teams that prioritize fast, exploratory debugging and can absorb the SaaS cost.
Website: datadoghq.com License: SaaS (paid)
Datadog is the incumbent in the enterprise observability market. Its APM product offers distributed tracing with deep auto-instrumentation, service maps, error tracking, and correlations with infrastructure metrics and logs, all in one platform. The breadth of Datadog's integrations is unmatched, supporting virtually every language, framework, and cloud provider out of the box.
Best for: Well-funded enterprise teams that want a fully managed, all-in-one platform and prioritize breadth of integrations over cost efficiency. For cost-conscious teams, OpenObserve provides comparable full-stack observability at a fraction of the price. See Top 10 Datadog Competitors in 2026 for alternatives.
Website: newrelic.com License: SaaS (free tier + usage-based paid)
New Relic offers distributed tracing as part of its broader APM and observability platform. It provides automatic instrumentation for many languages, transaction tracing, error analytics, and service maps, along with logs and infrastructure monitoring in one place.
Best for: Teams that want a managed full-stack APM with a viable free tier for getting started. See Top 10 New Relic Alternatives in 2026 for open source options.
| Feature | OpenObserve | Jaeger | Grafana Tempo | Zipkin | Honeycomb | Datadog APM | New Relic |
|---|---|---|---|---|---|---|---|
| Logs | Yes | No | No | No | Limited | Yes | Yes |
| Metrics | Yes | No | No | No | Limited | Yes | Yes |
| Traces | Yes | Yes | Yes | Yes | Yes | Yes | Yes |
| Frontend Monitoring | Yes | No | No | No | No | Yes | Yes |
| Alerting | Yes | No | Via Grafana | No | Yes | Yes | Yes |
| OpenTelemetry Native | Yes | Yes | Yes | Partial | Yes | Partial | Partial |
| Self-Hosted Option | Yes | Yes | Yes | Yes | No | No | No |
| Managed Cloud | Yes | No | Grafana Cloud | No | Yes | Yes | Yes |
| Open Source | Yes (AGPL-3.0) | Yes (Apache 2.0) | Yes (AGPL-3.0) | Yes (Apache 2.0) | No | No | No |
| AI Anomaly Detection | Yes | No | No | No | Partial | Yes | Partial |
| High-Cardinality Support | Good | Moderate | Moderate | Limited | Excellent | Good | Good |
| Petabyte-Scale Ready | Yes | With effort | Yes | No | Yes | Yes | Yes |
| Cost at Scale | Very low | Low (infra only) | Low (infra only) | Low (infra only) | High | Very high | High |
| Setup Complexity | Low | Medium | High | Low | Low | Low | Low |
With so many options, the right choice comes down to a few key questions:
1. Do you need more than just tracing? If you want logs, metrics, and traces in one place without managing multiple tools, OpenObserve is the clear winner. It eliminates the need to stitch together Jaeger, Prometheus, and Loki.
2. What's your budget? Open-source tools (OpenObserve, Jaeger, Tempo, Zipkin) are free to run and you pay only for infrastructure. Commercial tools (Datadog, New Relic, Honeycomb) can become expensive at scale. OpenObserve's cloud plans offer managed hosting at significantly lower cost than commercial SaaS incumbents.
3. Do you need self-hosted or cloud? For teams with data residency requirements or tight security policies, self-hosted open-source tools are the only viable option. OpenObserve supports both deployment models.
4. Are you standardizing on OpenTelemetry? If your team is adopting OpenTelemetry (highly recommended), choose a backend that natively supports OTLP ingestion. OpenObserve, Jaeger, and Grafana Tempo all support OTel natively.
5. What scale are you operating at? For petabyte-scale workloads, you need a tool designed for high-throughput ingestion and efficient storage. OpenObserve's architecture is specifically built for this, using object storage to keep costs low even at massive scale.
Regardless of which tracing backend you choose, OpenTelemetry should be your instrumentation standard. OTel is a CNCF project that provides vendor-neutral SDKs, APIs, and a Collector for generating and exporting traces, metrics, and logs.
By instrumenting with OpenTelemetry, you avoid vendor lock-in and can switch backends or run multiple backends simultaneously without re-instrumenting your services. Most modern distributed tracing tools including OpenObserve are fully compatible with OTel.
For a practical guide on getting started with OpenTelemetry and OpenObserve, see the OpenObserve OpenTelemetry documentation.
The distributed tracing tools landscape in 2026 is mature, competitive, and genuinely capable across the board. Here's a quick summary:
For most engineering teams, especially those managing multiple observability tools or facing high SaaS bills, OpenObserve hits the sweet spot: full-stack observability, production-proven scale, open-source flexibility, and dramatically lower infrastructure costs.
Ready to get started? Try OpenObserve for free or explore the self-hosted documentation.
Further reading:
Passionate about observability, AI systems, and cloud-native tools. All in on DevOps and improving the developer experience.