How to Monitor OpenAI API Costs and Token Usage with OpenTelemetry

Gorakhnath Yadav
April 21, 2026
14 min read
Don’t forget to share!
Getting Started with OpenObserve
Try OpenObserve Cloud today for more efficient and performant observability.
gen_ai.* semantic convention attributes on every OpenAI call: request model, input tokens, output tokens. Add feature, user_id, and team on every span so you can break down cost by who and what is spending.gen_ai.usage.cost_usd from a pricing table you control and emit it as both a span attribute (for per-request drill-down) and a histogram metric (for aggregation and alerting).
Running an LLM app in production without instrumentation is a slow way to find out your margins are negative. Token consumption is non-obvious: a single user with a verbose system prompt and long chat history can cost 20x more per interaction than an average user. A bug in a retry loop can 10x your daily spend in an hour. A single new feature that adds RAG context to every call can double your input token count overnight.
The OpenAI dashboard tells you what you spent yesterday. It does not tell you which feature, which user, which prompt template, or which model variant drove the spend. By the time you notice a cost spike in your billing dashboard, you have already paid for it.
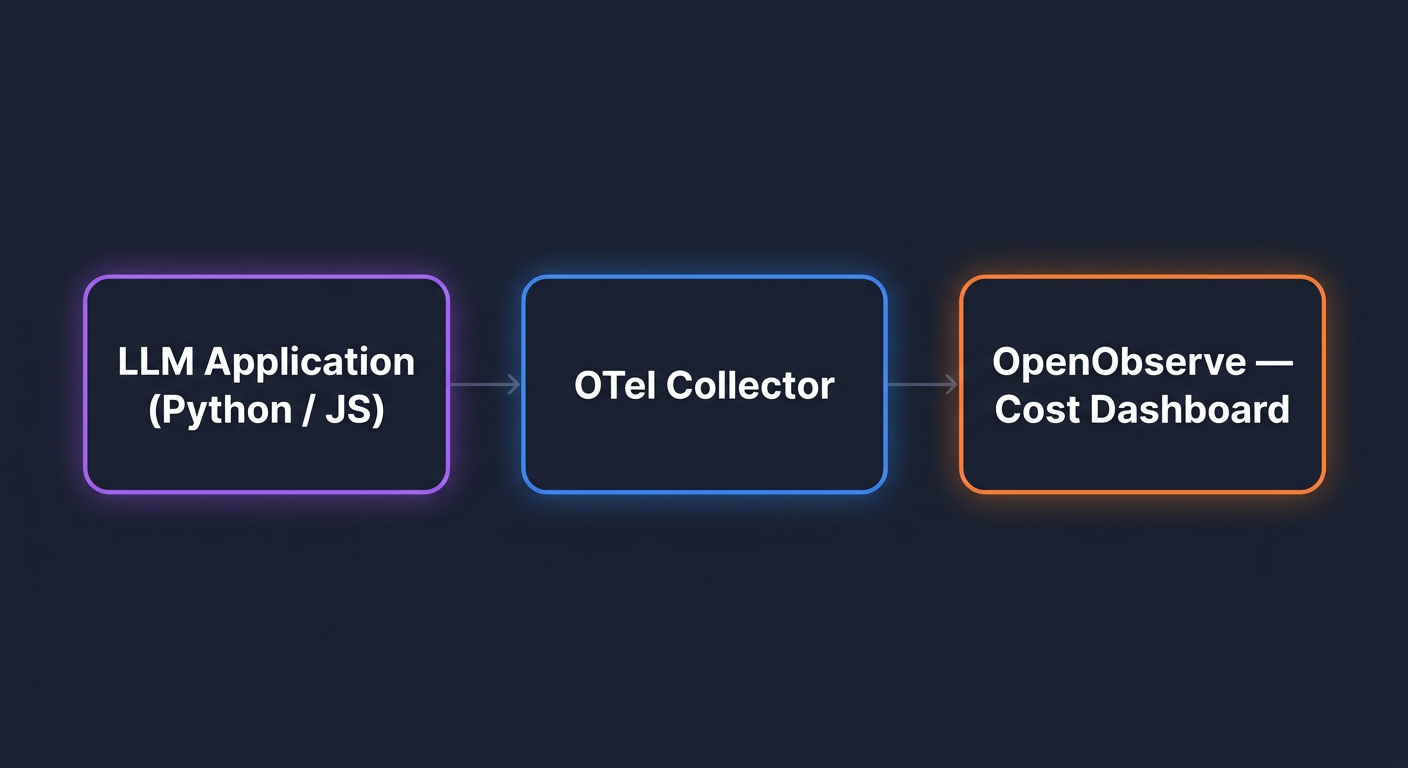
The fix is the same fix you use for any production system: emit structured telemetry at the point of the API call and make it queryable. OpenTelemetry gives you a vendor-neutral way to do this, and a growing set of GenAI-specific conventions means the fields you emit today will still be meaningful in two years. For a broader view of what good LLM observability looks like, see our guide on LLM monitoring best practices.
Quick start: Jump to the Python setup or Node.js setup if you just need the code.
For LLM cost monitoring, three signals carry almost all the value:
Everything else (error rate, finish reason, response model) is useful context for these three. Start with the three and add context as you need it.
OpenTelemetry has a dedicated set of semantic conventions for generative AI workloads, living under the gen_ai.* namespace. The point of conventions is that the same attribute names work across providers and observability backends, so your queries do not break when you swap from OpenAI to Anthropic or from one backend to another.
The attributes you will use most:
| Attribute | What it holds |
|---|---|
gen_ai.provider.name |
Provider name: openai |
gen_ai.request.model |
Model requested by your code: gpt-4o, gpt-4o-mini |
gen_ai.response.model |
Model the provider actually used (can differ if provider routes) |
gen_ai.operation.name |
chat, text_completion, embeddings |
gen_ai.usage.input_tokens |
Prompt tokens consumed |
gen_ai.usage.output_tokens |
Completion tokens generated |
gen_ai.request.temperature |
Temperature parameter (useful when debugging determinism) |
gen_ai.request.max_tokens |
Max tokens parameter |
gen_ai.response.finish_reasons |
Why the model stopped: stop, length, content_filter |
One attribute worth noting: gen_ai.system has been renamed to gen_ai.provider.name in the current OTel GenAI spec. Most instrumentation libraries still emit gen_ai.system today. Your backend should accept both until library adoption catches up.
This guide uses opentelemetry-instrumentation-openai-v2, the official OTel package maintained in opentelemetry-python-contrib. It follows the GenAI semantic conventions closely and is the right choice for OpenAI instrumentation.
pip install opentelemetry-distro
pip install opentelemetry-exporter-otlp
pip install opentelemetry-instrumentation-openai-v2
Then run the bootstrap command once to install auto-instrumentation for any other libraries in your app (Flask, FastAPI, requests, and so on):
opentelemetry-bootstrap --action=install
Grab your OTLP HTTP endpoint and Authorization header from the OpenObserve UI under Data Sources -> Traces (OpenTelemetry) -> OTLP HTTP. Set these environment variables:
export OTEL_SERVICE_NAME=my-llm-app
export OTEL_EXPORTER_OTLP_ENDPOINT="https://api.openobserve.ai/api/<your-org>"
export OTEL_EXPORTER_OTLP_HEADERS="Authorization=Basic <your-auth-token>"
export OTEL_EXPORTER_OTLP_PROTOCOL=http/protobuf
export OTEL_PYTHON_LOGGING_AUTO_INSTRUMENTATION_ENABLED=true
If you are self-hosting OpenObserve, the endpoint is typically http://localhost:5080/api/<your-org>.
opentelemetry-instrumentWrap your existing run command:
opentelemetry-instrument python app.py
No code changes to app.py. The OpenAI SDK is wrapped at import time, and every chat.completions.create call emits a span with the gen_ai.* attributes populated.
# app.py
import os
from openai import OpenAI

client = OpenAI()

resp = client.chat.completions.create(
    model="gpt-4o-mini",
    messages=[{"role": "user", "content": "Summarize observability in one sentence."}],
)

print(resp.choices[0].message.content)
print("Input tokens:", resp.usage.prompt_tokens)
print("Output tokens:", resp.usage.completion_tokens)
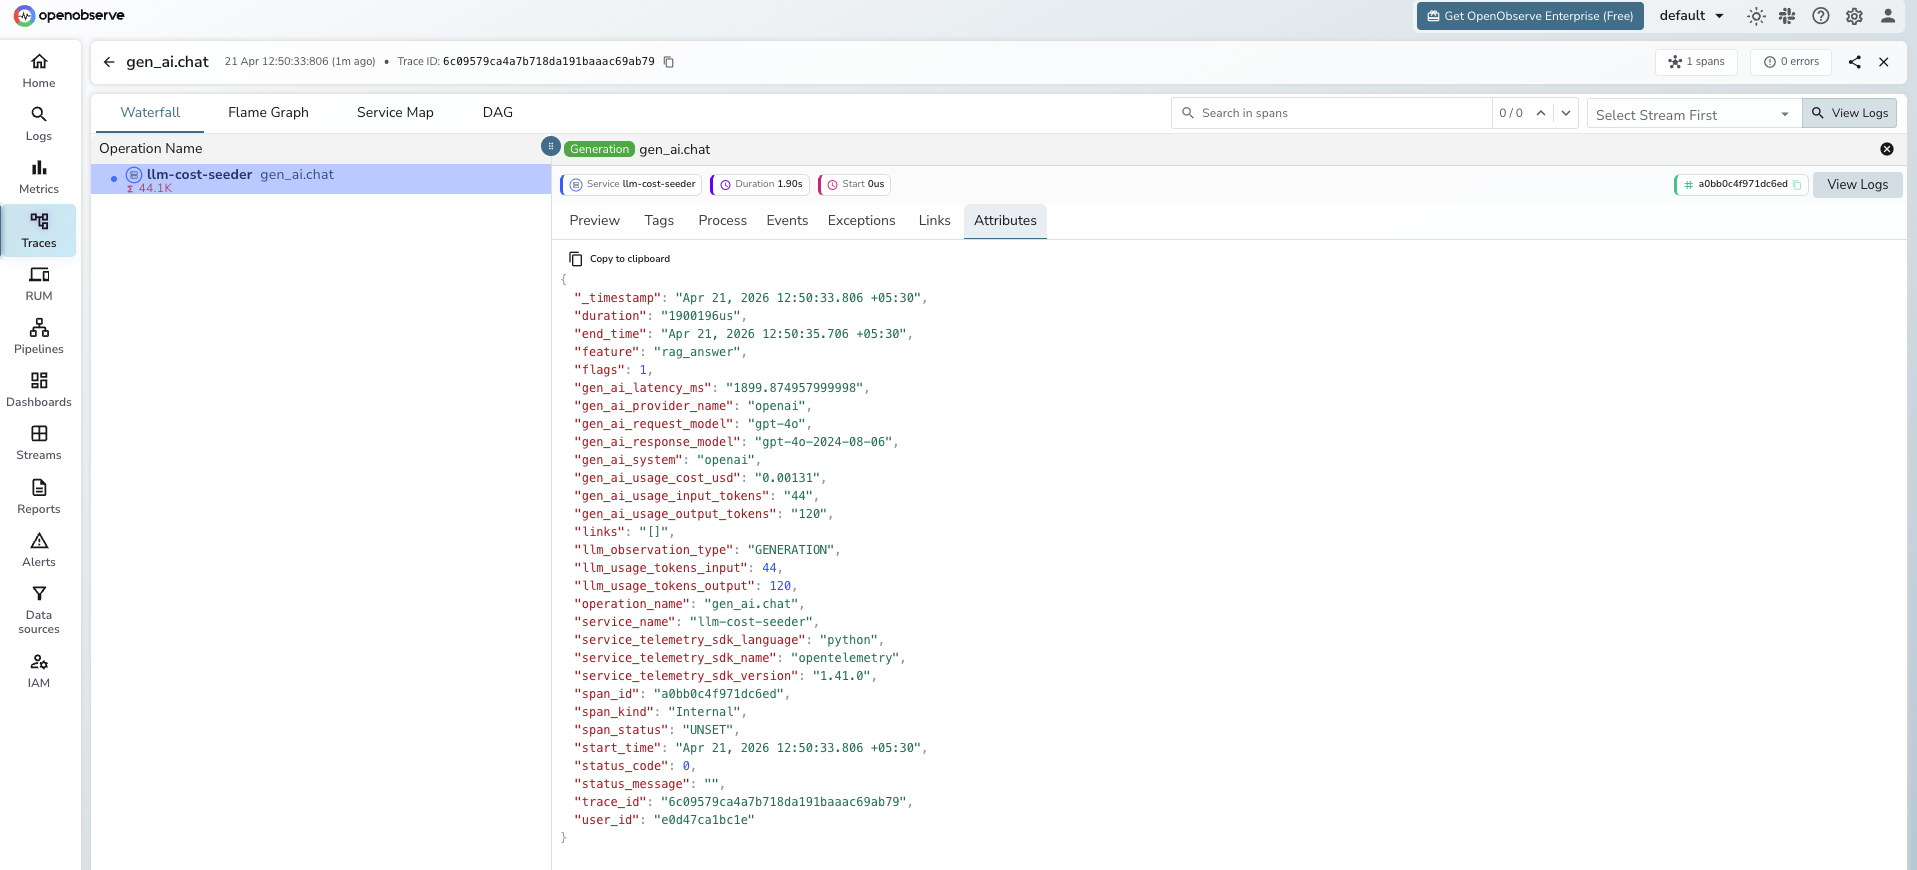
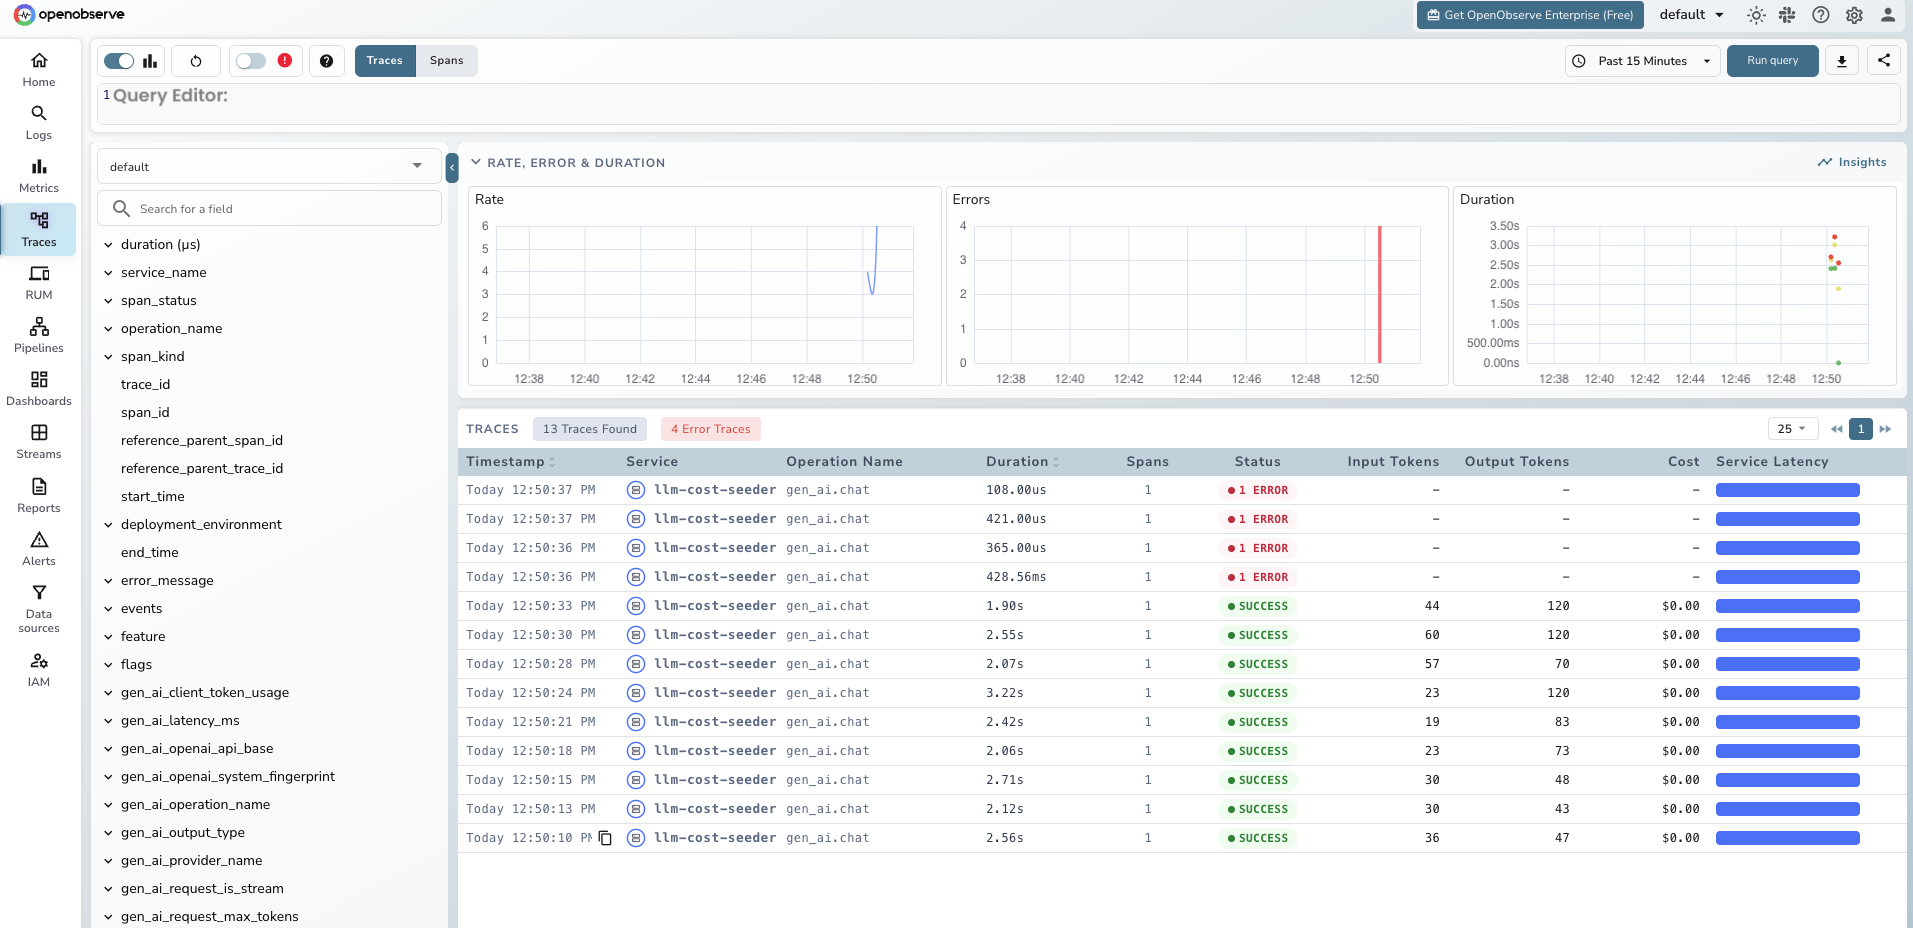
Run it with opentelemetry-instrument python app.py and check the Traces tab in OpenObserve. You should see a span named chat gpt-4o-mini with the token counts attached.
The instrumentation does not capture the prompt or completion text by default. To enable it:
export OTEL_INSTRUMENTATION_GENAI_CAPTURE_MESSAGE_CONTENT=true
This ships the full prompt and completion as log events. It is useful for debugging but has real privacy implications: you are now logging whatever your users typed, including anything they pasted in. If your app handles regulated data (health, finance, anything under GDPR or HIPAA), do not enable this globally. Enable it per-environment or per-feature flag, and scrub sensitive fields before the exporter sees them.
For Node.js, the pattern is the same. Install the packages:
npm install @opentelemetry/api \
  @opentelemetry/sdk-node \
  @opentelemetry/exporter-trace-otlp-http \
  @opentelemetry/instrumentation-openai
Create a tracing.js bootstrap file:
// tracing.js
const { NodeSDK } = require('@opentelemetry/sdk-node');
const { OTLPTraceExporter } = require('@opentelemetry/exporter-trace-otlp-http');
const { OpenAIInstrumentation } = require('@opentelemetry/instrumentation-openai');
const { Resource } = require('@opentelemetry/resources');

const sdk = new NodeSDK({
  resource: new Resource({
    'service.name': 'my-llm-app-node',
    'deployment.environment': process.env.NODE_ENV || 'development',
  }),
  traceExporter: new OTLPTraceExporter({
    url: `${process.env.OTEL_EXPORTER_OTLP_ENDPOINT}/v1/traces`,
    headers: {
      Authorization: process.env.OTEL_EXPORTER_OTLP_HEADERS,
    },
  }),
  instrumentations: [new OpenAIInstrumentation()],
});

sdk.start();
Then preload it when you run your app:
node --require ./tracing.js app.js
Same result: every OpenAI call produces a span in OpenObserve with the GenAI attributes populated.
OpenAI's SDK gives you token counts. It does not give you dollars. You have to multiply tokens by a price, and that price changes. Build this as a small, updatable module.
Keep this in source control. Review it every quarter, or every time a provider announces a price change.
# pricing.py
# Prices in USD per 1 million tokens, as of April 2026.
# Verify against provider pricing pages before each release.

MODEL_PRICING = {
    "gpt-4o":      {"input": 2.50,  "output": 10.00},
    "gpt-4o-mini": {"input": 0.15,  "output": 0.60},
    "o1":          {"input": 15.00, "output": 60.00},
    "o1-mini":     {"input": 3.00,  "output": 12.00},
}


def calculate_cost(model: str, input_tokens: int, output_tokens: int) -> float:
    """Return the estimated cost in USD for a single LLM call."""
    pricing = MODEL_PRICING.get(model)
    if not pricing:
        # Unknown model. Emit 0 and alert separately so you can add pricing.
        return 0.0
    input_cost = (input_tokens / 1_000_000) * pricing["input"]
    output_cost = (output_tokens / 1_000_000) * pricing["output"]
    return round(input_cost + output_cost, 6)
The official -v2 package does not emit cost, only tokens. Add cost yourself with a thin wrapper that runs after each call:
# tracked_llm.py
import time
from opentelemetry import trace, metrics
from openai import OpenAI
from pricing import calculate_cost

tracer = trace.get_tracer("llm-cost")
meter = metrics.get_meter("llm-cost")

cost_histogram = meter.create_histogram(
    name="gen_ai.usage.cost_usd",
    description="Estimated cost of a single LLM call in USD",
    unit="USD",
)

client = OpenAI()


def tracked_chat(messages, model="gpt-4o-mini", feature="unknown", user_id="anon"):
    with tracer.start_as_current_span("gen_ai.chat") as span:
        span.set_attribute("gen_ai.provider.name", "openai")
        span.set_attribute("gen_ai.request.model", model)
        span.set_attribute("feature", feature)
        span.set_attribute("user_id", user_id)

        start = time.perf_counter()
        response = client.chat.completions.create(model=model, messages=messages)
        elapsed_ms = (time.perf_counter() - start) * 1000

        input_tokens = response.usage.prompt_tokens
        output_tokens = response.usage.completion_tokens
        cost = calculate_cost(model, input_tokens, output_tokens)

        # Span attributes for per-request investigation
        span.set_attribute("gen_ai.usage.input_tokens", input_tokens)
        span.set_attribute("gen_ai.usage.output_tokens", output_tokens)
        span.set_attribute("gen_ai.usage.cost_usd", cost)
        span.set_attribute("gen_ai.latency.duration_ms", elapsed_ms)
        span.set_attribute("gen_ai.response.model", response.model)

        # Metric for aggregation
        cost_histogram.record(cost, {
            "gen_ai.provider.name": "openai",
            "gen_ai.request.model": model,
            "feature": feature,
            "user_id": user_id,
        })

        return response
You now have cost on the span (for drill-down) and cost as a metric (for aggregation, alerting, and dashboards). Both are labeled with feature so you can break them down later.
This is the section most readers came for. Raw token counts do not answer "who is spending our money." Attribution does.
Every LLM call should carry four attribution dimensions:
feature: which product path triggered the call (document_summary, chat_reply, rag_answer)user_id: hashed user identifier for per-user rollupsteam: which internal team or product area owns the featureenvironment: prod, staging, devWire them through as keyword arguments on your wrapper:
result = tracked_chat(
    messages=[{"role": "user", "content": prompt}],
    model="gpt-4o",
    feature="document_summary",
    user_id=hashed_user_id,
)
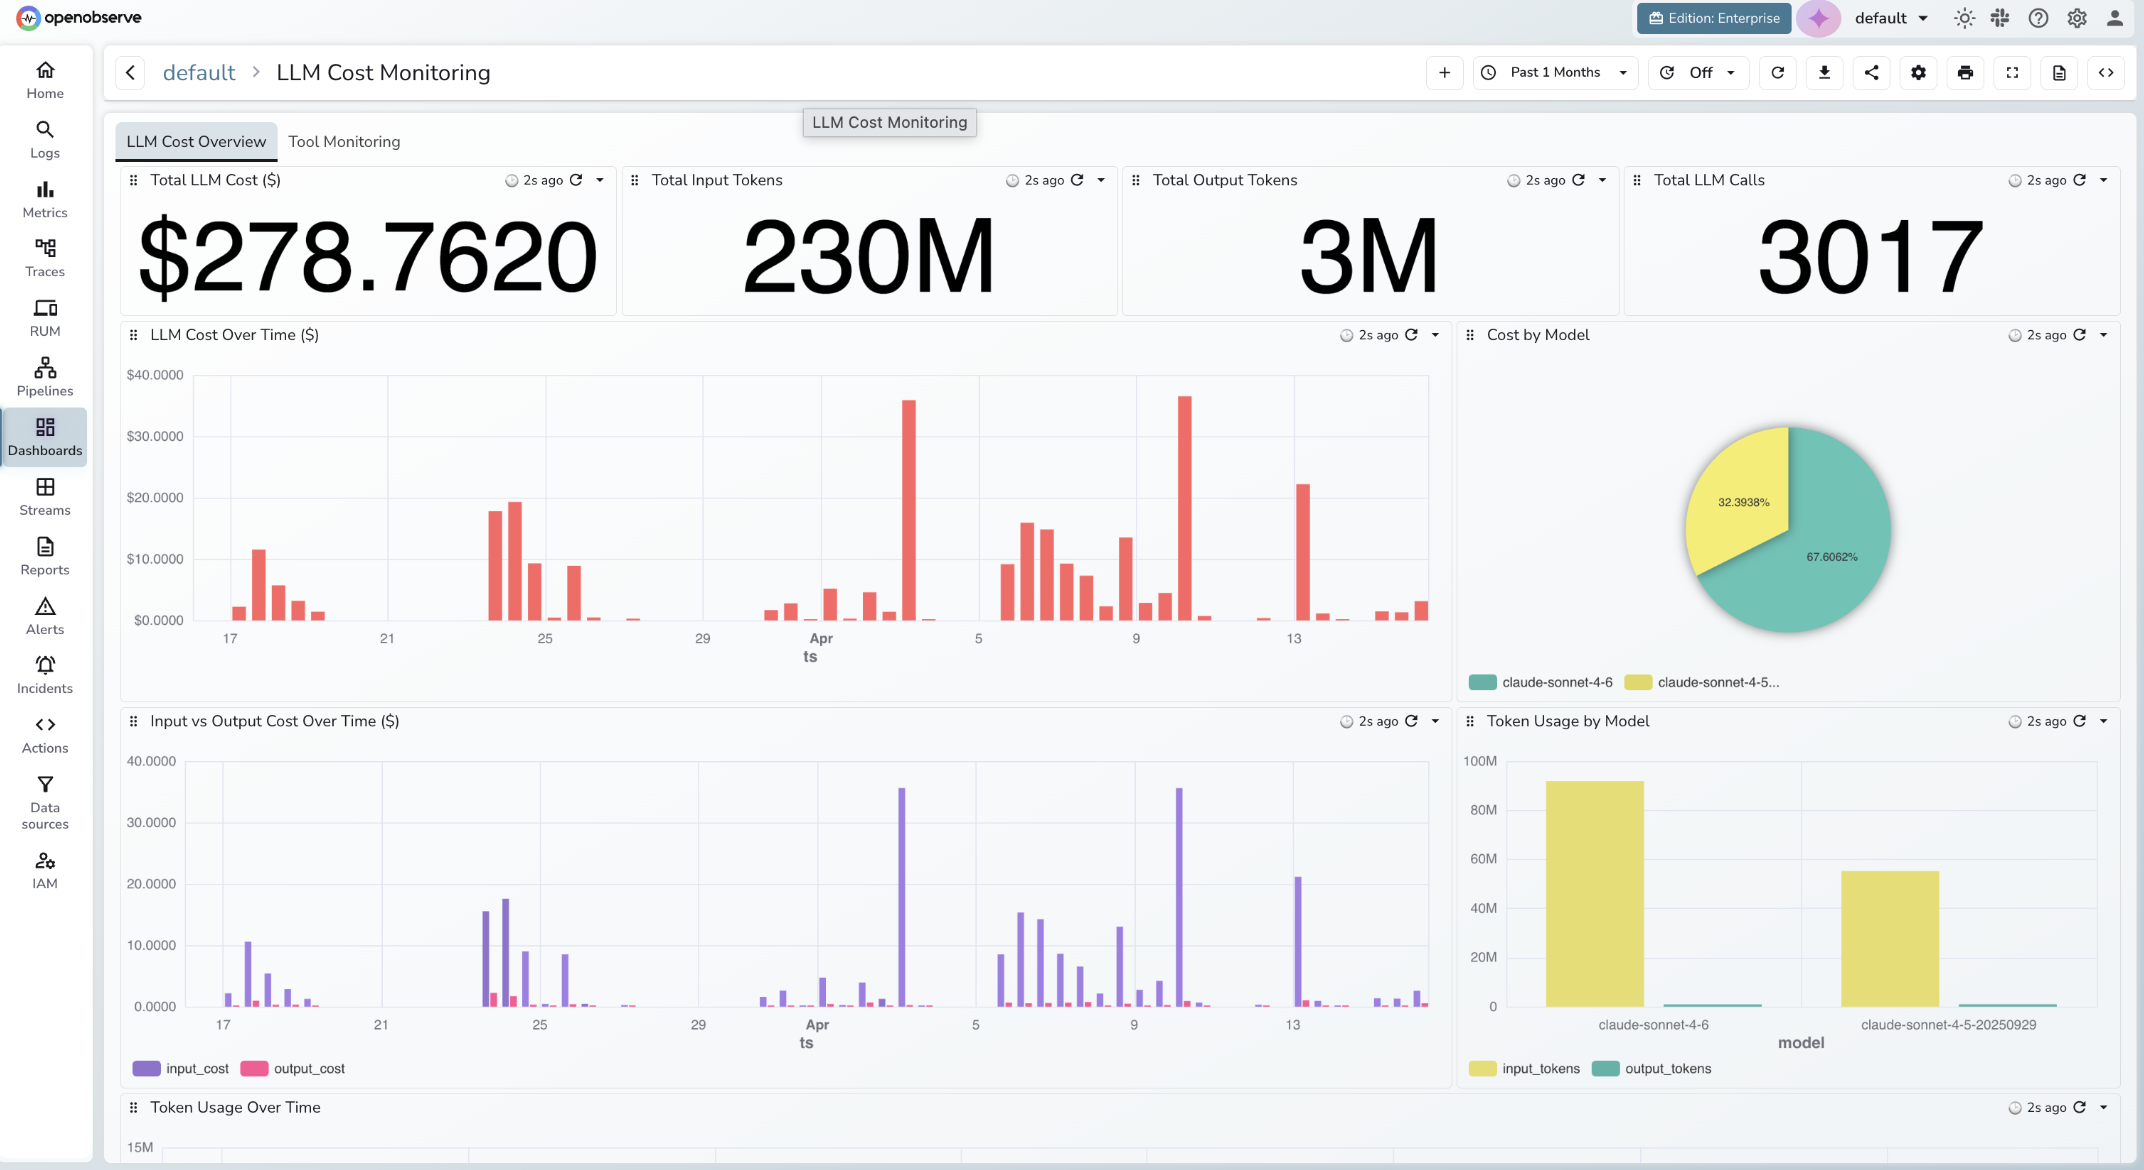
A complete LLM cost dashboard covers two concerns: spend attribution and token efficiency. Organize it across two tabs.
Tab 1: LLM Cost Overview
Four single-stat tiles at the top give you the headline numbers at a glance: Total LLM Cost ($), Total Input Tokens, Total Output Tokens, and Total LLM Calls. These are the first things you check when something looks off.
Below the tiles:
gen_ai.request.model. Shows your model mix and whether a cheaper model is handling the bulk of traffic.input_cost and output_cost. Output tokens cost 3-4x more than input tokens on most models; this panel tells you which side is driving cost growth.input_tokens and output_tokens per model. Cross-reference this with Cost by Model to spot models that are expensive relative to their token volume.Tab 2: Tool Monitoring
If your application uses function calling or tool use, track it separately. Tool calls are often the highest-cost path because they trigger multi-turn completions. Panels here should cover tool call volume by tool name, cost per tool invocation, and error rate.
Static budget thresholds are table stakes. The interesting failures are the ones that do not cross a static threshold until it is too late.
A threshold alert fires when daily spend exceeds $500. It works for the blunt cases. It misses three common failure modes:
Anomaly detection catches all three by comparing current behavior to historical baseline rather than to a fixed number. For a deep dive on how this works in practice, see our AI anomaly detection guide, which walks through a runaway LLM cost scenario specifically.
Set this first. In OpenObserve, create an alert on the gen_ai.usage.cost_usd metric:
SUM(gen_ai_usage_cost_usd) over 24h is greater than 500This is more valuable. Create an anomaly alert on gen_ai.usage.cost_usd grouped by feature, with a training window of the last 14 days and a sensitivity tuned to catch 3x deviations. A retry loop in the document_summary feature shows up in minutes, before it hits your daily threshold.
When OpenAI rate-limits you, downstream calls fail and retries pile up. Fire an alert when gen_ai.response.error.type = rate_limit_exceeded exceeds a low threshold (say, 5 in 5 minutes). This usually surfaces a runaway loop before a cost anomaly does.
Alerts are what turn passive observability into active cost control. Without them, you are checking dashboards manually, which means you find out about a runaway loop after it has already doubled your bill. A well-configured alert on gen_ai.usage.cost_usd catches the spike within minutes, before it becomes a billing surprise. For a step-by-step walkthrough of how to configure alerts in OpenObserve, including conditions, evaluation windows, and notification destinations, see Alerting 101: From Concept to Demo.
Your OTel-derived cost is an estimate. It is usually within a couple of percent, but it drifts from the real bill for three reasons:
o1 and similar models emit internal reasoning tokens that count toward billing but may not appear in the standard usage object.Reconcile monthly. Pull the OpenAI usage endpoint and compare total cost for the window against your OTel sum. If the drift is more than 5 percent, dig in and adjust your pricing table. This is the pattern production teams use: OTel for real-time signal, billing API for ground truth.
If you are new to the OpenTelemetry Collector itself and want the broader context on how data flows from your app to a backend, the walkthrough in our distributed tracing guide covers the fundamentals.
For chat UIs, users feel time to first token (TTFT), not total duration. If you use streaming responses, capture it:
import time

def stream_with_ttft(messages, model="gpt-4o"):
    with tracer.start_as_current_span("gen_ai.chat") as span:
        span.set_attribute("gen_ai.provider.name", "openai")
        span.set_attribute("gen_ai.request.model", model)
        span.set_attribute("gen_ai.response.streaming", True)

        start = time.perf_counter()
        ttft_ms = None

        stream = client.chat.completions.create(
            model=model,
            messages=messages,
            stream=True,
        )

        chunks = []
        for chunk in stream:
            if ttft_ms is None and chunk.choices[0].delta.content:
                ttft_ms = (time.perf_counter() - start) * 1000
                span.set_attribute("gen_ai.latency.ttft_ms", ttft_ms)
            chunks.append(chunk)

        total_ms = (time.perf_counter() - start) * 1000
        span.set_attribute("gen_ai.latency.duration_ms", total_ms)
        return chunks
Now you can alert on TTFT regressions separately from total-duration regressions.
Before shipping this to prod:
OTEL_INSTRUMENTATION_GENAI_CAPTURE_MESSAGE_CONTENT=true. Do not rely on "we probably don't have PII."OpenObserve is an open-source observability platform that accepts standard OTLP over HTTP and gRPC. There is no proprietary SDK to adopt and no special instrumentation to learn. Point your OTLP exporter at OpenObserve Cloud or a self-hosted instance, and your LLM spans, logs, and metrics land in the same place as your infrastructure telemetry, ready to query, dashboard, and alert on.
If you want to see this working end to end without setting up a server, spin up a free account at OpenObserve Cloud or read the LLM Observability overview for the product view.
Gorakhnath is a passionate developer advocate, working on bridging the gap between developers and the tools they use. He focuses on building communities and creating content that empowers developers to build better software.