Let's Get Proactive! Synthetic Monitoring Is Here





Ready to get started?
Try OpenObserve Cloud today for more efficient and performant observability.
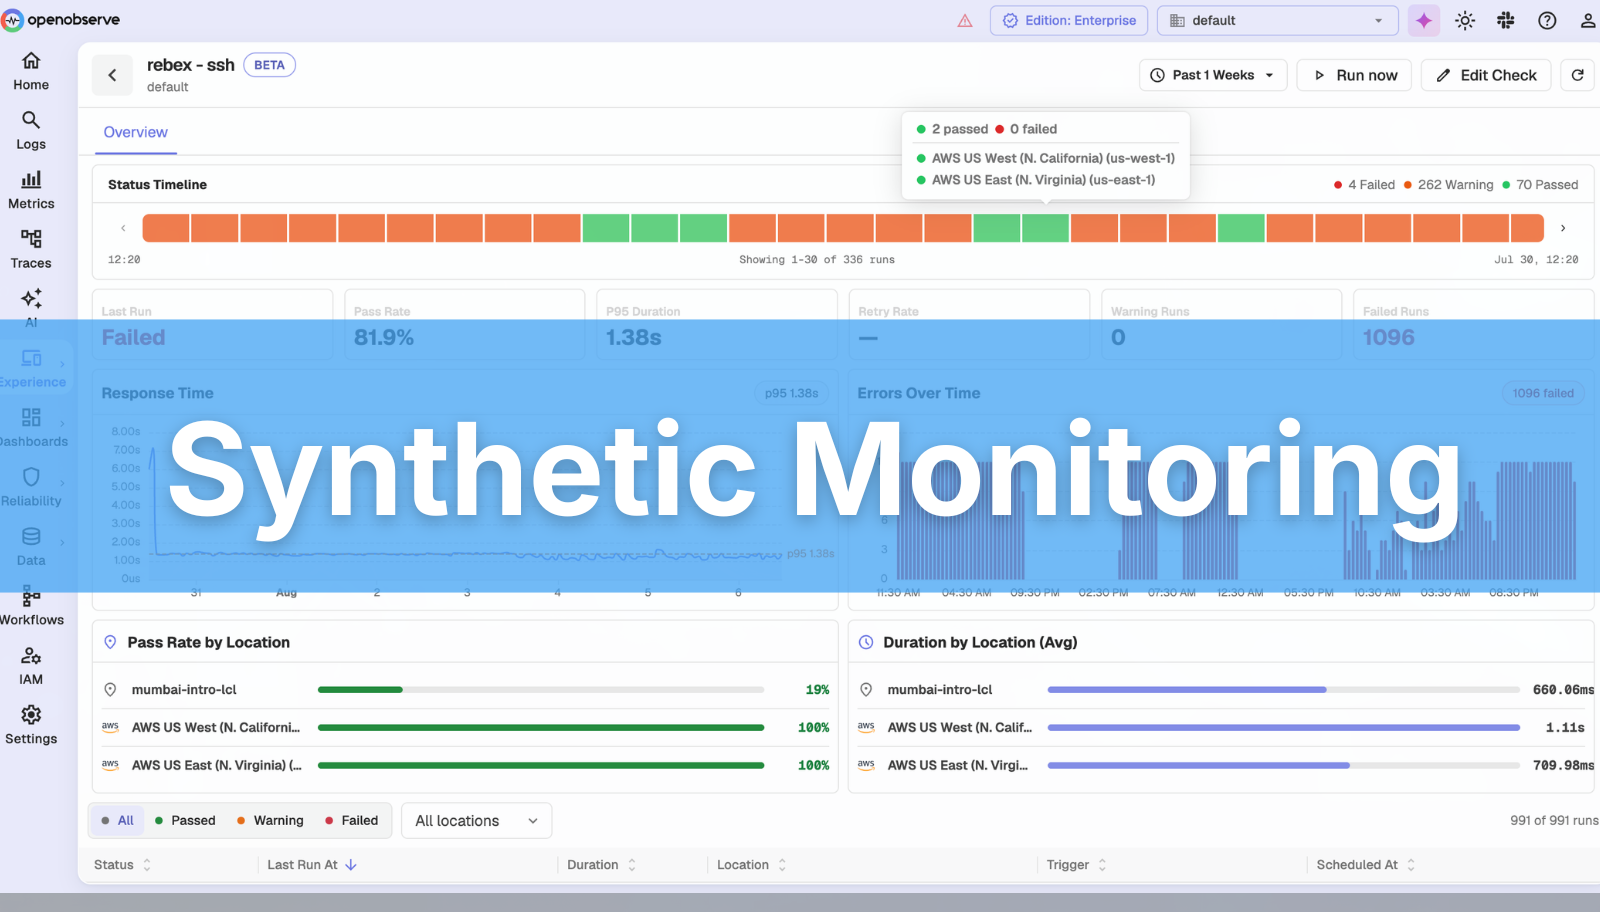
Today we are very excited to share that Synthetic Monitoring has landed in OpenObserve, available now in beta on OpenObserve Cloud. It has been one of the most requested capabilities in our community, and it works the way OpenObserve always works: built on the platform you already run, with no new silo to manage.
The 3:40 a.m. problem
Picture a Thursday. At 3:40 a.m., your checkout API starts silently failing TLS handshakes after a certificate rotation misfire. Nobody is watching a dashboard at 3:40 a.m. The first signal anyone gets is a support ticket, and by the time on-call is paged in, the outage is 47 minutes old.
Logs, metrics, and traces tell you what happened once traffic arrives. They cannot give you an outside-in view, because a system that's down can't alert on its own downness. Synthetic Monitoring closes that gap: scheduled checks that run independently of the system they watch, so you know first, not last.
Check anything your customers depend on
HTTP endpoints, TCP ports, TLS certificates, and SSH connectivity, each with per-type assertions: status codes, latency, response body, and TLS expiry. Run them on the schedule you define, from multiple locations on OpenObserve's managed probe fleet. That 3:40 a.m. handshake failure becomes a check that fails on its next run and an alert that reaches on-call at 3:41.
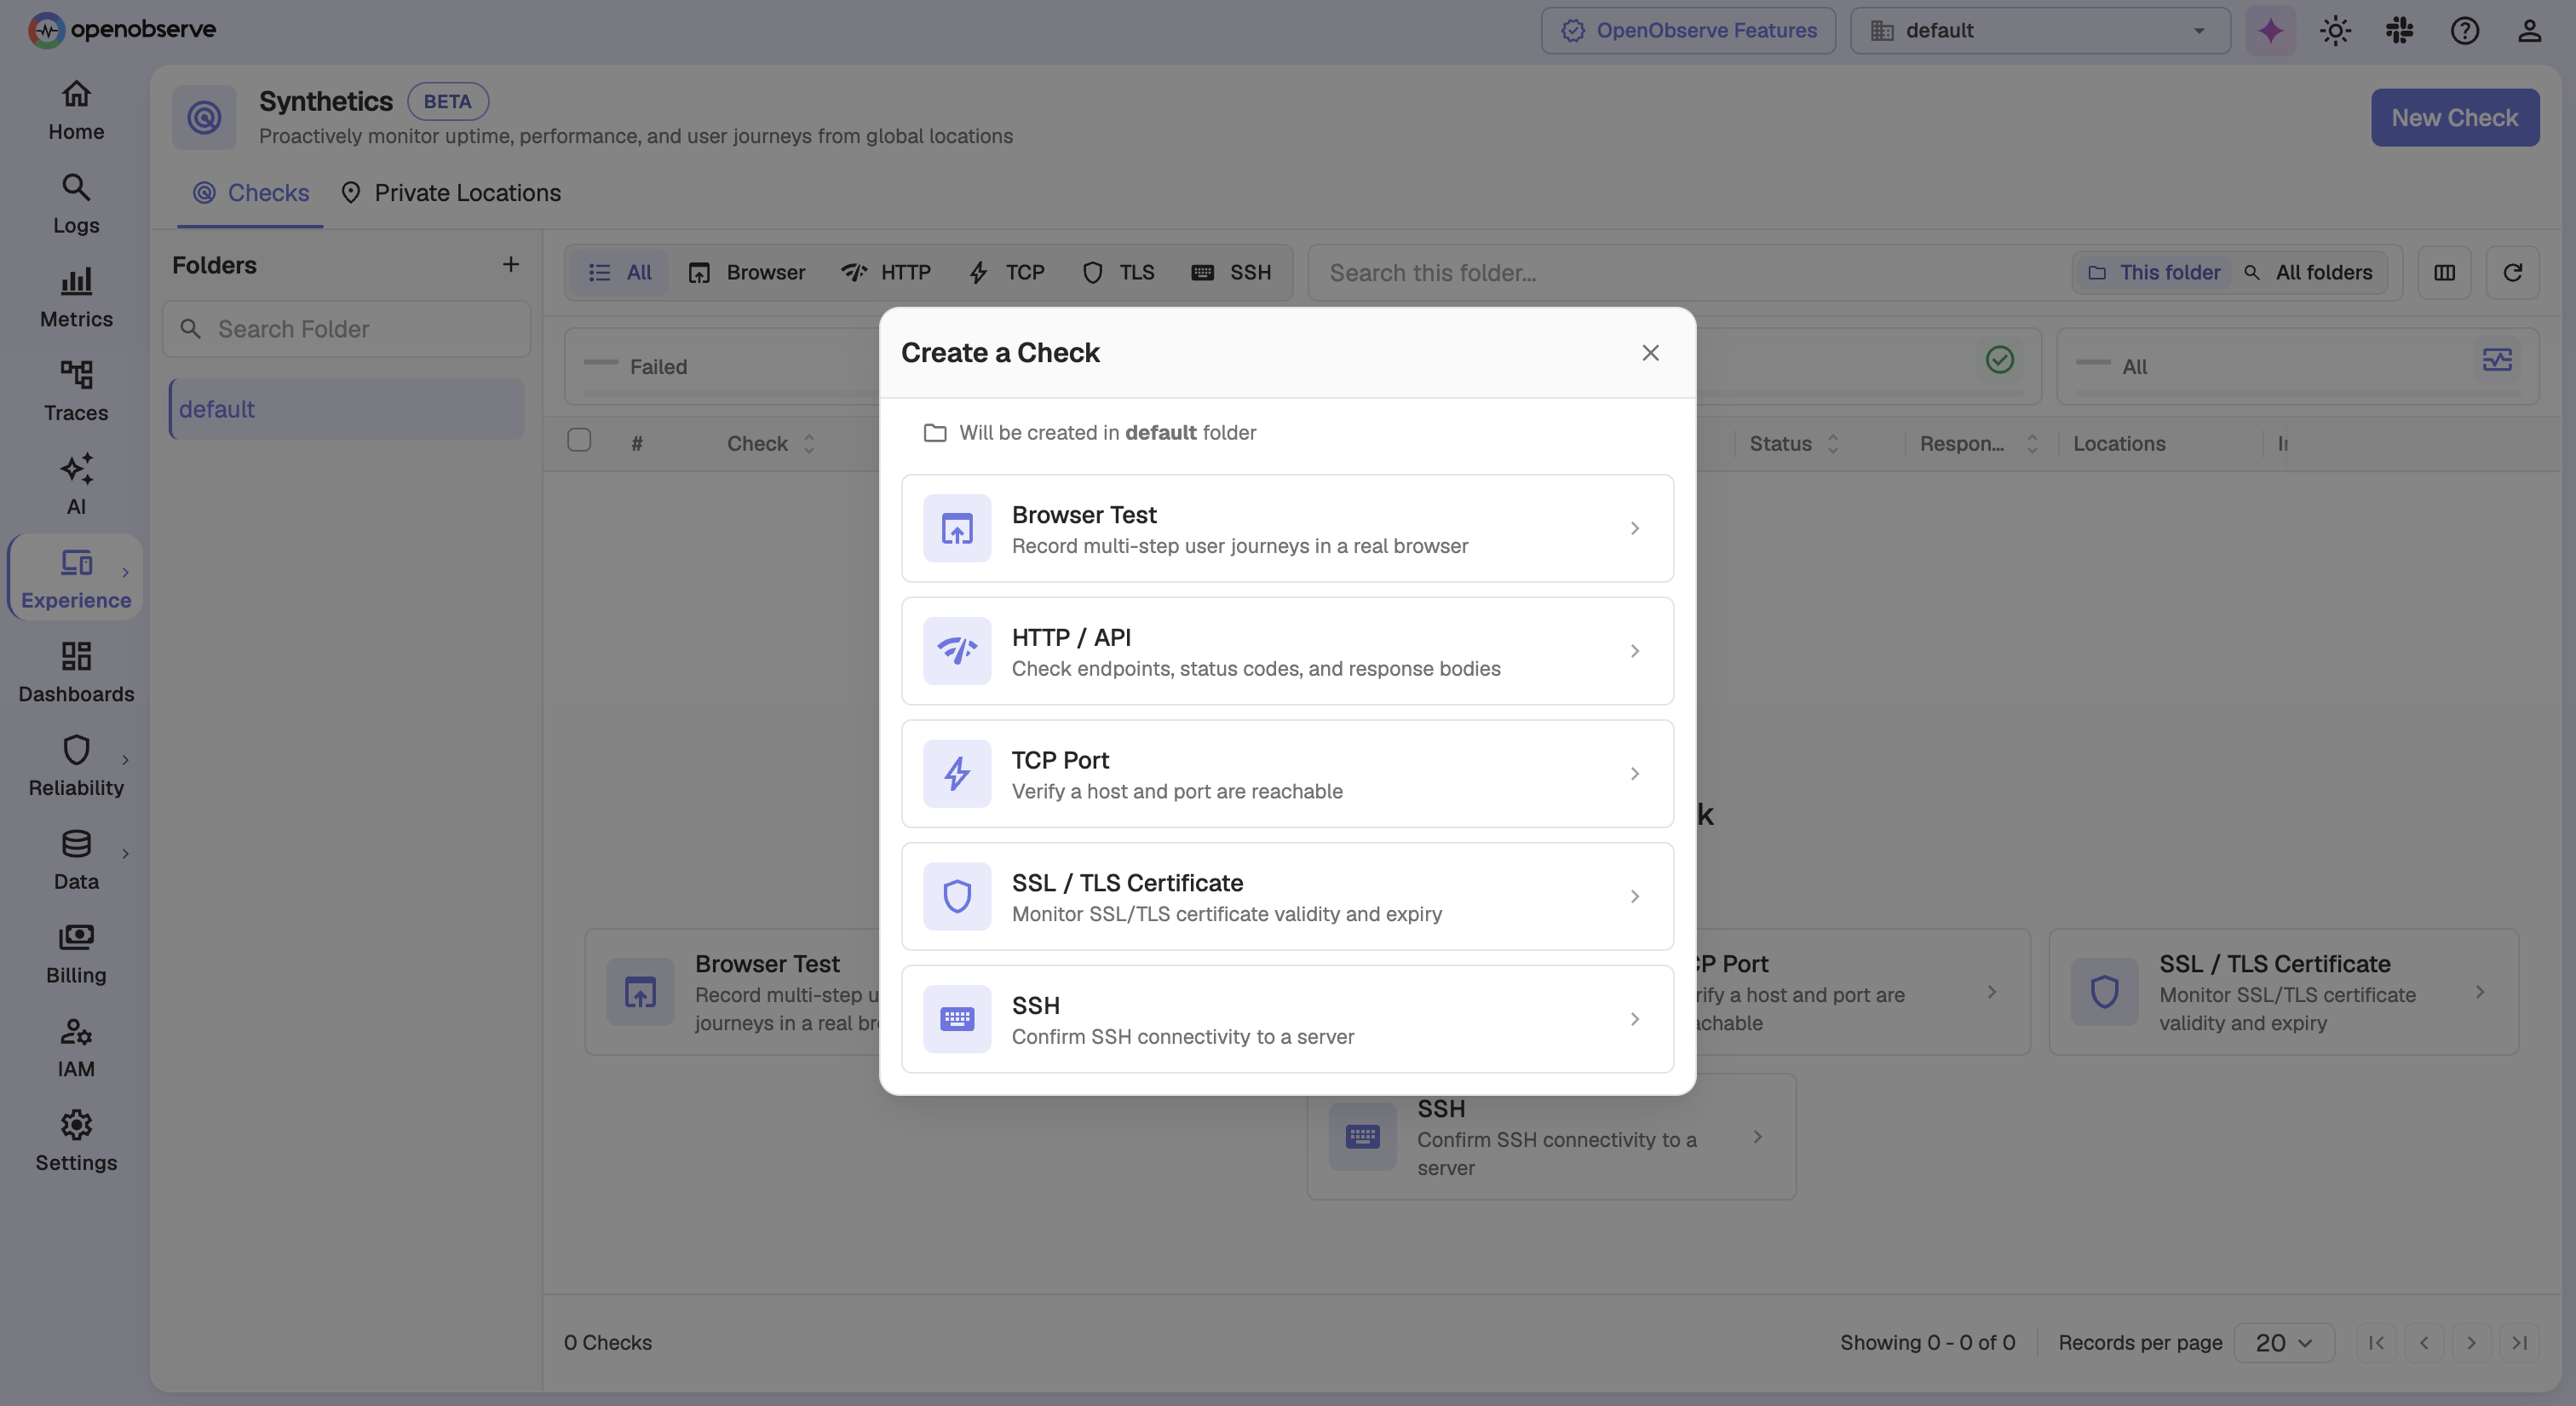
Test real user journeys, with or without code
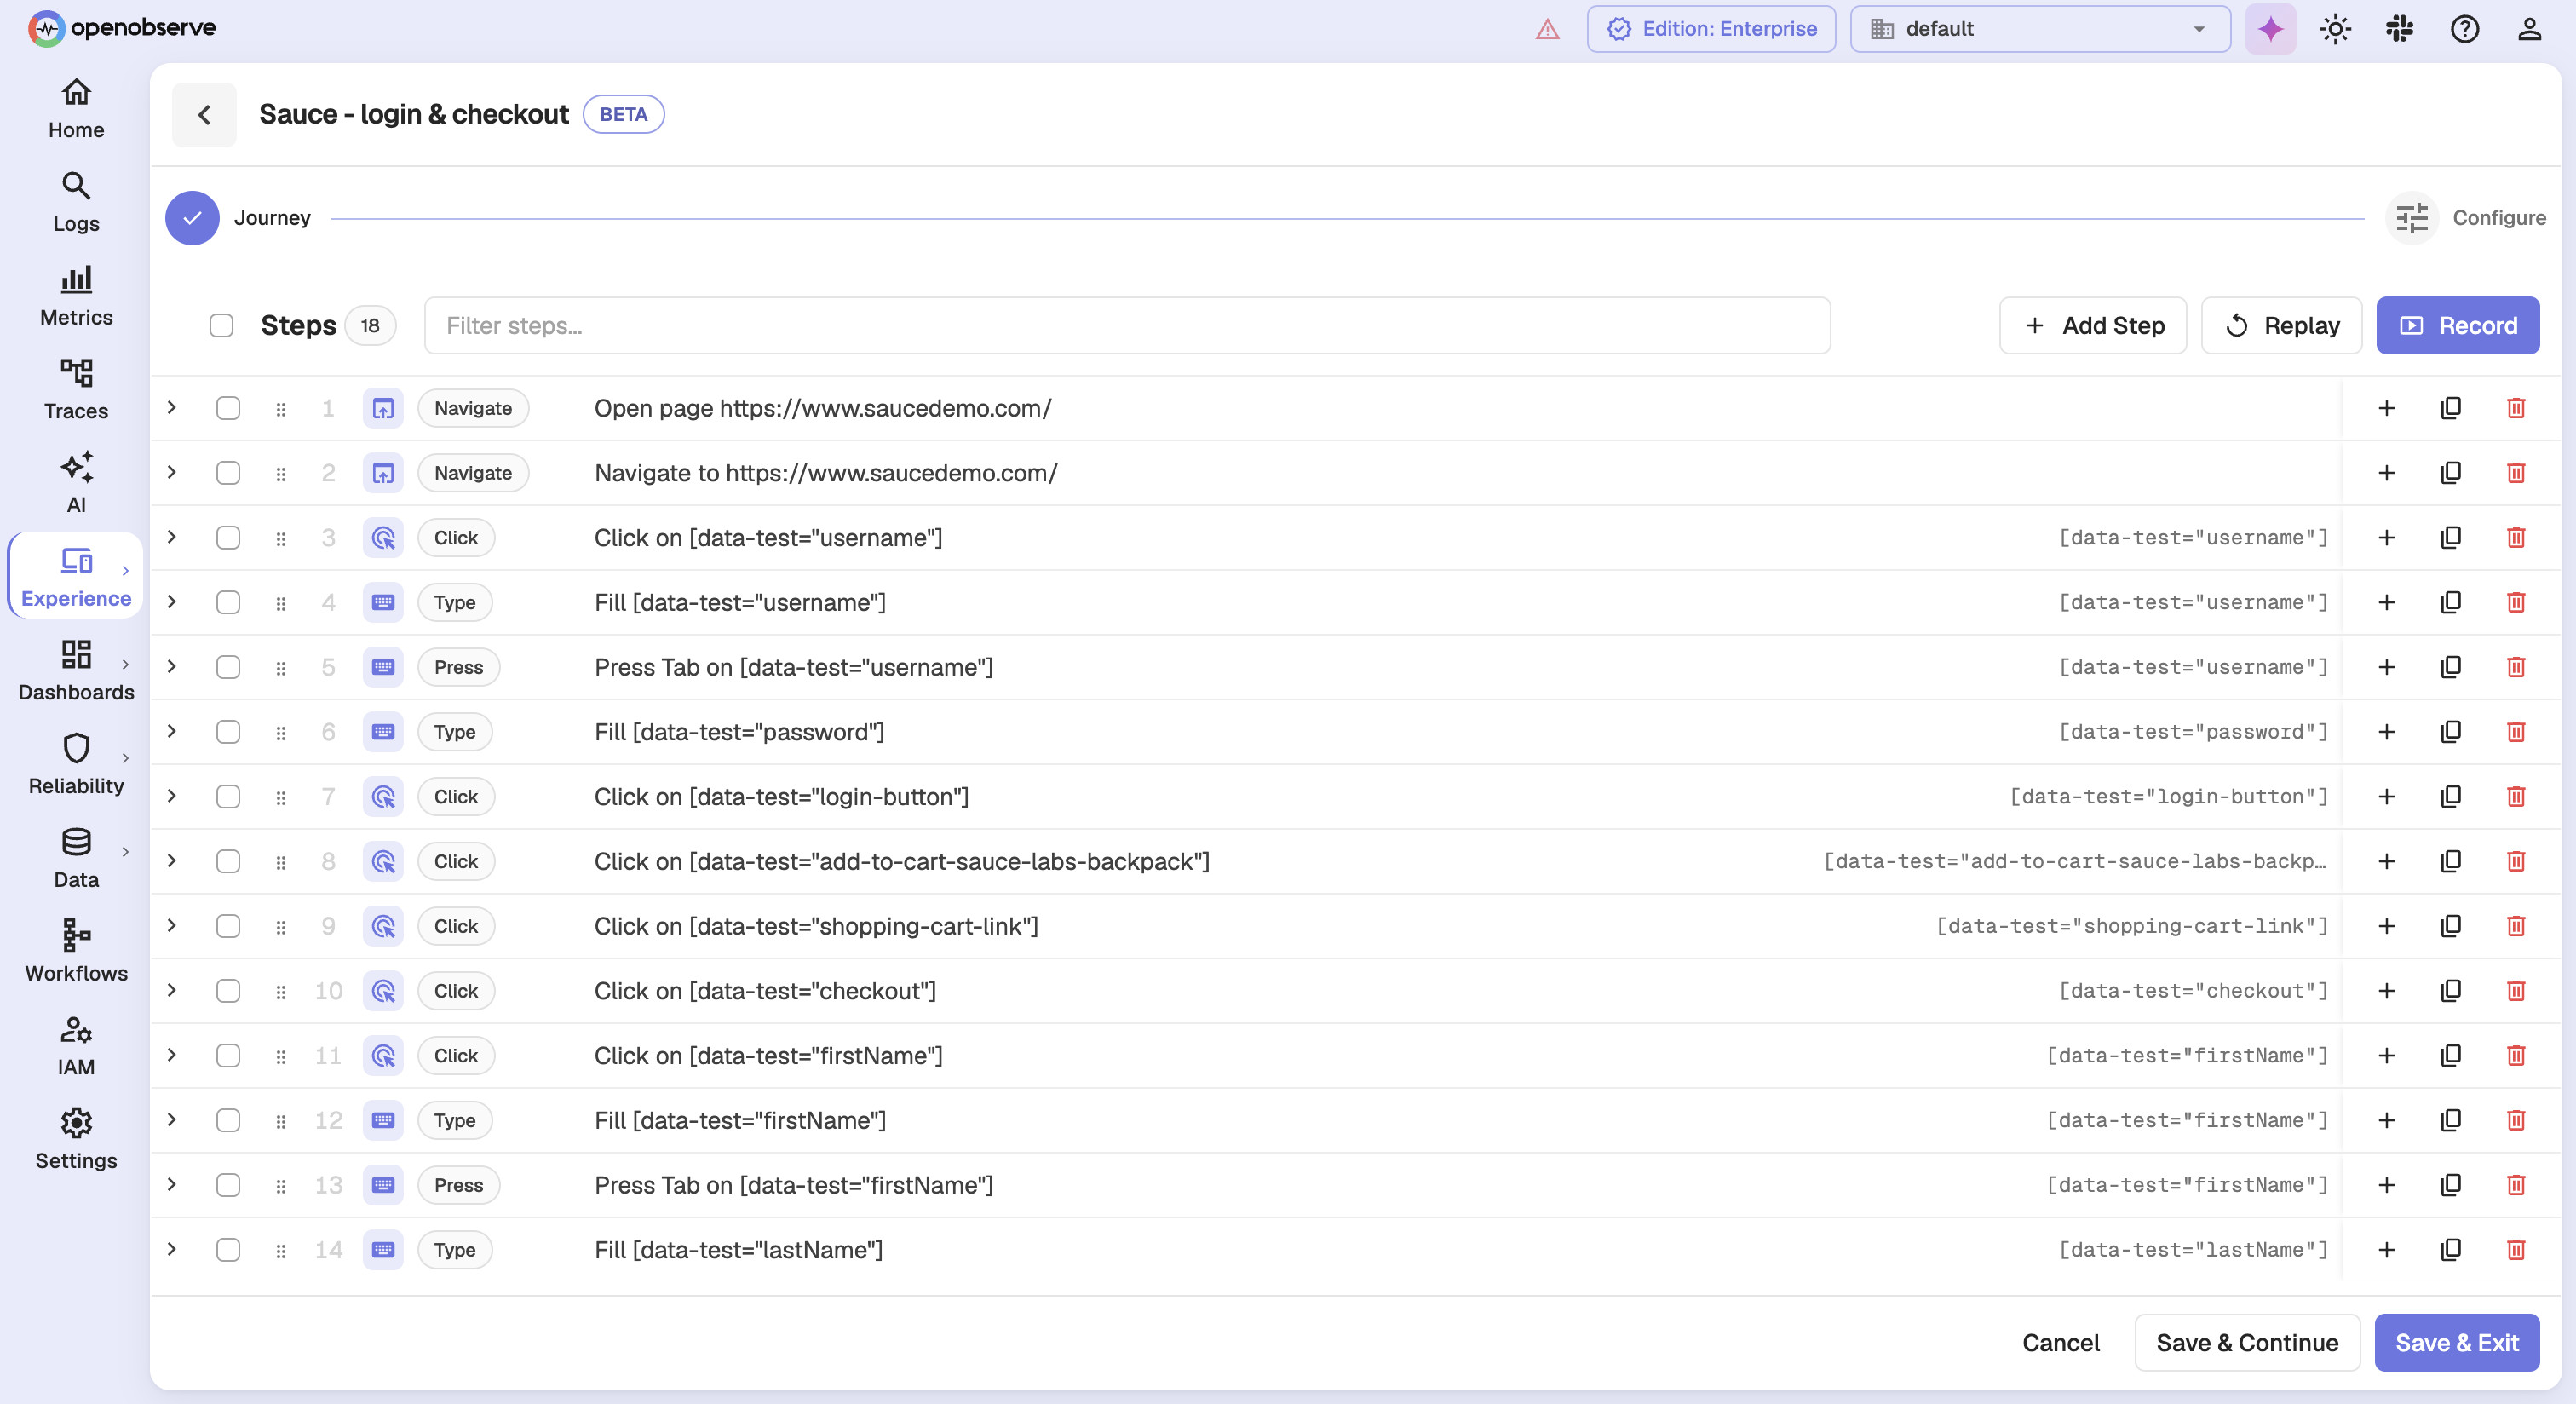
Browser checks run full @playwright/test scripts. Not a proprietary DSL, not a black-box recorder you can't review. The same scripts your engineers write for CI now run as monitors: versioned, reviewed, shipped.
And if you'd rather not start from code, don't. The built-in recorder captures a journey (log in, add to cart, check out) as you click through it in your browser, and saves it as a monitor. Record it in minutes, then refine it as code when you're ready.
See what broke, not just that it broke
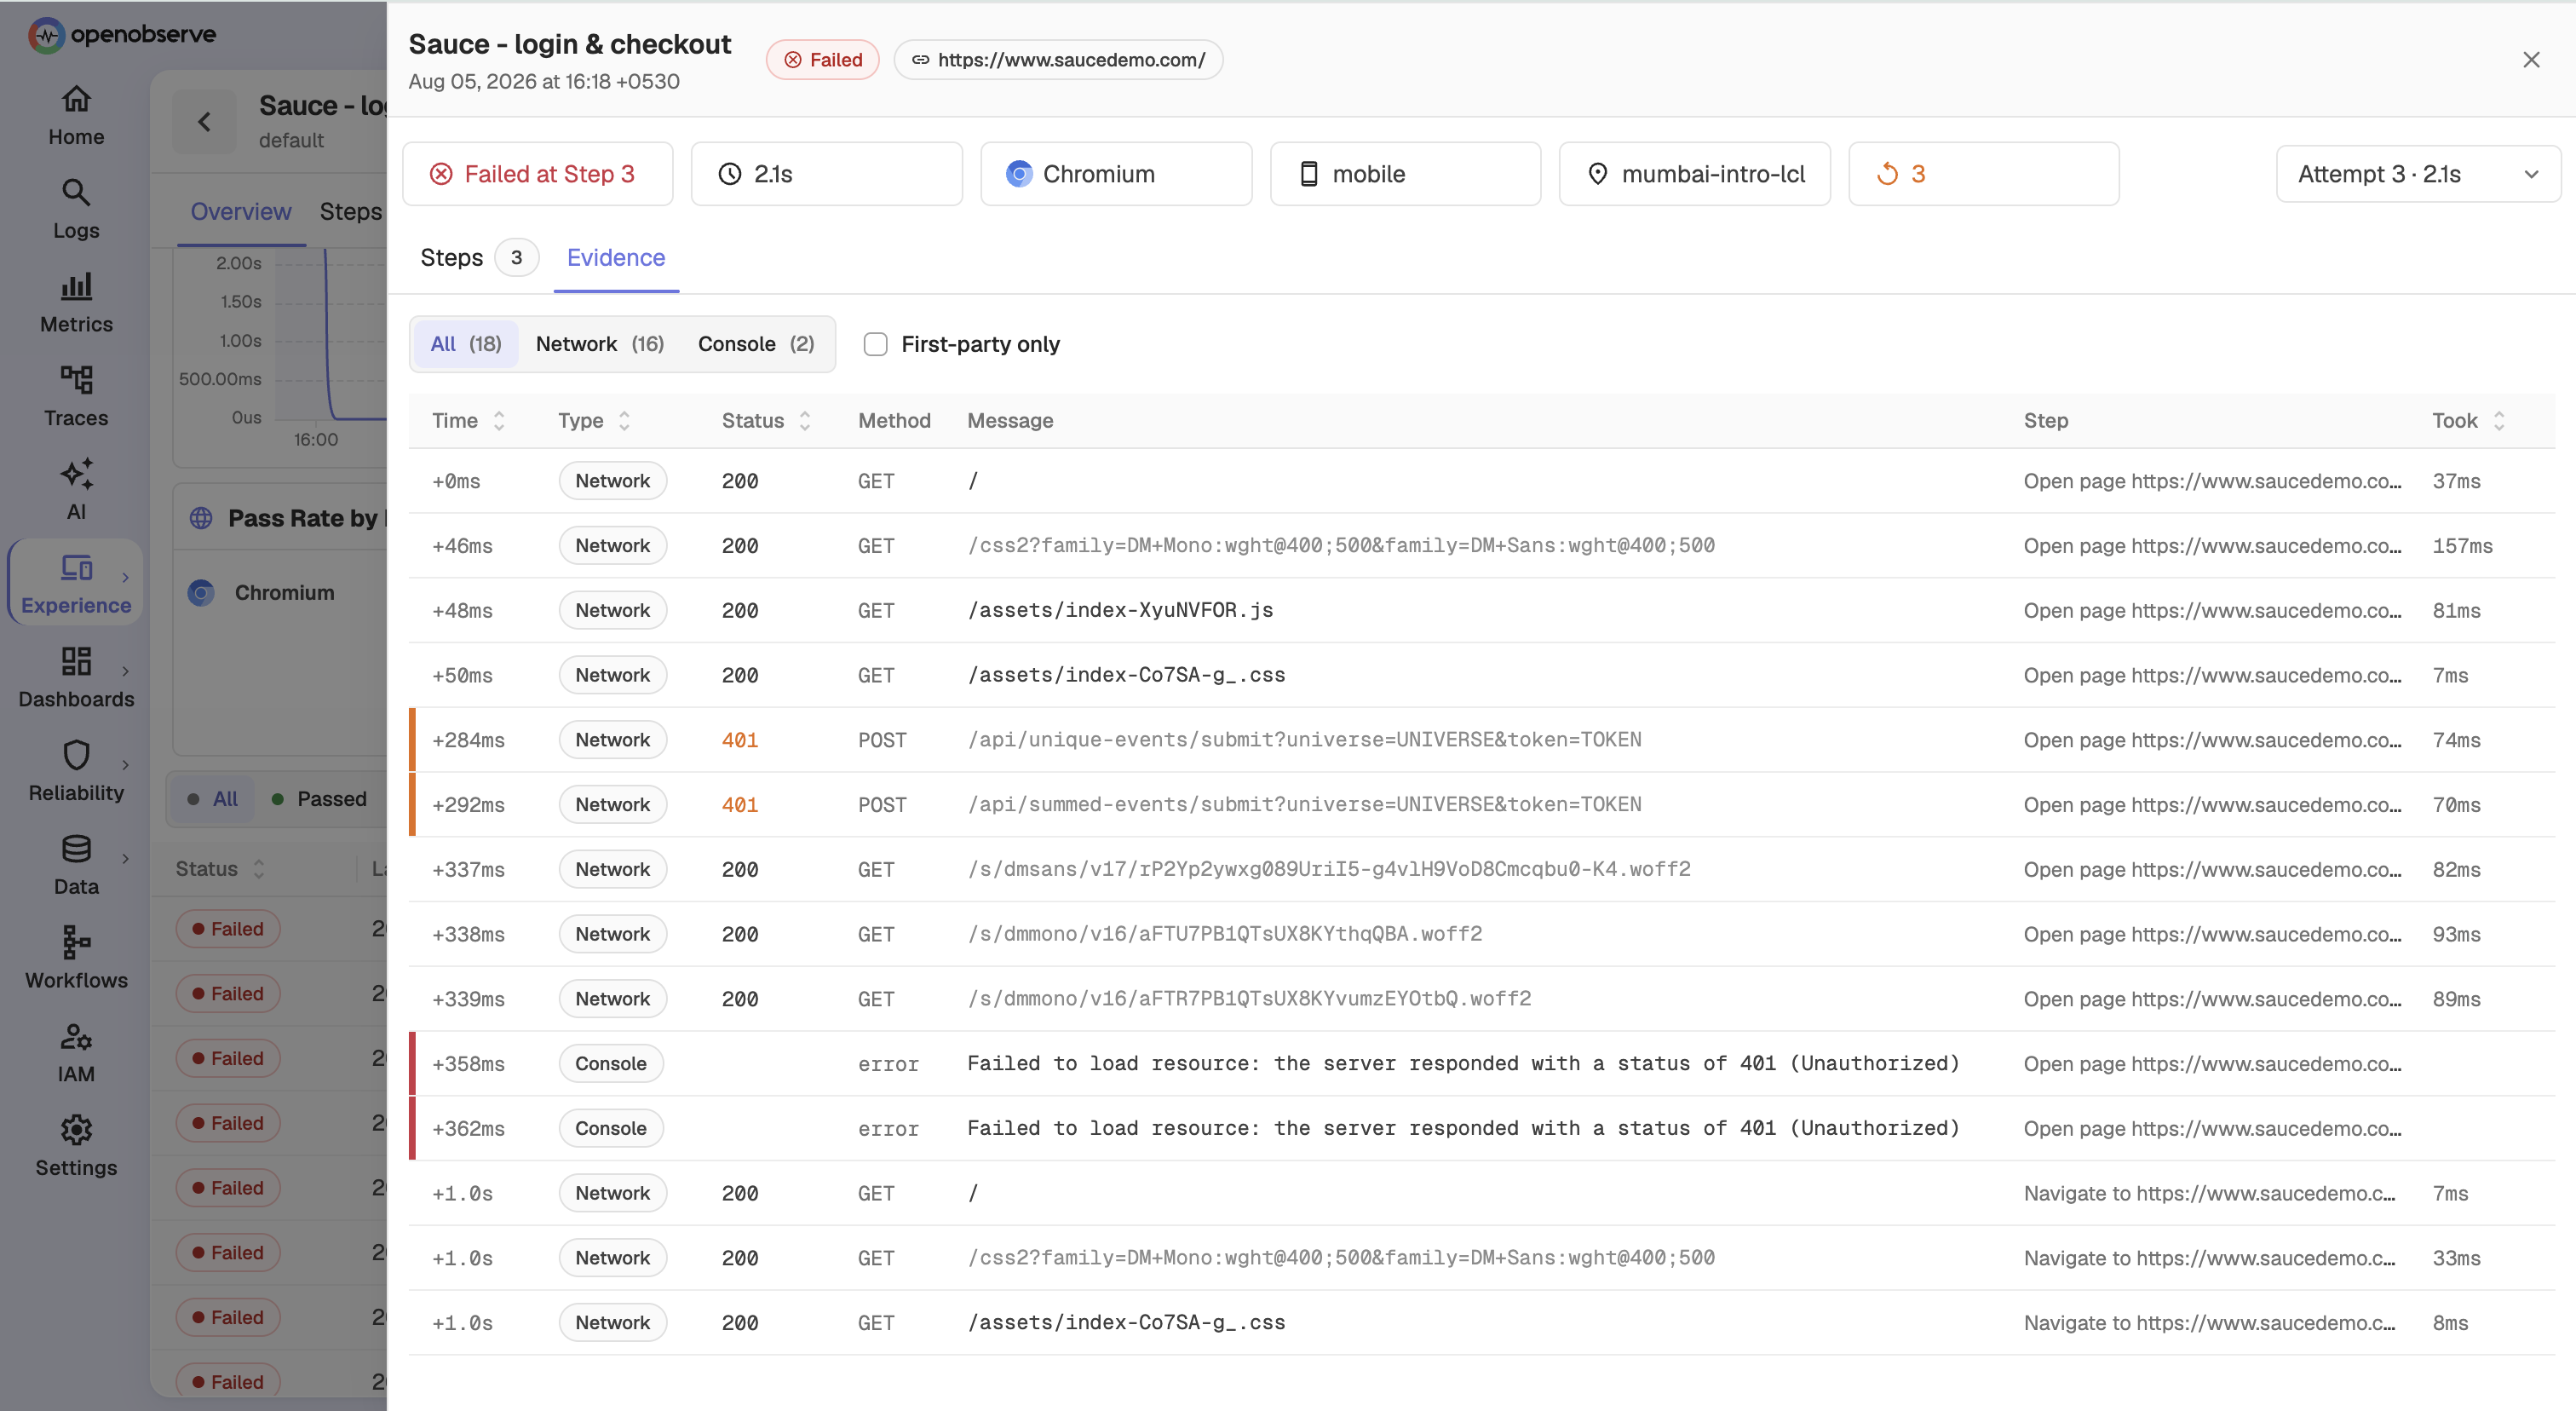
Every run keeps a per-attempt history, and every failed step comes with an evidence panel: what the check did, where it failed, with screenshots and step-level detail. The 3 a.m. grep for a cert error you haven't found yet becomes reading the exact handshake failure off the screen.
Alerting that respects your sleep
A blip is not an outage, and paging people for blips is how alert fatigue starts. Synthetics alerting classifies flaky separately from degraded, based on what the probe actually reported rather than a naive attempt count. You get the failing location with the notification, recovery notices when things come back, and cooldown controls so one bad minute doesn't become forty pages.
Reach behind the firewall
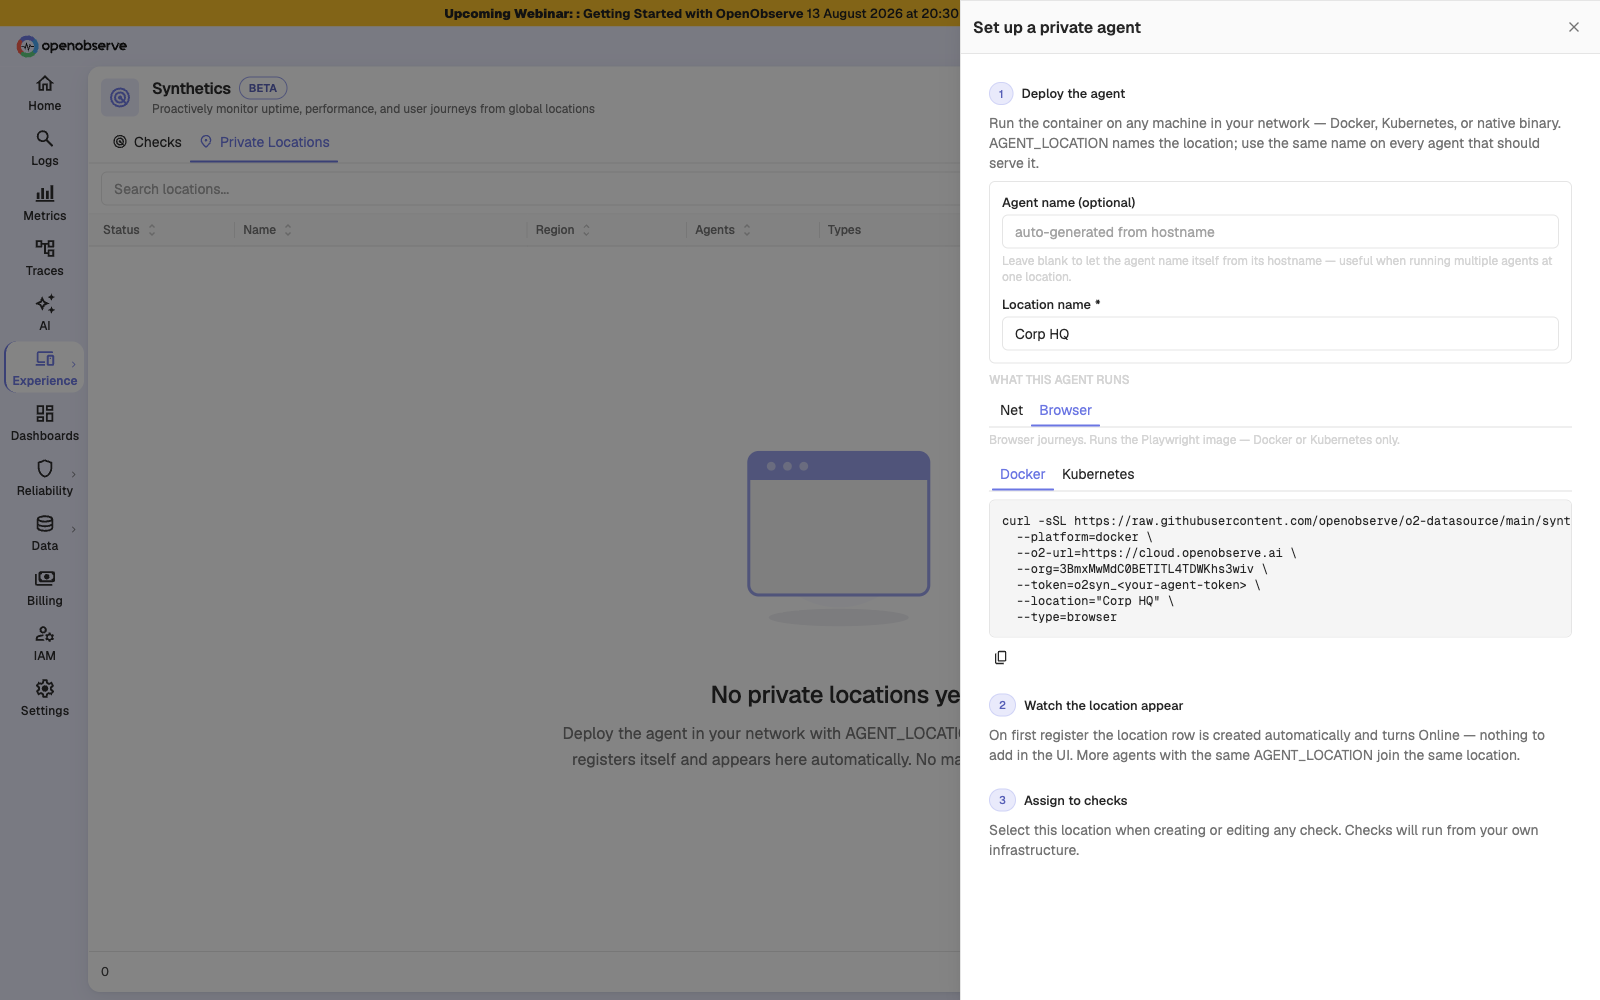
Your internal admin console and staging APIs need checks too, and no public SaaS checker can reach them without a firewall hole or shipping credentials to a third party. Private Locations solves this: a lightweight agent runs the same protocol and browser checks from inside your network, connecting outbound over HTTPS only, no inbound port required. Internal endpoints get the same checks, the same alerts, and the same stream storage as your public site. Elsewhere this capability is missing entirely or gated behind a paid tier; here it's part of the feature.
Skip the silo
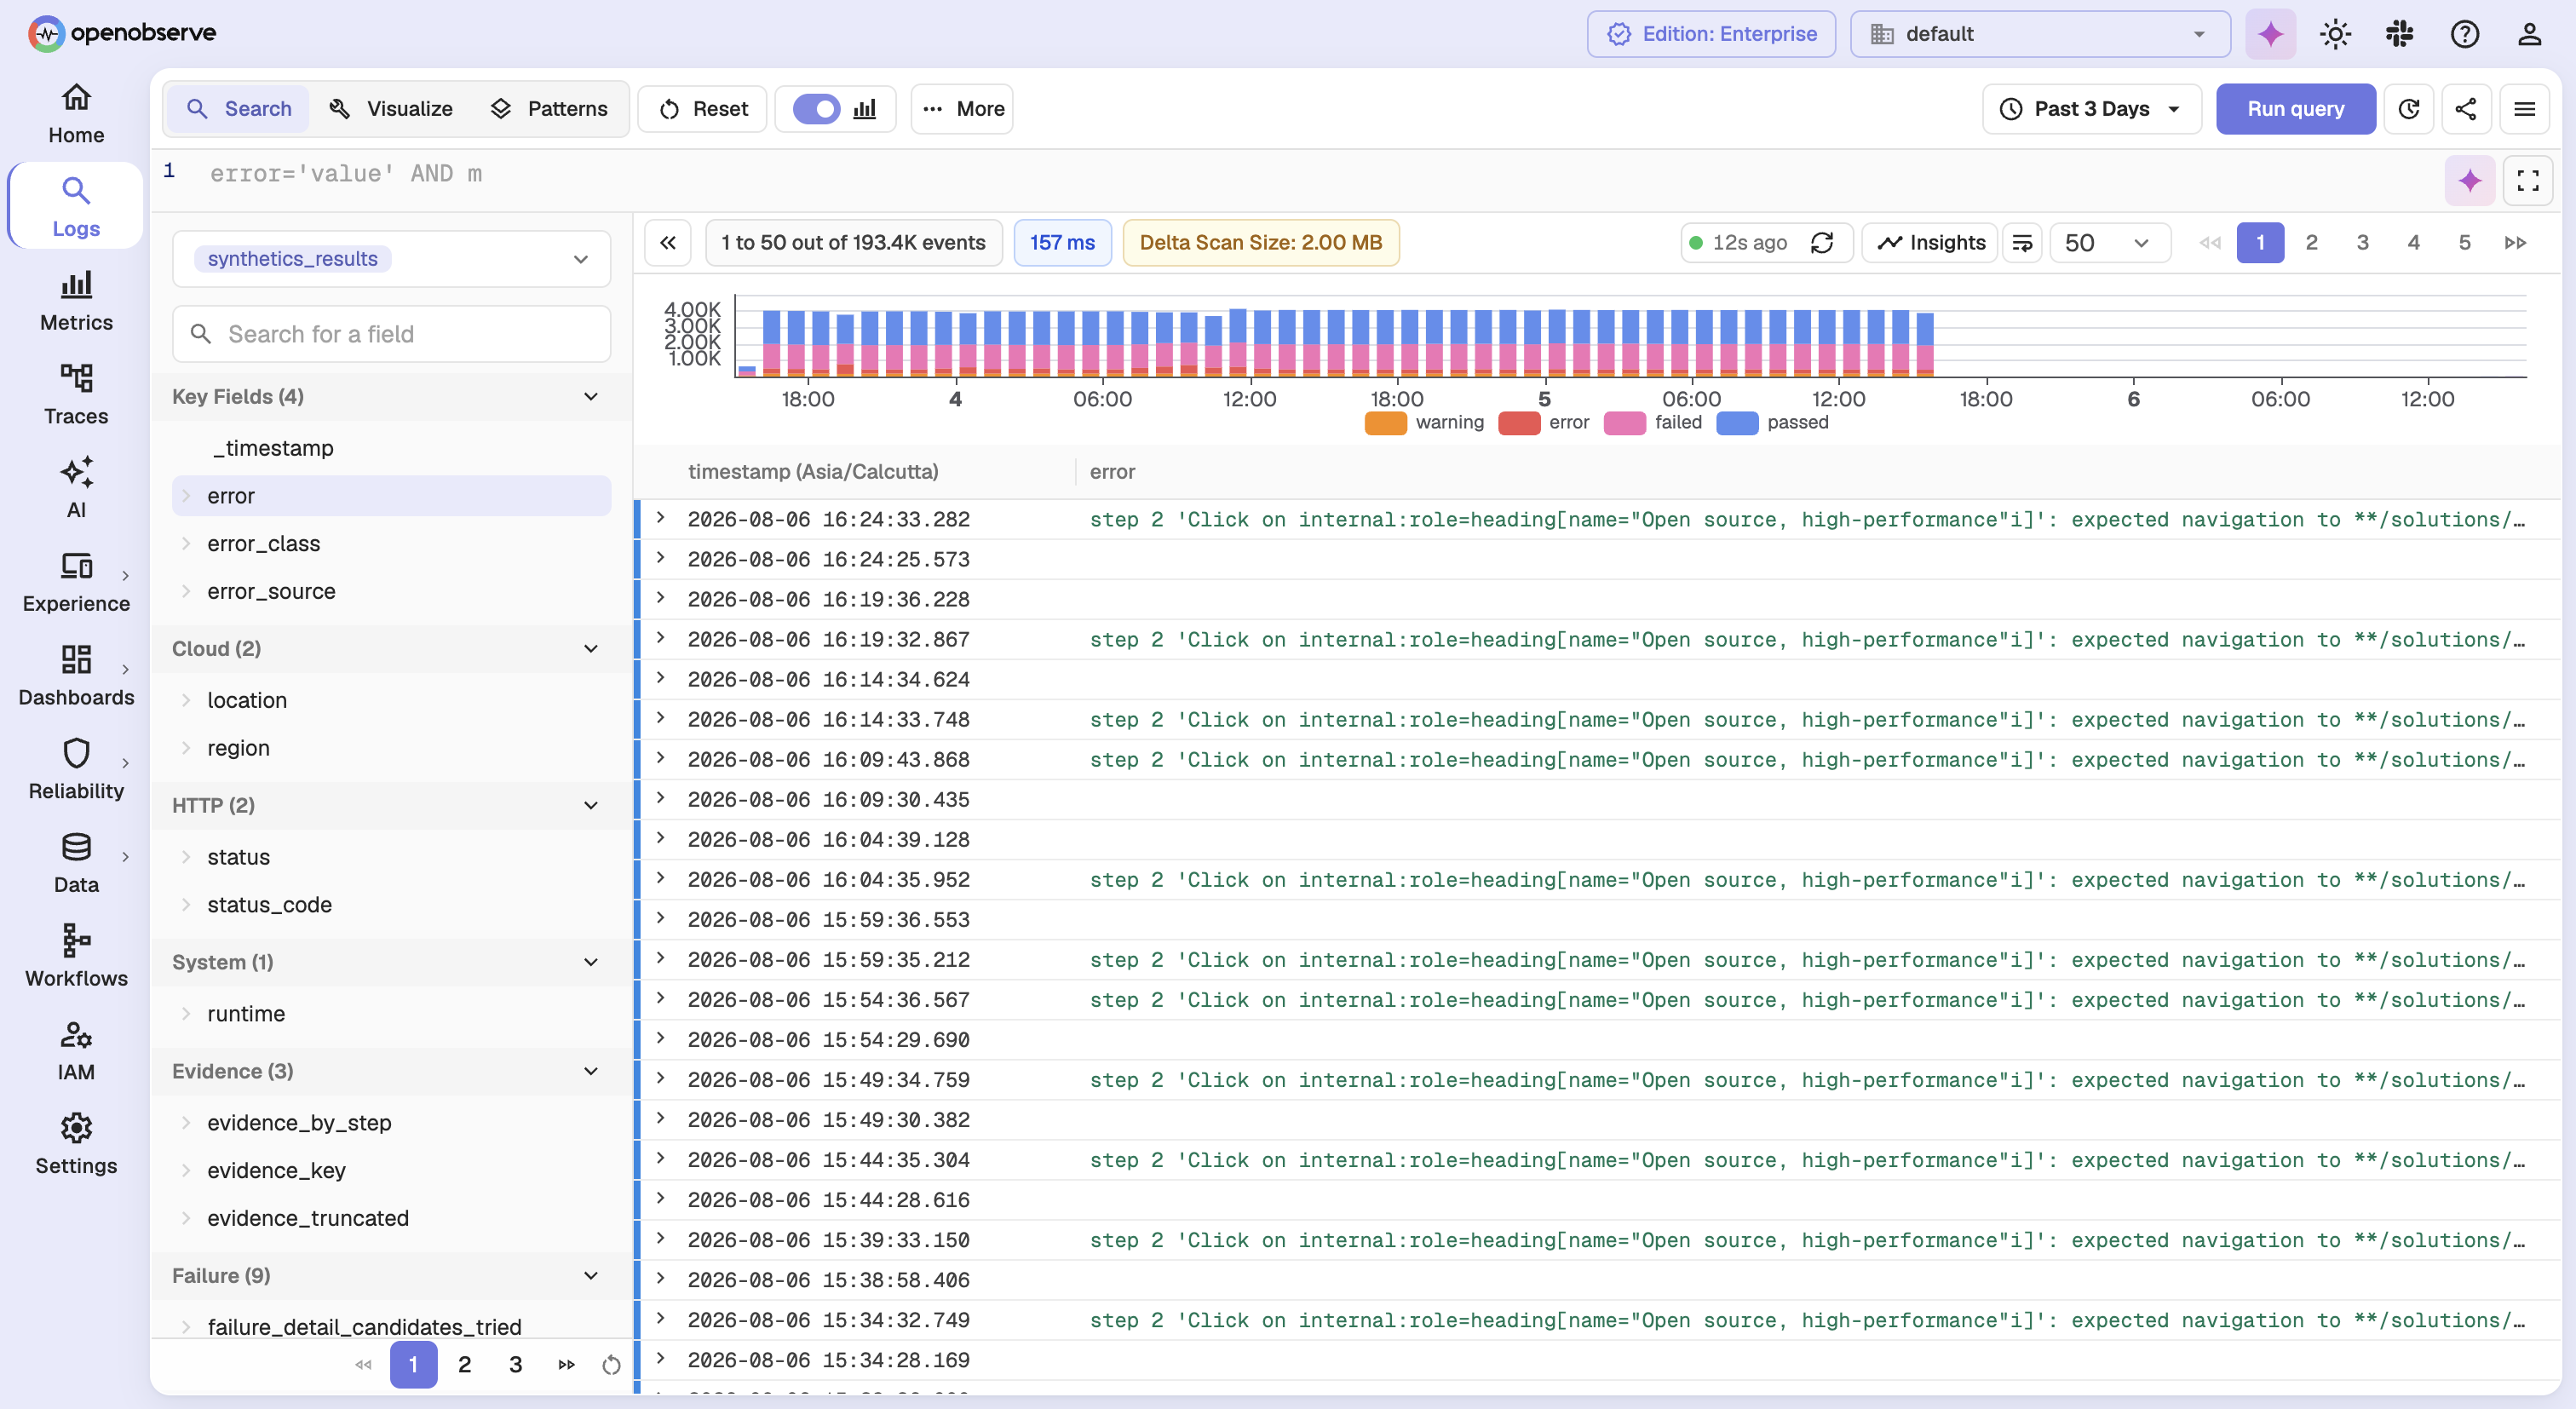
Every check result lands in a native stream, synthetics_results. Query it with SQL, dashboard it next to your logs and traces, and alert on it with the alerting you already have, with RBAC applying to synthetics like any other resource. When a check fails, the investigation is already open: no second tool, no separate correlation step, no timestamp-matching across UIs.
About the beta
You'll see a beta badge on Synthetics, and it's there for a reason: we want your feedback shaping this before it goes further. Expect fast iteration, and expect us to move quickly on what you report in the community Slack and on GitHub.
Getting started
You'll find Synthetics in the new Experience section of OpenObserve, right next to RUM: real user data and outside-in checks, side by side.
- Create your first monitor: paste a URL for an HTTP or TLS check, record a browser journey, or drop in a Playwright script
- Pick your locations and schedule, or set up a private agent for internal endpoints
- Watch results flow into
synthetics_results, then dashboard and alert like you would any other data
Your first check takes about two minutes. Check out Synthetic Monitoring Docs, see how OpenObserve stacks up against Datadog, Checkly, and the rest of the field in Best Synthetic Monitoring Tools in 2026, or see what Datadog's per-test-run billing actually costs at scale in Datadog Synthetic Monitoring Pricing: The Per-Test Trap:
Frequently Asked Questions
About the Authors
Jake Swiss

Jake leads marketing at OpenObserve. Jake spent years as a product marketer in observability, and brings a background in open source technology and reliability engineering to the role.
Simran Kumari
Passionate about observability, AI systems, and cloud-native tools. All in on DevOps and improving the developer experience.
Follow OpenObserve on Google
Add OpenObserve as a preferred source to see more of our articles in Google Search and Top Stories.