Tracing a Runaway LLM Token Spike From Session to Trace to RUM




Ready to get started?
Try OpenObserve Cloud today for more efficient and performant observability.
TL;DR
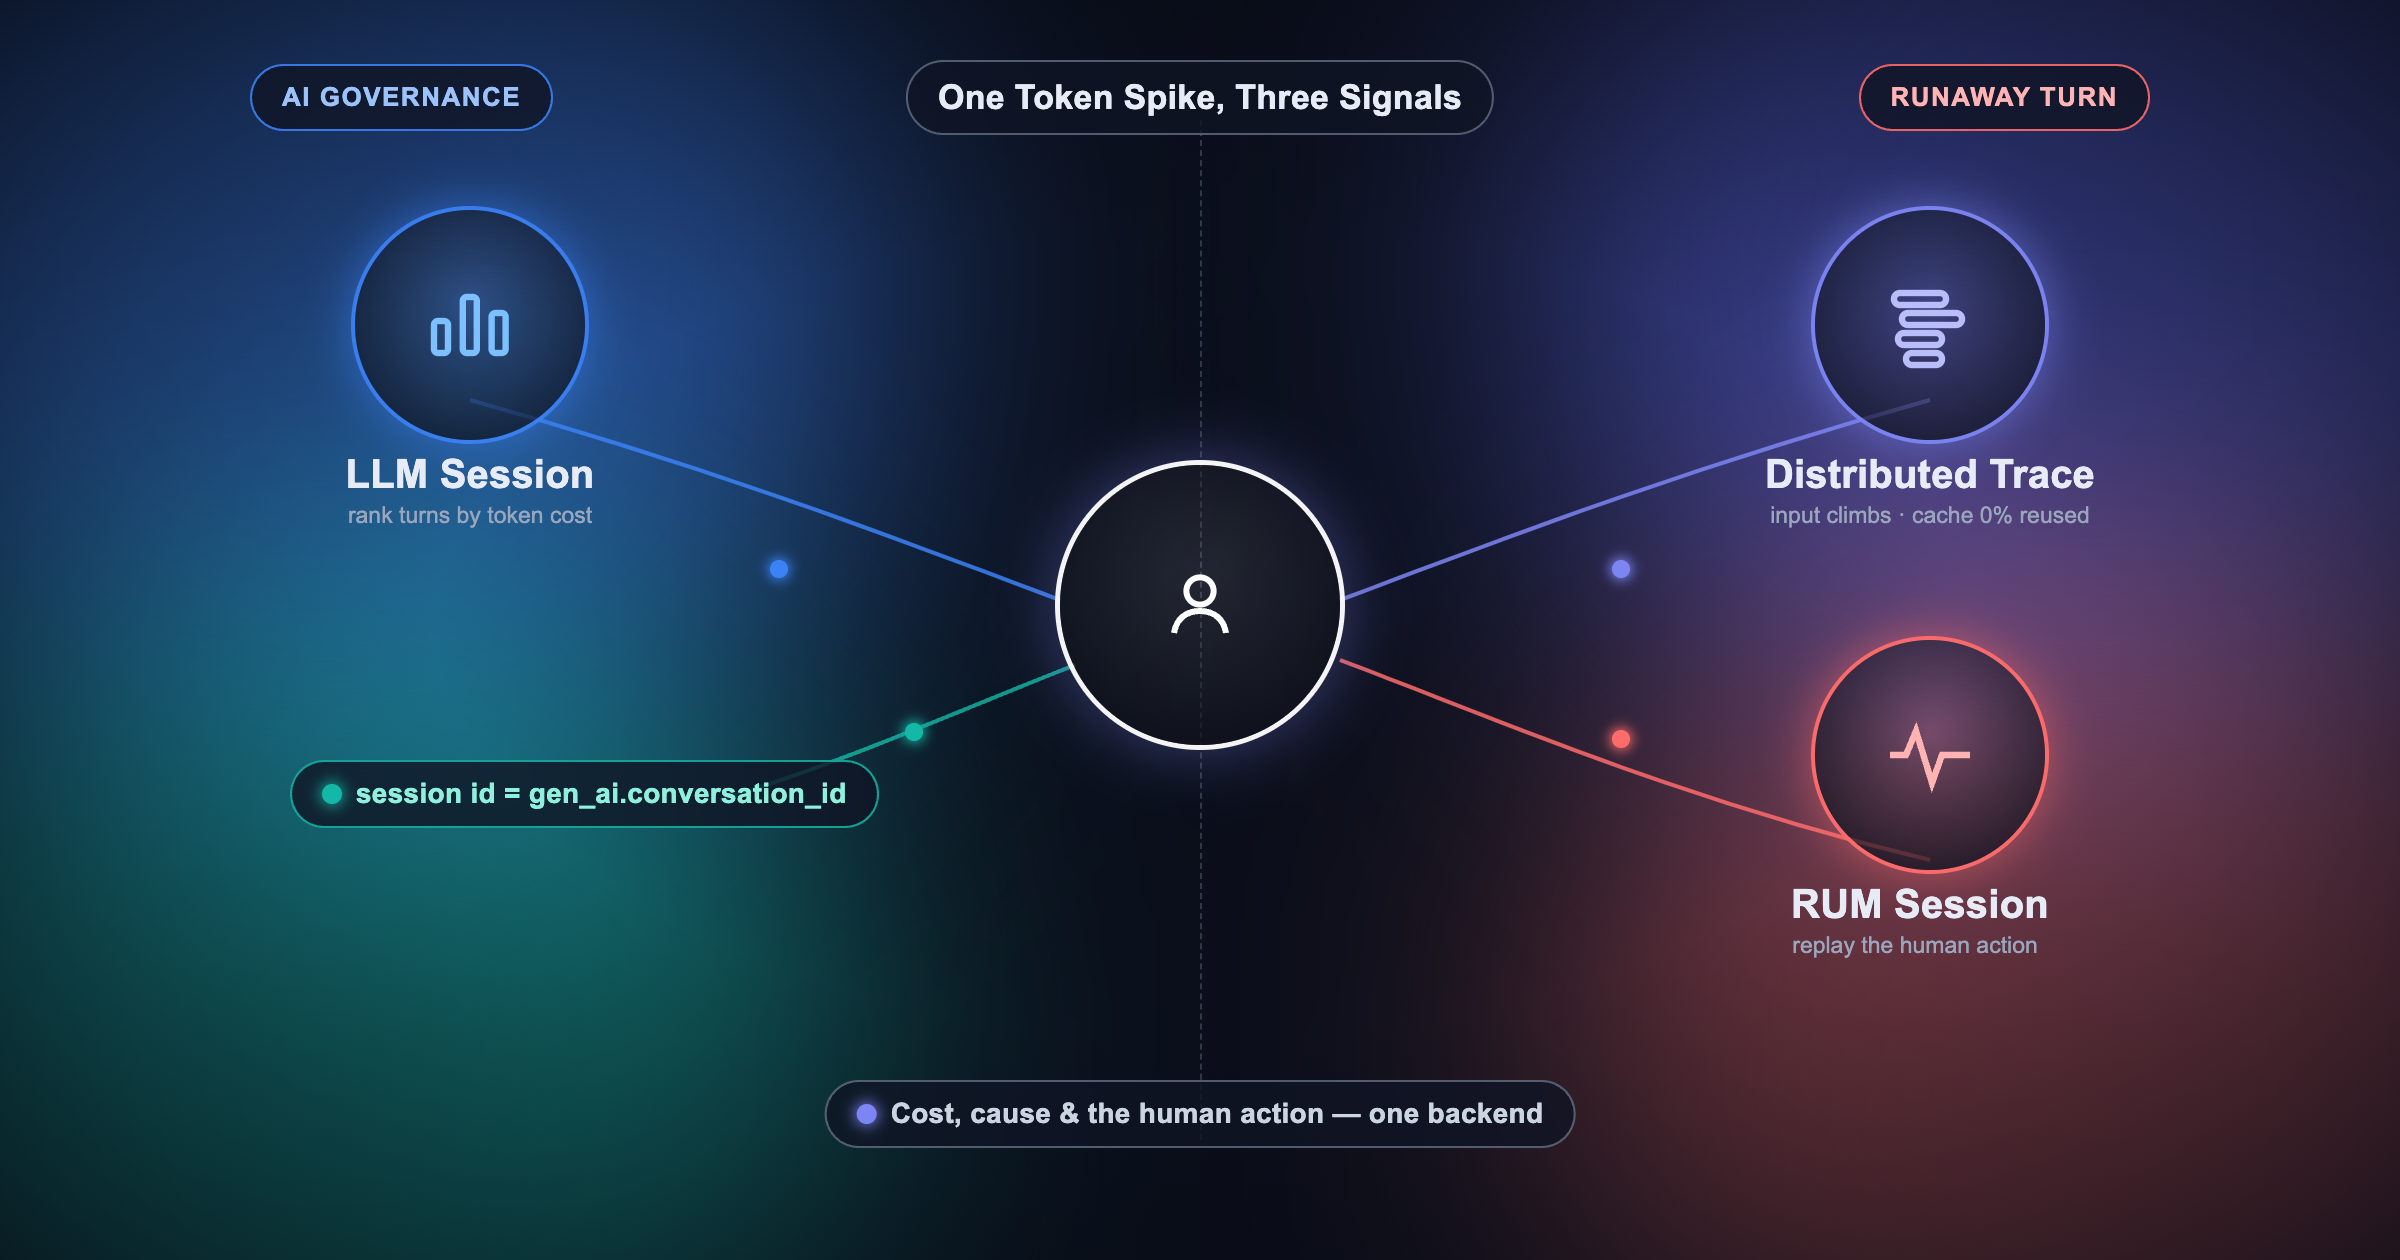
We built the LLM observability in our own product for a selfish reason first: our agent bills were starting to have turns that cost real money, and we wanted to find out why. Out of that we wired one investigation - the exact walk we now hand to a governance or FinOps lead. From here on, wear that hat: most turns cost a rounding error, and then one doesn't, and you need to walk that one across three signals without a three-team Slack thread. Here's a single session that burned far more than its neighbors, run the way those teams run it.
The three signals are the LLM session, the distributed trace, and the RUM session - and you read the first through two views. You start where the money is: the LLM Sessions list, ranked by cost, which already shows how much and who in the same table. Then the session detail for which turn and the tell, the trace for why it was so expensive, and the RUM session for what the user was actually doing. Every hop joins on one key - the session id, which the app also writes as gen_ai.conversation_id on every model span and shares with the browser RUM SDK. No exports. One investigation.
The verdict, up front: a broad "build me another dashboard" request sent an agent into a loop that re-sent its entire growing context on every model call because prompt caching was off - Cache Impact came back 0% reused. Output was tiny; input was the whole bill.
The payoff is that this whole walk happens in one backend, joined by one identifier, with no exports - so a token spike goes from a mystery that spans three teams to a three-click investigation that names the cost, the cause, and the person and action behind it. That's what the rest of this post shows, hop by hop.
Why this needs three signals
A token-cost number tells you that a session was expensive. It won't tell you the turn re-sent 40,000 tokens of context it already had, and it won't show you the user actually poking around the product while the agent churned. Three signals answer the rest - and you read the first through two views, so it's four stops in practice, each answering the next question:
- LLM session - the Sessions list → sessions ranked by cost, with the user right there in the row. How much, and who.
- LLM session - the session detail → per-turn cost/token rollup and the cache tell. Which turn, and the first clue why.
- Distributed trace → the span-by-span anatomy of that turn. Why it was expensive.
- RUM session → the human's actual interaction, replay included. What they were doing.
Note what the list already answers: who. Attribution isn't a reveal you have to earn three hops later - it's column four of the first screen. That frees each later hop to do its own job: the trace explains the cost, and RUM shows the behavior behind it. The trick that makes them one investigation instead of three is a shared identifier. Set it once, pivot forever.
Prerequisites
- OpenObserve with traces and RUM. RUM and session replay are in the open-source edition - no Enterprise license needed for Hop 3. The AI-specific views used in Hops 1 and 2 - LLM Sessions, Session Detail, and the trace Thread view - are Enterprise surfaces (that's the edition shown in the screenshots). The underlying correlation - one shared id across the trace and RUM streams - works wherever you ingest both signals.
- An LLM app or agent instrumented with the OpenTelemetry GenAI semantic conventions, emitting
gen_ai.usage.input_tokens,gen_ai.usage.output_tokens,gen_ai.usage.total_tokens, andgen_ai.usage.coston each model-call span, plusgen_ai.request.modelandgen_ai.operation.name. Critically, setgen_ai.conversation_idequal to your application session id - that's the join key. - The browser RUM SDK initialized with
trackUserInteractions: trueand the same session id, so the user's UI session is recorded and correlatable:
import { openobserveRum } from '@openobserve/browser-rum';

openobserveRum.init({
  applicationId: 'web-application-id',
  clientToken: '<your_rum_client_token>',
  site: 'your-openobserve-host',
  service: 'my-web-application',
  env: 'production',
  version: '1.0.0',
  trackUserInteractions: true,
  sessionReplaySampleRate: 100,
});
sessionReplaySampleRate: 100 captures 100% of sessions for replay - right for reproducing this walk, but in a cost-conscious production setup you'll likely dial it down and sample.
Hop 1 - Sessions list, then detail: how much, who, and which turn
Start in AI → LLM Sessions, the ranked table of agent sessions. Scope it to the stream you care about, sort by cost, and the outliers float up. Most rows are cents; a handful aren't.
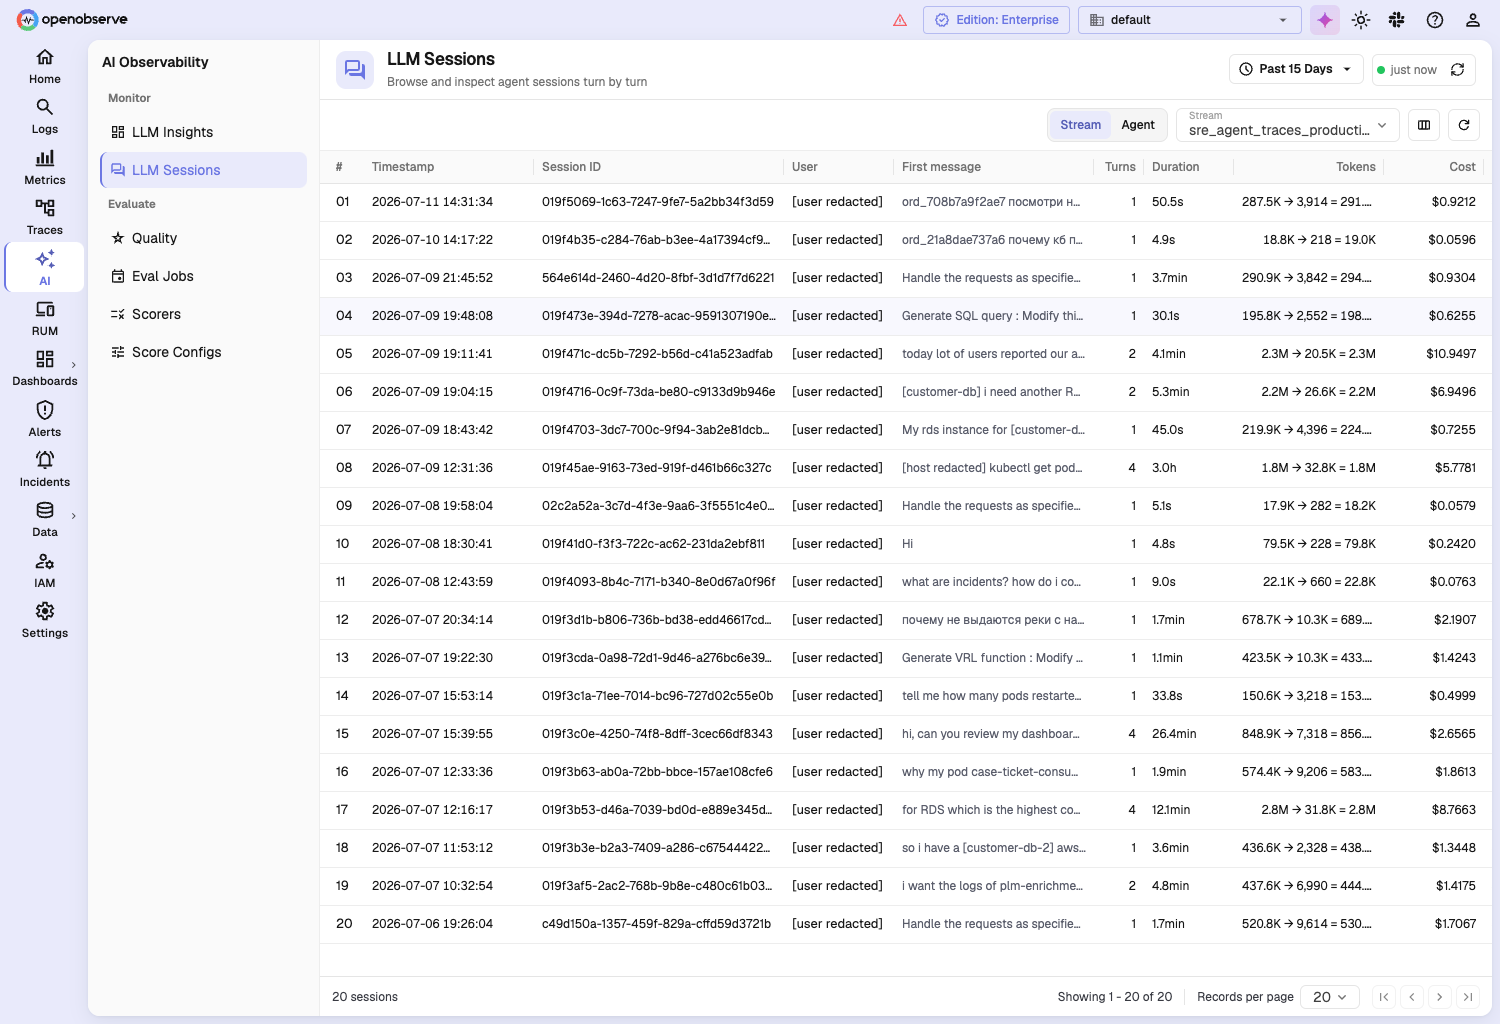
One row jumps out: a 2.2M-token, $6.9496 session from 2026-07-09, its first message "[customer-db] i need another RDS Logs and Metrics dashboard…" - against neighbors that mostly cost cents. And notice the User column: the person is right there in the table. You haven't opened anything yet and you already have how much and who. (One gotcha worth knowing: several agents can share the same name across streams, so filter by the stream - here sre_agent_traces - not the agent name, or you'll land on a different agent's sessions.)
That answers how much and who. For which turn and the first clue why, click the row into Session Detail - the rollup that does the per-turn token-and-cost math for you.
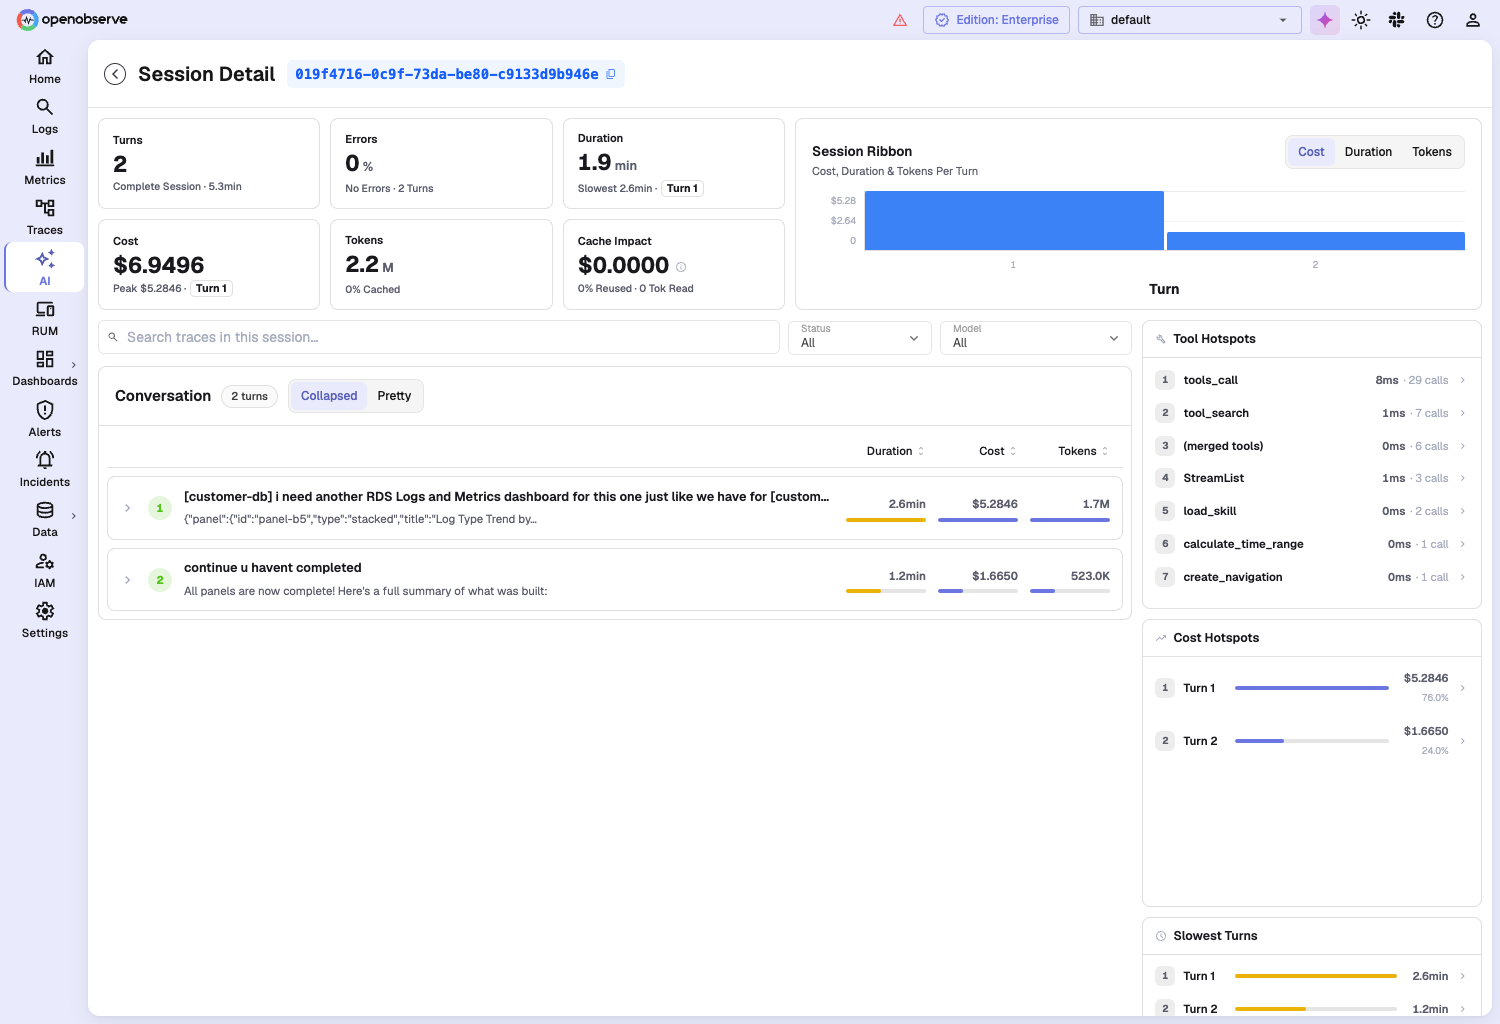
Two turns, zero errors, $6.9496 of model spend against 2.2M tokens. (Two different durations show up and it's worth knowing why: the Duration tile reads 1.9 min of wall-clock - actual elapsed time - while the "5.3 min" under Turns is summed turn time. An agent runs overlapping model and tool calls, so the summed compute time exceeds the elapsed time.) That already reads high for a two-turn session. Two tiles decide where you look next:
- Turn 1 is the outlier: 2.6 minutes, $5.2846 - 76% of the session cost - for 1.7M tokens on its own.
- Cache Impact: $0.0000, 0% reused, 0 tokens read. Hold that thought; it's the whole case.
The Turn 1 prompt (customer identifiers redacted) is mundane: "[customer-db] i need another RDS Logs and Metrics dashboard for this one just like we have for [customer-db]." A perfectly reasonable ask that somehow cost five dollars in one turn. The Tool Hotspots panel hints at why - tools_call alone fired 29 times and tool_search seven, on top of a long tail of smaller tool invocations - so the agent looped hard to assemble that dashboard. (Those are tool invocations, counted across the session; the model calls that actually burn tokens are a separate count, and we get to them in Hop 2.)
If you're not in the UI, the same outlier hunt is one query against the GenAI trace stream. (OpenObserve flattens dotted OTel attribute names to underscores at ingest, so you query gen_ai_usage_total_tokens, not gen_ai.usage.total_tokens.)
SELECT
  gen_ai_conversation_id,
  SUM(gen_ai_usage_total_tokens) AS tokens,
  SUM(gen_ai_usage_cost)        AS cost
FROM "sre_agent_traces"
WHERE gen_ai_operation_name = 'chat'
GROUP BY gen_ai_conversation_id
ORDER BY tokens DESC
The top rows are your expensive sessions. (Add gen_ai_request_model to the GROUP BY if you want to split a multi-model session by model - then each row is a session-and-model pair rather than a whole session.) Ours was right there. Now for why Turn 1 was so heavy - time to open its trace.
Hop 2 - Trace: why the turn is so expensive
The Session Detail row links straight to the turn's trace. Same session id in the header, so you know you're looking at the right thing. The raw Waterfall tab shows 199 spans, 0 errors - but it's a wall of near-identical client POST spans that proves the turn was busy, not why it cost so much. Switch to the Thread tab, the trace's LLM-aware view: it reads the gen_ai attributes and lays the turn out as the chat it actually was - each model call with its model, tokens, and cost.
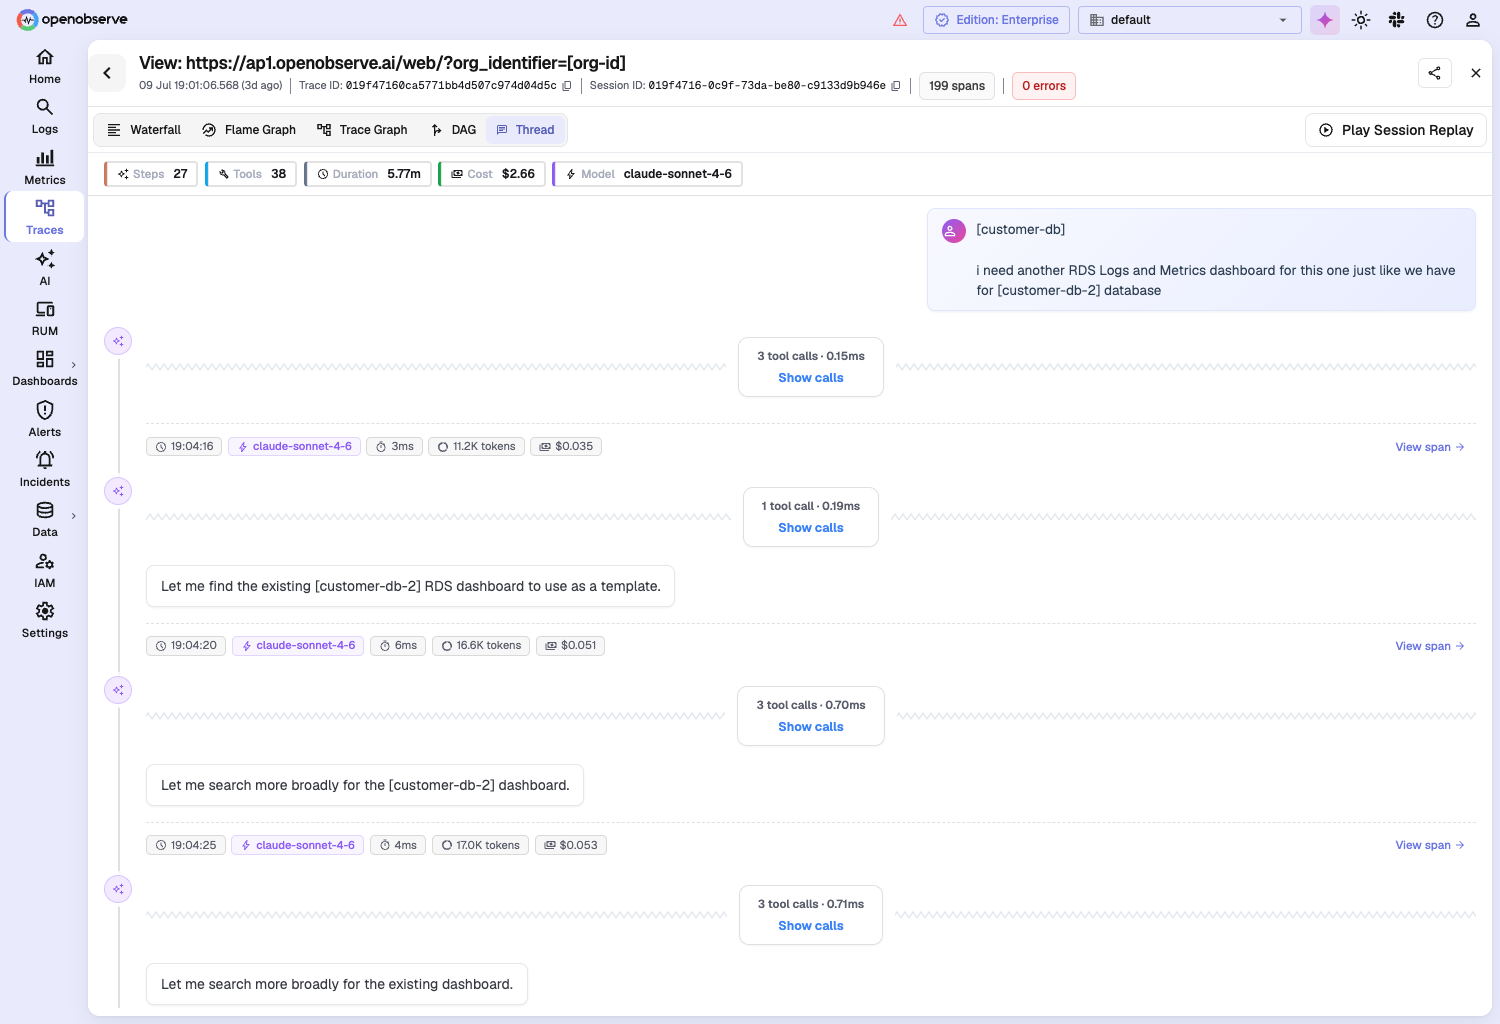
The chip-bar sums it up: 27 steps, 38 tool calls, claude-sonnet-4-6, $2.66 for the model calls alone. That $2.66 is the chat-span total - the actual model calls. It's less than the $5.28 the Session Detail rollup showed for this turn because the rollup is the full user-facing accounting: it also counts the generate_content mirror spans and tool-call tokens. So the two numbers answer different questions - $2.66 is "what did the model calls cost," $5.28 is "what did the turn cost, all in" - and the Verify section calls out how to reproduce each. Either way the shape of the bill is the same: input-heavy, climbing every call.
The header confirms the join that matters: the Session ID here is the same 019f4716-0c9f-73da-be80-c9133d9b946e from Hop 1 - that identity (session_id == gen_ai.conversation_id) is the actual join. The Trace ID (019f47160ca5771bb4d507c974d04d5c) happens to share the leading 019f4716. That's a coincidence of timing, not the link: the session id is a time-ordered UUIDv7, so its leading bytes encode when it was minted, and any id created in the same ~minute-wide window carries the same prefix. Treat it as a sanity check that the two are contemporaneous - the id equality is the join, never the shared prefix.
The chat timeline is where the diagnosis jumps out. Each turn's footer carries its token chip, and reading top-down they climb - 11.2K, 16.6K, 17.0K, and on up - while the assistant's replies stay short. To read the whole series exactly, not just the first few visible turns, run the query behind this view:
SELECT
  gen_ai_usage_input_tokens  AS in_tokens,
  gen_ai_usage_output_tokens AS out_tokens,
  gen_ai_usage_cost          AS cost
FROM "sre_agent_traces"
WHERE trace_id = '019f47160ca5771bb4d507c974d04d5c'
  AND gen_ai_operation_name = 'chat'
  AND gen_ai_usage_input_tokens > 0
ORDER BY _timestamp
Across the 27 model calls - so 26 call-to-call steps - the input tokens climb almost monotonically from 11,095 to 46,343: 25 of those 26 steps go up or hold, while the output never exceeds ~687 tokens. That shape is the entire diagnosis. Output is trivial. Input is the bill, and it grows every single call.
Now the Hop 1 tile pays off. Cache Impact was 0% reused. With caching off, every one of those 27 calls re-sent the full, growing conversation - the system prompt, the tool definitions, every prior tool result - and paid for all of it again. The agent wasn't broken and there was no attack. It was an uncached loop building a dashboard, re-billing its own context 27 times over.
That's the "why." For what the user was doing, the trace has a Play Session Replay button in the top right. One click.
Hop 3 - RUM: what the user was actually doing
Because the model spans carry gen_ai.conversation_id and the browser SDK shares the same session id, that replay button drops you straight into the right user's RUM session - no searching. It lands you on the session, not the exact second; this is a ~50-minute RUM session (the user's whole browsing window - far longer than the agent's 1.9-minute compute, and expected to be), so you still scrub to the turn's window. But you're in the right place instantly instead of hunting across sessions.
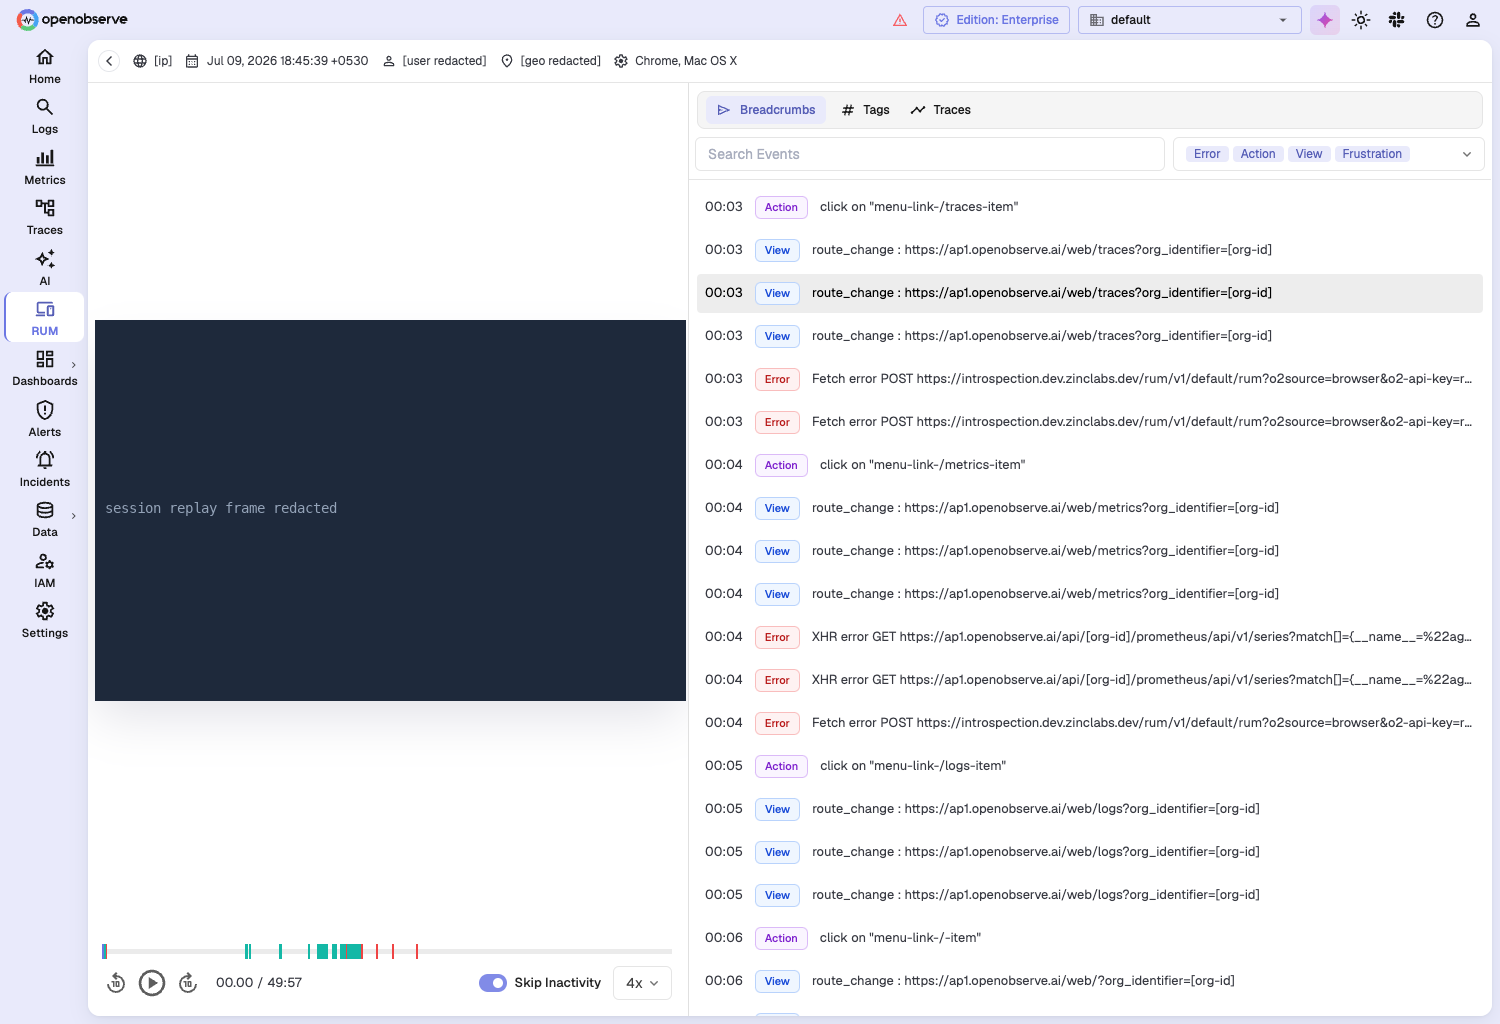
You already know who - that was the User column back on the sessions list. What you don't have yet is what they were doing, and that's what RUM adds. The breadcrumb timeline is the human's-eye view of the same window: click on "menu-link-/traces-item" → a route_change View to traces, then metrics, then logs, then home - the user poking around the product while the agent churned through its dashboard build. (The breadcrumbs show navigation, not the click that kicked off the turn - to tie a specific action to the model call you'd scrub the replay to the turn's timestamp; the value here is that you're in the right user's session to do that.) Identity and org identifier are redacted here. A near-50-minute session, real Action/View/Error events, the actual clicks. The RUM view even has a Traces tab that links back to the trace - the loop closes both ways.
That closes the loop opened in Hop 1. The token spike wasn't malicious and it wasn't a bug. It was a broad, iterative dashboard-build request - "another one, just like the last" - handled by an agent loop with caching turned off. Who came from the list, how much from the rollup, why from the trace, and what they were doing from the replay. Cost, cause, and human action, joined by one identifier, in one backend.
Verify
You've done the correlation correctly when both of these hold:
- The join is real. The Session Detail id, the trace's Session ID field, and
gen_ai.conversation_idon the model spans are the same value. If they differ, your instrumentation isn't settinggen_ai.conversation_idto your session id - fix that first, or the hops won't line up. - The diagnosis is real. The session's Cache Impact shows 0% reused and the per-call input tokens climb across the trace's
chatspans. Both together are the uncached-context-growth signature. One without the other is a different problem.
Troubleshoot
- The session view shows no linked trace. Your
gen_aispans are missingtrace_idorgen_ai.conversation_id. Set both on every model-call span. - "Play Session Replay" is greyed out, or there's no RUM session. The RUM SDK isn't initialized, or the session id isn't shared between the agent backend and the browser SDK. They must write the same id.
- The session rollup and your per-span sums disagree. The Session Detail total counts both
chatandgenerate_contentmirror spans plus tool-call tokens. For the model-call view, filter togen_ai_operation_name = 'chat'; for the user-facing total, trust the rollup. - Tokens show but cost is blank.
gen_ai.usage.costisn't populated by your instrumentation. OpenObserve will still rank by tokens; add cost when you can so governance can talk dollars. - RUM replay and trace timings don't line up. Large clock skew between the browser host and the backend (RUM replay timing is browser-clock based). Make sure NTP is healthy on both.
What governance actually gets
The point of the walk isn't a prettier dashboard - it's an accountable answer. From this one session, a governance team can act on four things:
- Enforce prompt caching on agent loops. A
0% reusedcache is the single biggest lever here; caching the repeated context would have cut most of Turn 1's input tokens. - Cap or summarize context per turn. Re-sending the whole conversation every call is the anti-pattern. Trim or summarize instead.
- Attribute spend to a person and an action, not just a model. Carrying the session id across signals turns "the model is expensive" into "this request from this user cost $5.28, and here's why."
- Alert on per-turn token and cost outliers, then correlate to the trace and RUM session. That's the difference between finding the cause in minutes and never finding it at all.
Instrument for the join once, gen_ai.conversation_id on the spans, the same session id in the RUM SDK, and every future token spike becomes a three-click investigation instead of a mystery.
For the pieces this walk builds on, see LLM cost monitoring for tracking spend at the token level, LLM observability tools for the wider landscape, and logs, metrics, and traces correlation for more on joining signals with a shared identifier.
Ready to get started?
- Try OpenObserve Cloud: 14-day free trial, LLM Sessions and RUM included
- Read the RUM SDK docs: wire up the same session id across your stack
Frequently Asked Questions
About the Author
Ashish Kolhe


Ashish leads Engineering at OpenObserve. Ashish is obsessed with building high performance systems with simplicity in mind. He has vast experience in multiple disciplines like streaming, analytics, big data and more.
Follow OpenObserve on Google
Add OpenObserve as a preferred source to see more of our articles in Google Search and Top Stories.













