Best Real User Monitoring Tools with Session Replay in 2026




Ready to get started?
Try OpenObserve Cloud today for more efficient and performant observability.
RUM tools with session replay measure what real users experience in your web app and let you watch their sessions, so you can see exactly what happened before an error or a slow page. The tools below differ most in two places: how they protect user privacy by default, and how they charge for replays.
TL;DR
The seven tools below all combine real user monitoring with session replay. They split on pricing: per session, per replay capture, per host, per GB, or by session plans.
- Best overall: OpenObserve: RUM, replay, logs, and traces in one platform.
- Best for privacy control: OpenObserve: input and full-text masking levels.
- Best for predictable pricing: OpenObserve: billed per GB, not per session.
- Best for self-hosting: OpenObserve: open source, frontend monitoring included.
- Best for EU data residency: OpenObserve: EU-Central 1 (Frankfurt) Cloud region.
- Best for full-stack debugging: OpenObserve: from replay to backend trace in one tool.
What is RUM with session replay?
Real user monitoring (RUM) is a browser SDK that records what real visitors experience: page loads, Core Web Vitals, errors, resource timing, and user actions. Session replay reconstructs each session as a video-like playback from recorded page changes, so you can watch the clicks and scrolls that led to a problem.
Together they answer two questions: how many users are affected (RUM) and what exactly happened to them (replay). For the basics, see our guide to frontend monitoring.
What to look for in a RUM and session replay tool
- Privacy masking defaults. A replay SDK records what appears on the page, which can include names, emails, addresses, and anything typed into a form. Check what the SDK masks when you install it and change nothing, because that default is what ships to production on day one. Also check whether you can mask or exclude individual elements, such as a payment form or an account details panel, without masking the whole page.
- Pricing unit. Vendors charge per session, per replay, per GB of data, per host, or by plan tiers with a session allowance. The unit decides how your bill grows: per-session and per-replay pricing rises with every visitor, while per-GB pricing rises with how much data you choose to keep. Model the bill at your current traffic and at two or three times that.
- Sampling controls. Recording every session is rarely necessary. Look for controls that let you record a percentage of sessions, or only sessions that hit an error, so you keep the replays that help you debug and drop the rest.
- Performance data. Replays show what a user did; performance data shows how the page behaved. Core Web Vitals (LCP for loading, INP for responsiveness, CLS for layout stability) and resource timing next to the replay tell you whether a user gave up because the page was slow, not just that they left.
- Error tracking. A JavaScript error is much easier to fix when you can see the stack trace and watch the session where it happened. Check that errors link directly to the replay, and that source maps are supported so stack traces point to your original code instead of minified bundles.
- Backend correlation. Many frontend errors are caused by a failing API call. If the RUM tool is separate from your backend monitoring, you see the symptom in one tool and have to search for the cause in another. A tool that links a session to the logs and traces of the services it called closes that gap.
Privacy defaults are the criterion that differs most between tools, so it helps to see what each common level actually records:
Top 7 RUM tools with session replay
1. OpenObserve
OpenObserve is an open-source (AGPL-3.0) observability platform with real user monitoring, session replay, and error tracking built in, alongside logs, metrics, and traces. Its RUM SDK captures sessions, page views, user actions, resource loads, and errors, together with Core Web Vitals (LCP, INP, CLS). From any error, you can jump straight to the session replay where it happened, and from there to the backend data for the same request, all in one tool.
Key features
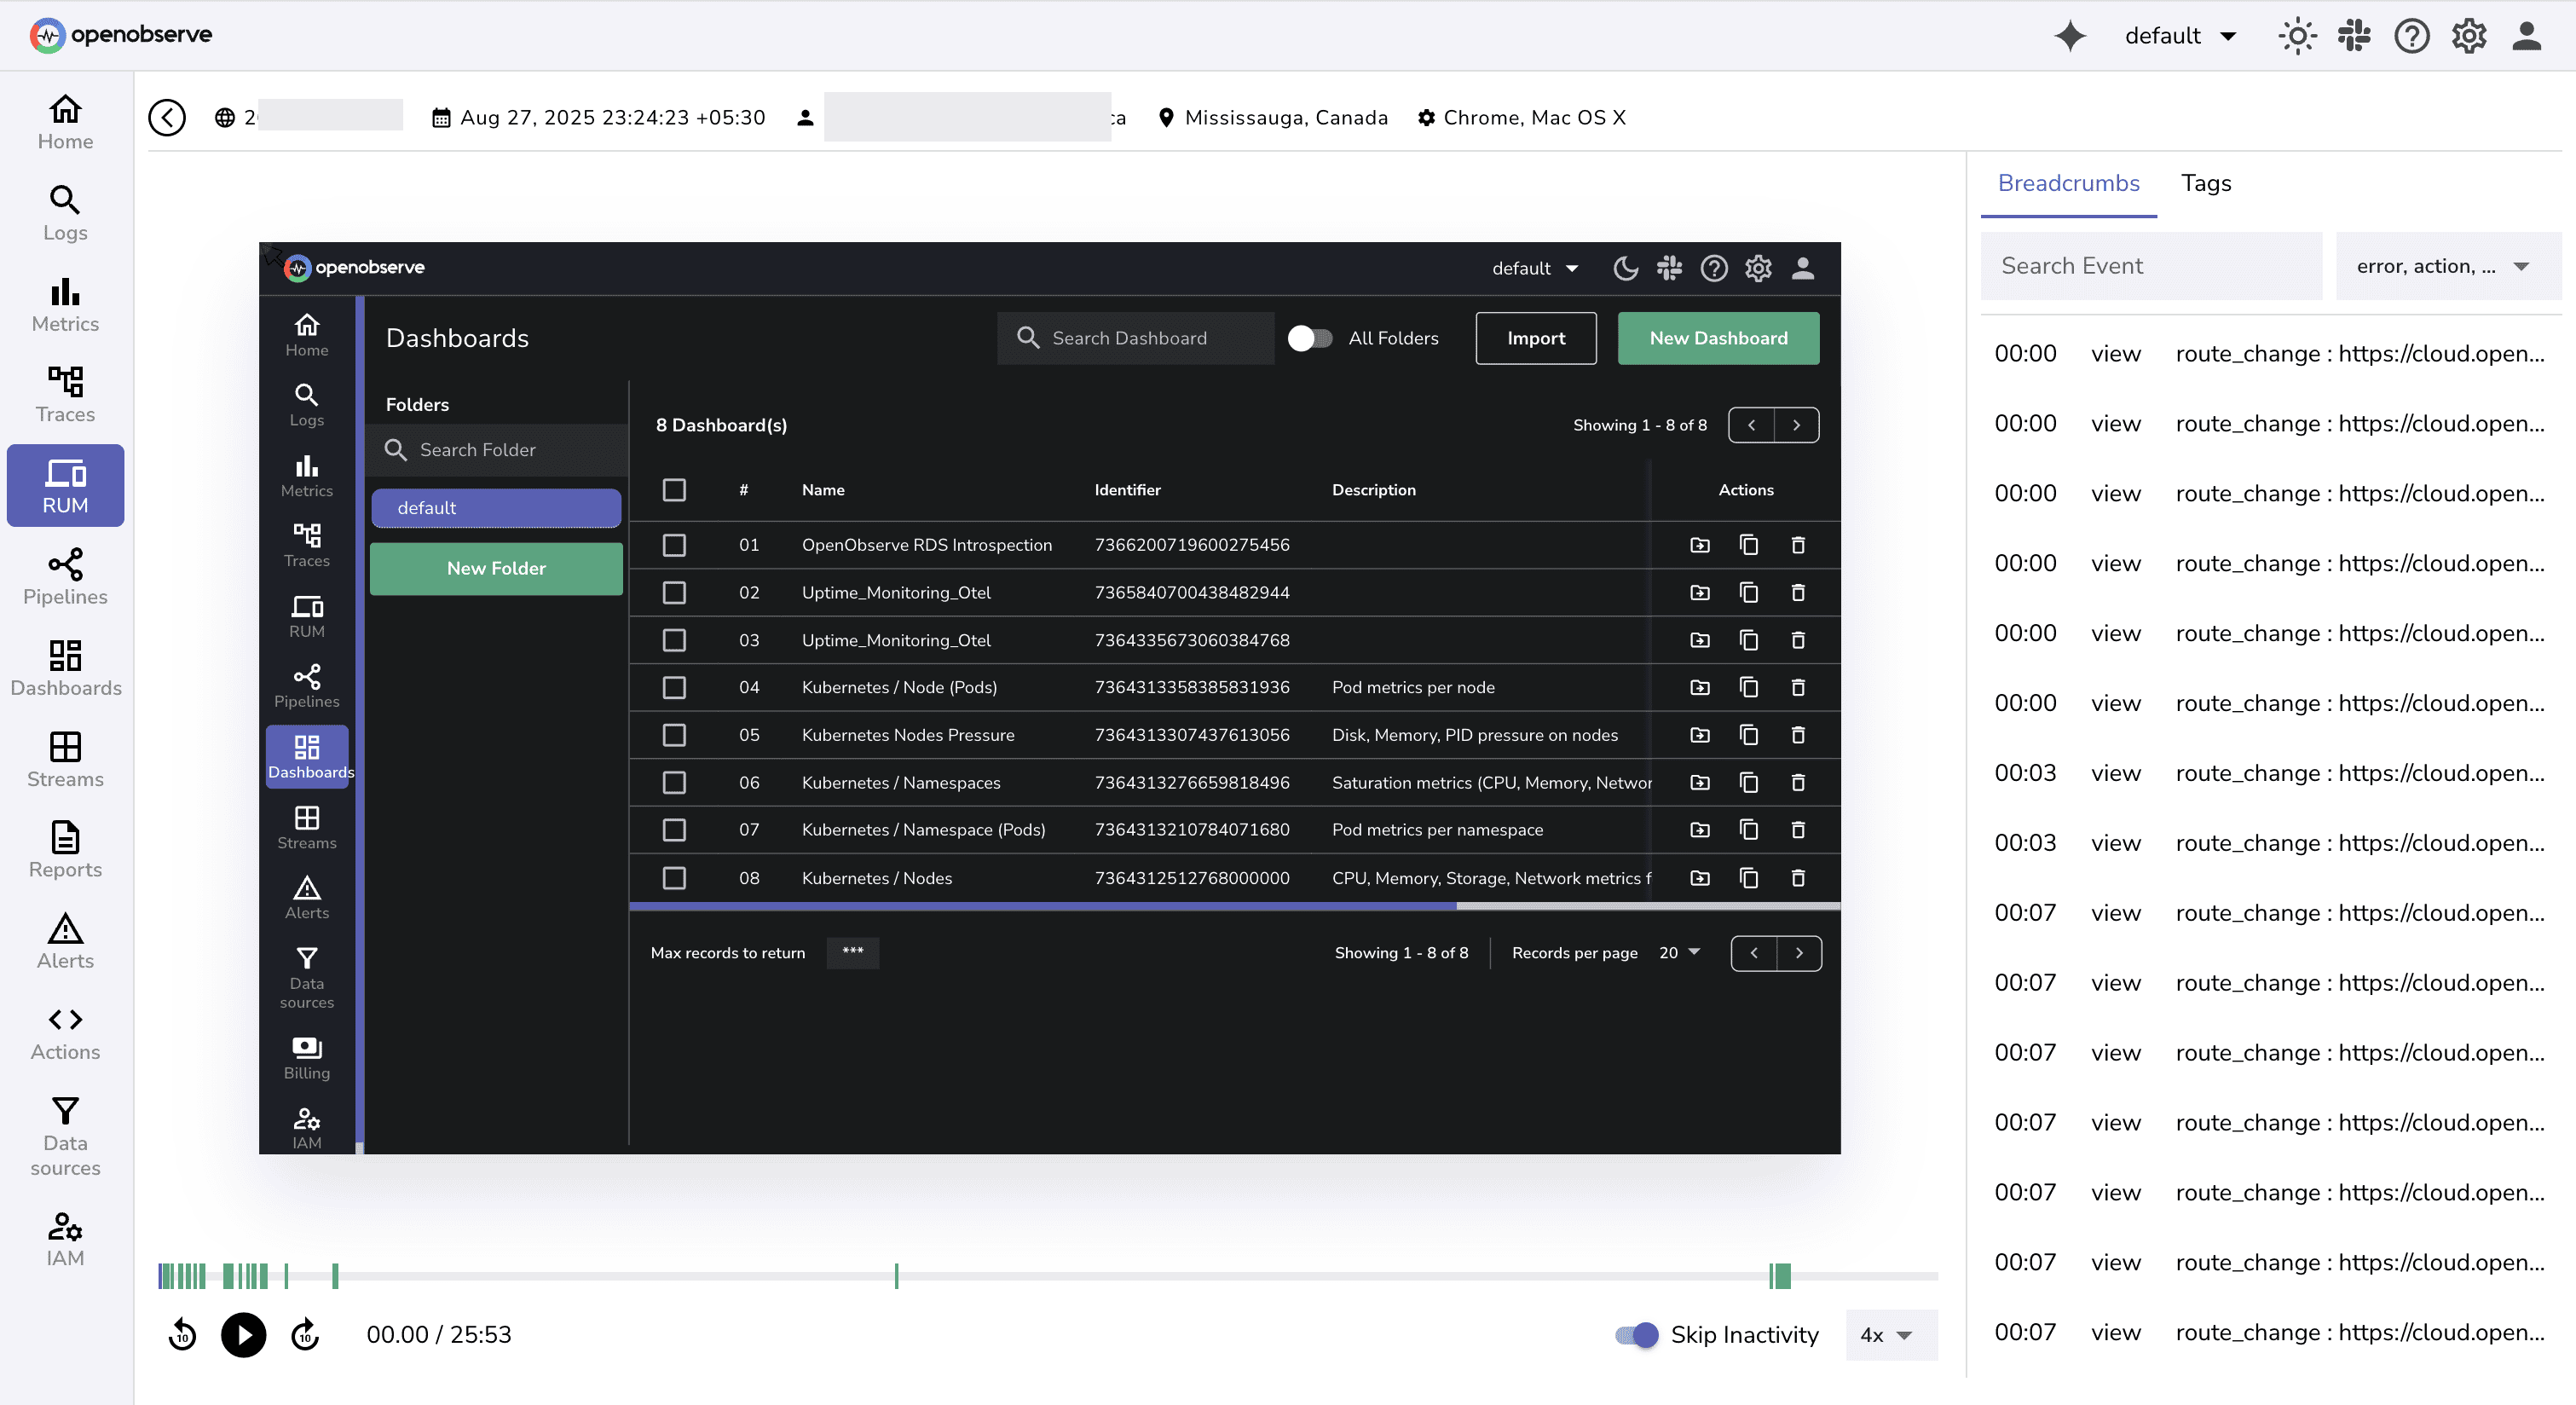
- Session replay built for debugging. Each replay comes with a breadcrumbs panel that lists the views and actions in order, and an activity timeline that shows where clicks, navigations, and errors happened. Playback can skip periods of inactivity, so you spend your time on the moments that matter instead of watching an idle tab.
- Privacy levels you choose up front. The SDK offers three levels:
allowrecords the page as it is,mask-user-input(the recommended setting) hides everything users type, andmaskhides all text on the page. Password fields are always masked, whatever level you pick. For finer control,data-o2-privacyattributes let you mask a specific element or keep it out of the recording entirely. - Error tracking linked to replays. JavaScript errors are captured with stack traces, and source map support resolves them to your original code. Every error links to the replay of the session where it occurred, so you can see what the user did right before it.
- Core Web Vitals and performance monitoring. LCP, INP, and CLS are tracked per page and per session, so you can tell whether a frustrated user was dealing with a slow page or a broken one.
- SQL across all of your data. RUM data is stored and queried like the rest of your telemetry, so you can write one SQL query that joins frontend sessions with backend logs, or build dashboards and alerts on RUM data the same way you do for everything else.
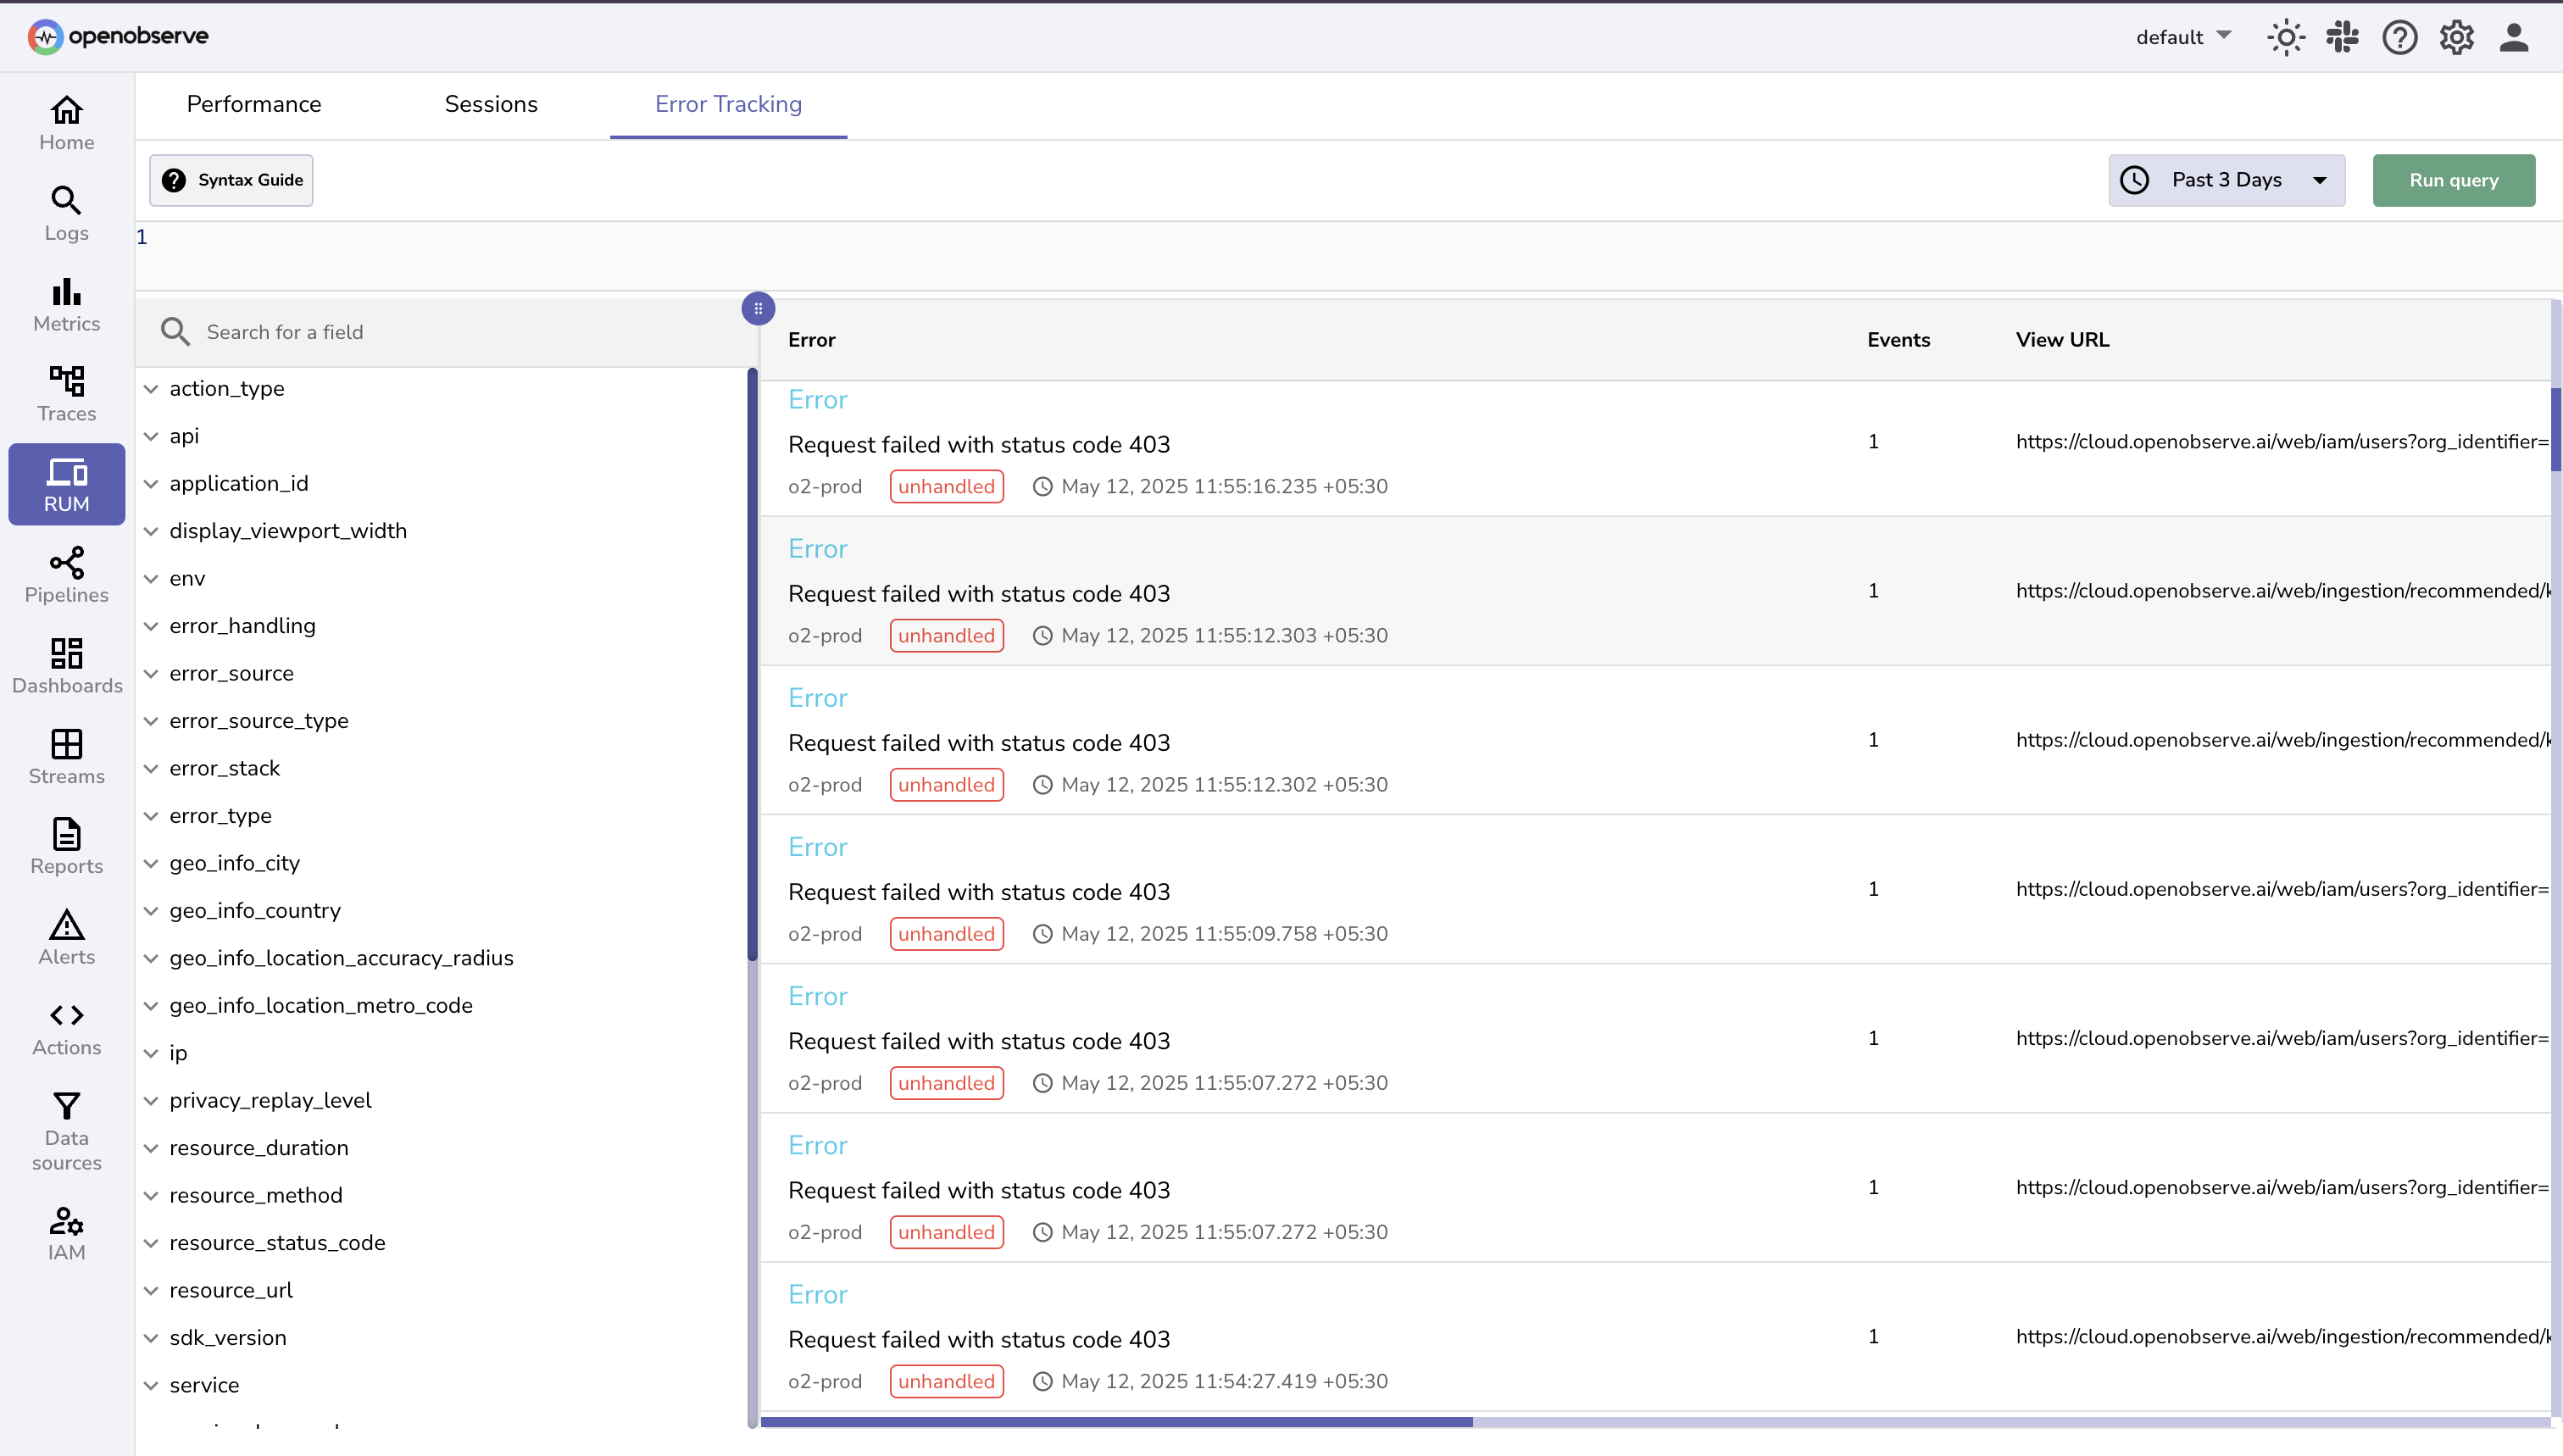
The Error Tracking view lists frontend errors with the service, whether each one was handled, and the page where it happened, and every field is available for filtering:
Pricing
There is no per-session or per-replay fee. On OpenObserve Cloud, RUM, session replay, and error tracking data are billed like all other telemetry: $0.50 per GB ingested on an annual contract ($0.70 pay as you go), plus $0.01 per GB queried, with no per-user or per-host fees. Frontend monitoring is also included in the free, self-hosted Open Source edition, so you can run it on your own infrastructure at no licence cost.
Pros
- One price for all telemetry. Replays are billed as data, like logs and traces, so they don't add a separate per-session line item to your bill. Your cost depends on how much you choose to record, not on how many people visit your site.
- Frontend and backend in one place. Replays sit next to backend logs and traces in the same tool. When a replay shows a failed checkout, you can open the trace for that API call without switching products or matching timestamps by hand.
- Flexible deployment and data residency. You can self-host OpenObserve in your own environment, or use the EU-Central 1 (Frankfurt) Cloud region to keep EU user data in the EU.
The rest of the platform
- Telemetry: logs, metrics, and traces with a service graph and service catalog, plus continuous profiles.
- Synthetic monitoring: scheduled browser and protocol checks with status pages.
- AI: AI Assistant, SRE Agent for AI root cause analysis, an MCP server, LLM observability and evaluations, anomaly detection, log patterns, and insights.
- Alerting and reliability: scheduled, real-time, composite, and anomaly alerts, incident management, and SLOs.
- Dashboards and reports, pipelines and VRL functions, and Parquet on object storage with Bring Your Own Bucket and extended retention.
- Security and compliance: SSO, RBAC, multi-tenancy, sensitive data redaction, audit trail, SOC 2 Type II, ISO 27001, and GDPR via the EU region.
- Open standards: OpenTelemetry-native, PromQL and SQL, open source under AGPL-3.0.
Best for: teams that want RUM and replay in the same platform as the rest of their observability, with pricing that doesn't scale per session. See the session replay docs and our Datadog vs OpenObserve RUM comparison.
2. Datadog RUM and Session Replay
Datadog splits browser monitoring into two RUM products, plus a separate Session Replay add-on that also works with its Product Analytics. That structure gives you control over what you pay for, but it also means a single session can be billed by more than one product.
Key features
- Two RUM tiers. RUM Measure is meant for collecting data from all of your traffic, while RUM Investigate covers a filtered subset of sessions that you keep for deeper analysis.
- Session Replay as an add-on. Replay isn't part of the base RUM products. You enable it as an add-on, and it works with both RUM and Product Analytics.
- Privacy levels with a strict default. The browser SDK supports
mask,mask-user-input, andallow. If you don't set a level, Datadog usesmask, which hides all text on the page. (Source: Datadog docs, Session Replay Browser Privacy Options, November 2026)
Pricing
RUM Measure is $0.15 per 1,000 sessions on full traffic, RUM Investigate is $3 per 1,000 filtered sessions, and the Session Replay add-on is $2.50 per 1,000 sessions, all per month billed annually. On-demand rates are $0.22, $4.50, and $3.60 respectively. (Source: Datadog pricing list, November 2026)
Pros
- Privacy-first by default. Because
maskis the default, a fresh installation doesn't expose page text in replays until you deliberately relax it. - Separate tiers for measurement and investigation. You can pay a low rate to measure all traffic and a higher rate only for the sessions you actually want to investigate.
Cons
- Replays are billed on top of RUM. A session with a replay is charged by the RUM product and again by the Session Replay add-on, so replay-heavy usage adds up quickly.
- Harder to forecast. You have three per-1,000-session prices to model, and they sit on top of Datadog's host-based pricing for infrastructure monitoring and APM.
Best for: teams already standardised on Datadog who are comfortable with per-session pricing.
3. Sentry Session Replay
Sentry started as an error monitoring tool and adds session replay on top, so replays attach to the errors Sentry already captures. If your main question is "what did the user do before this error?", it answers that directly.
Key features
- Replays linked to errors. When Sentry records an error event, the replay of that session is attached to it, so you can go from a stack trace to the user's actions in one click.
- Strict privacy defaults.
maskAllTextandblockAllMediaare bothtrueby default, which means all text is masked and images, SVGs, video, and other media are blocked from recordings. (Source: Sentry docs, Session Replay Privacy, November 2026)
Pricing
Developer is free, Team is $26 per month billed annually ($29 monthly), and Business is $80 per month billed annually ($89 monthly). Each plan includes 50 replays, and Sentry's pricing page doesn't publish a price for additional replays. (Source: Sentry pricing page, November 2026)
Pros
- Privacy is strict out of the box. With all text masked and media blocked by default, sensitive content stays out of replays unless you choose to unmask it.
- Errors and replays side by side. Developers see the stack trace and the session that triggered it in the same view, which shortens the path from report to fix.
Cons
- Small included replay volume. 50 replays per plan covers testing, not production traffic, and because overage pricing isn't published, it's hard to estimate what a realistic volume will cost without talking to sales.
Best for: developer teams whose main need is replays attached to errors.
4. Dynatrace Session Replay
Dynatrace offers real user monitoring and session replay as part of its digital experience capabilities, inside its wider enterprise observability platform.
Key features
- RUM with session replay for web applications. Session replay records user sessions alongside Dynatrace's real user monitoring data.
- Masking at two stages. Dynatrace applies masking presets separately at recording time and at playback time, including Mask all and Mask user input. Mask user input has been the default since Dynatrace version 1.262. Playback masking can't be less restrictive than recording masking, so data hidden during recording can never be revealed later. (Source: Dynatrace docs, Configure masking, November 2026)
Pricing
Real User Monitoring is $0.00225 per session, Real User Monitoring with Session Replay is $0.0045 per session replay capture, and Real User Monitoring Property is $0.0001 per property per session. (Source: Dynatrace rate card, November 2026)
Pros
- Layered masking. Separate recording and playback controls let you record a little more for some roles while still restricting what most viewers can see.
- Published list prices. Per-session and per-replay rates are on the public rate card, so you can build a first estimate without a sales call.
Cons
- More meters to track. Properties add a per-property, per-session charge on top of sessions and replays, so adding custom data to sessions raises the bill in a way that's easy to overlook.
- Text isn't masked by default. The default preset masks user input, but other page text is recorded unless you switch to a stricter preset.
Best for: enterprises already running Dynatrace across their stack.
5. Splunk RUM
Splunk Real User Monitoring is part of Splunk Observability Cloud and includes browser session replay alongside Splunk's APM and infrastructure monitoring.
Key features
- Masked by default. Browser session replay sets both
maskAllTextandmaskAllInputstotrueby default, so page text and form inputs are hidden in recordings unless you change them. - Rule-based privacy controls.
sensitivityRuleslet you mask, unmask, or exclude specific elements. An exclude rule can't be overridden by another rule, which makes it a safe way to guarantee an element is never recorded. (Source: Splunk docs, Record browser sessions and Configure the Splunk RUM browser agent, November 2026)
Pricing
Real User Monitoring is included only in the End-to-End tier of Splunk Observability Cloud, which starts at $75 per host per month billed annually. (Source: Splunk Observability Cloud pricing page, November 2026)
Pros
- Safe defaults and a hard exclude. Text and inputs are masked from the start, and exclude rules give you a guarantee that specific elements never leave the browser.
Cons
- RUM requires the top tier. You can't add RUM to a lower Observability Cloud tier; you need End-to-End, which is priced per host. For a frontend-heavy team with few backend hosts, that pricing unit doesn't line up with how much RUM data you actually collect.
Best for: organisations already on Splunk Observability Cloud End-to-End.
6. LogRocket
LogRocket is a session replay and frontend monitoring tool aimed at product and frontend teams, priced by the number of sessions you record each month.
Key features
- Replay with frontend context. Session replays come with frontend performance data and errors, so you can see what the user saw and what the browser was doing at the same time.
- Conservative privacy defaults. Inputs aren't recorded by default and password fields are never recorded. The SDK can also sanitize text, images, and network request and response data before it's sent. (Source: LogRocket docs, Privacy, November 2026)
Pricing
LogRocket is free for 1,000 sessions per month. Core starts at $83 per month for 10,000 sessions, and Pro starts at $292 per month for 10,000 sessions, rising to $717 for 100,000 and $2,258 for 1,000,000, all as monthly equivalents on an annual plan. (Source: LogRocket pricing page, November 2026)
Pros
- Inputs are excluded from the start. Because form inputs aren't recorded by default, a new installation doesn't capture what users type.
- Simple, published tiers. Plans are sized by session count, so you can pick a tier from your monthly traffic.
Cons
- Cost steps up with traffic. Each jump in session volume moves you into a higher tier, so growth in visitors translates directly into a higher bill.
- No backend data. LogRocket is a frontend tool. When a replay points to a failing API call, the backend logs and traces live in a different product.
Best for: product and frontend teams focused on user experience debugging.
7. New Relic Browser and Session Replay
New Relic includes browser monitoring in its digital experience monitoring, with session replay that maps user interactions to the rest of your New Relic telemetry.
Key features
- Replay connected to other telemetry. Session replay captures user interactions on your web app and maps other telemetry data to them, so you can see related events alongside the playback.
- Short default retention. Replay data is kept for 8 days by default in the Browser events namespace. You can keep it longer with Data Plus or by changing retention settings. (Source: New Relic docs, Session replay, November 2026)
Pricing
New Relic doesn't price session replay separately. Data ingest is free for the first 100 GB per month, then $0.40 per GB (Original Data) or $0.60 per GB (Data Plus). User pricing comes on top: Core users are $49 per user and full platform users are $99 per additional user on Standard. (Source: New Relic pricing page, November 2026)
Pros
- Replays billed as data. Replay data counts toward your ingested data rather than a per-session fee, so the cost depends on volume, not visitor count.
Cons
- Per-user fees on top of data. Every engineer who needs full platform access adds a user charge, which can outweigh the data cost as the team grows.
- Replays expire quickly. With 8 days of default retention, a replay you need for a slow-moving investigation may be gone unless you pay for longer retention.
- Masking default not documented. The session replay docs page doesn't state a default masking level, so you need to configure and verify privacy settings yourself.
Best for: teams already on New Relic's full platform.
Comparison table: RUM tools with session replay
| Area | OpenObserve | Datadog | Sentry | Dynatrace | Splunk | LogRocket | New Relic |
|---|---|---|---|---|---|---|---|
| Replay pricing unit | Per GB ingested | Per 1,000 sessions (add-on) | 50 replays included per plan | Per replay capture | Per host (End-to-End tier) | Session plans | Per GB ingested, plus users |
| Default text masking | Configurable (mask level) |
All text masked | All text masked | Not masked under default preset | All text masked | Optional | Not stated in sources |
| Default input masking | Recommended mask-user-input; passwords always masked |
Yes (under mask) |
Not stated in sources | Yes | Yes | Yes; passwords never recorded | Not stated in sources |
| Element-level privacy controls | Yes (data-o2-privacy) |
Not stated in sources | Not stated in sources | Allow and block lists | Mask, unmask, exclude rules | Yes (data-private) |
Not stated in sources |
(Sources: each vendor's pricing page and docs, November 2026, as cited above)
How to choose the right RUM and session replay tool
| If you need... | Choose |
|---|---|
| RUM and replay without per-session pricing | OpenObserve, billed per GB ingested |
| Replays next to backend logs and traces | OpenObserve, one platform with SQL across all signals |
| Strict privacy controls | OpenObserve, with mask or mask-user-input and element-level data-o2-privacy attributes |
| EU data residency | OpenObserve Cloud in EU-Central 1 (Frankfurt), or self-hosted in your own region |
| A tool you can self-host | OpenObserve, open source with frontend monitoring included |
| A lower bill than per-session replay pricing at high traffic | OpenObserve, where replay cost scales with data volume |
To control replay volume in any tool, record replays only for the sessions you need. Our guide to recording session replay only for sessions with errors shows the configuration that gets you closest.
Get started with OpenObserve RUM
- Sign up for OpenObserve Cloud with a 14-day free trial and add the RUM SDK to your app.
- Follow the RUM overview to set privacy levels and sampling.
- Related reading: RUM frustration signals.
Frequently Asked Questions
About the Author
Simran Kumari

Passionate about observability, AI systems, and cloud-native tools. All in on DevOps and improving the developer experience.
Follow OpenObserve on Google
Add OpenObserve as a preferred source to see more of our articles in Google Search and Top Stories.