Common Nginx Errors and How to Fix Them




Ready to get started?
Try OpenObserve Cloud today for more efficient and performant observability.
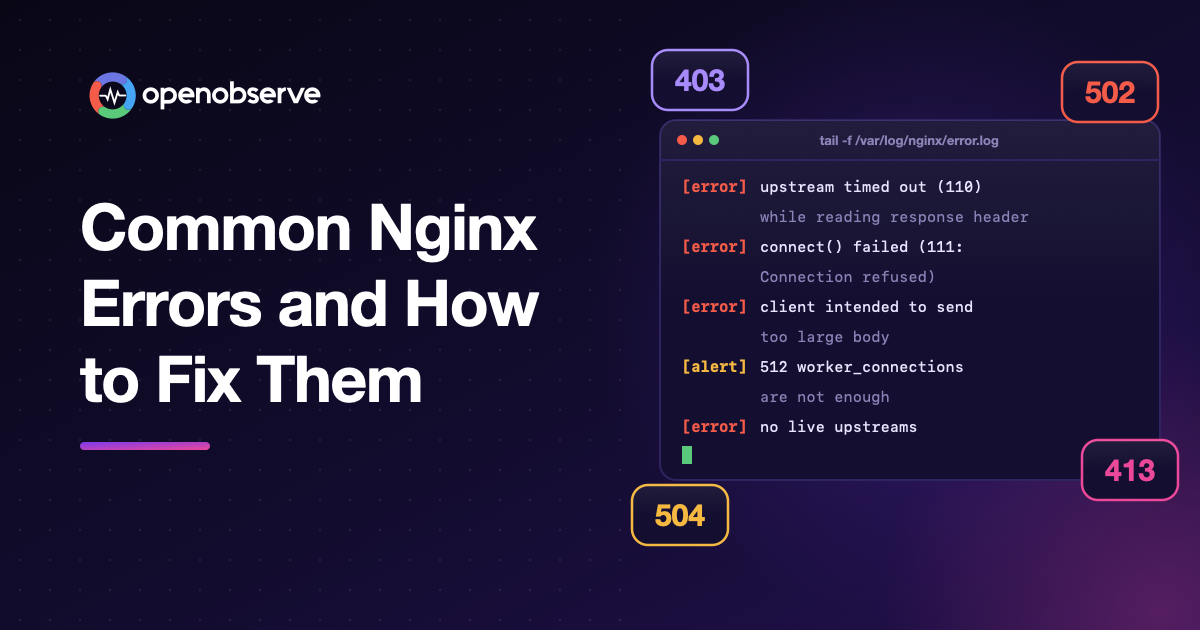
Common Nginx errors usually come from one of four places: an upstream that's down or slow (502, 504), a request larger than Nginx allows (413, 414, 400), a response header larger than Nginx's proxy buffers, or connection and file limits on the Nginx server itself. The error log tells you which, and the fix is usually one directive.
TL;DR
- 502 Bad Gateway means Nginx couldn't get a valid response from the upstream: the upstream is down, refusing connections, or sending response headers too big for
proxy_buffer_size. See 502 Bad Gateway. - 504 Gateway Timeout means the upstream took longer to respond than
proxy_read_timeoutallows, which defaults to 60s. See 504 Gateway Timeout. - 413 Request Entity Too Large means the request body is bigger than
client_max_body_size, which defaults to 1m. See 413 Request Entity Too Large. - The best way to catch these errors before users report them is OpenObserve. Ship your Nginx access and error logs to it with Fluent Bit (Nginx integration guide), search every 5xx by upstream with SQL, and set alerts on the 5xx rate and on messages like
upstream timed out. See how to catch Nginx errors before users report them.
Start with the Nginx error log
Every fix starts in the error log. The error_log directive sets the file and level; by default Nginx writes to logs/error.log at the error level, and the level can be debug, info, notice, warn, error, crit, alert, or emerg. (Source: Nginx docs, Core functionality, November 2026) Many Linux packages set it to /var/log/nginx/error.log.
tail -f /var/log/nginx/error.log
The access log shows the status code users got; the error log shows why.
502 Bad Gateway
What it means: Nginx proxied the request but didn't get a valid response from the upstream.
Typical error log lines:
connect() failed (111: Connection refused) while connecting to upstream
upstream prematurely closed connection while reading response header from upstream
How to fix it:
- Check the upstream is running and listening on the address and port in
proxy_passor theupstreamblock. - Check the network path from Nginx to the upstream, including firewalls and container networking.
- Check the upstream's own logs for crashes or restarts at the same time.
- Check connection timing.
proxy_connect_timeoutdefaults to 60s and sets how long Nginx waits to establish a connection with the upstream. (Source: Nginx docs, ngx_http_proxy_module, November 2026)
502 from oversized upstream headers
What it means: the upstream responded, but its response header didn't fit in Nginx's buffer, which often happens with large cookies or authentication headers.
Typical error log line:
upstream sent too big header while reading response header from upstream
How to fix it: raise the buffers for that location. proxy_buffer_size sets the buffer for the first part of the upstream response and defaults to 4k|8k; proxy_buffers defaults to 8 4k|8k, and proxy_busy_buffers_size to 8k|16k.
location /app/ {
    proxy_pass http://app_backend;
    proxy_buffer_size 16k;
    proxy_buffers 8 16k;
    proxy_busy_buffers_size 32k;
}
Better still, find out why the header is so large and shrink it at the source.
504 Gateway Timeout
What it means: the upstream accepted the request but didn't respond in time.
Typical error log line:
upstream timed out (110: Connection timed out) while reading response header from upstream
How to fix it: proxy_read_timeout defines how long Nginx waits to read a response from the upstream and defaults to 60s; proxy_send_timeout, for sending the request, also defaults to 60s. (Source: Nginx docs, ngx_http_proxy_module, November 2026)
- Find out why the upstream is slow first: a slow database query, a downstream dependency, or resource exhaustion. Traces show which span took the time.
- Raise the timeout only for legitimately slow endpoints, such as exports or reports:
location /reports/ {
    proxy_pass http://app_backend;
    proxy_read_timeout 300s;
}
Raising timeouts globally hides problems and ties up connections.
413 Request Entity Too Large
What it means: the request body is bigger than Nginx allows. client_max_body_size defaults to 1m; when a request body exceeds it, Nginx returns 413, and the Nginx docs note that "browsers cannot correctly display this error". Setting it to 0 disables the check. (Source: Nginx docs, ngx_http_core_module, November 2026)
How to fix it: raise it where uploads happen, not globally:
location /upload/ {
    client_max_body_size 50m;
    proxy_pass http://app_backend;
}
414 Request-URI Too Large and 400 Bad Request (header too large)
What it means: a request line or header field didn't fit in Nginx's header buffers. client_header_buffer_size defaults to 1k; larger requests use large_client_header_buffers, which defaults to 4 8k. A request line longer than one buffer returns 414 (Request-URI Too Large), and a header field longer than one buffer returns 400 (Bad Request). (Source: Nginx docs, ngx_http_core_module, November 2026)
How to fix it:
server {
    large_client_header_buffers 4 16k;
}
Long query strings and oversized cookies are the usual causes; fixing them in the application is the lasting fix.
worker_connections are not enough
What it means: a worker process hit its connection limit. worker_connections defaults to 512 and counts all connections, including connections to proxied servers, not just clients. The actual limit also can't exceed the maximum number of open files, which worker_rlimit_nofile can raise. (Source: Nginx docs, Core functionality, November 2026)
Typical error log line:
512 worker_connections are not enough
How to fix it:
worker_rlimit_nofile 65535;

events {
    worker_connections 4096;
}
Make sure the operating system's open-file limit for the Nginx user is at least as high.
403 Forbidden and 404 Not Found
403 Forbidden usually means Nginx can't read the file or directory, or a request hit a directory with no index file and directory listing is off. Check file ownership and permissions for the Nginx user, the index directive, and any deny rules.
404 Not Found for files you know exist usually means the root or alias path doesn't match where the files are. The error log shows the full path Nginx tried:
open() "/usr/share/nginx/html/app/index.html" failed (2: No such file or directory)
no live upstreams
What it means: every server in an upstream group was marked unavailable after failures, so Nginx had nowhere to send the request. proxy_next_upstream decides when a request moves to the next server and defaults to error timeout. (Source: Nginx docs, ngx_http_proxy_module, November 2026)
How to fix it: treat it as an upstream outage first: check each server's health and logs. Then review whether proxy_next_upstream and the server failure settings in your upstream block match how your application fails.
How to catch Nginx errors before users report them
Fixing errors one by one in a terminal doesn't scale beyond a few servers. Centralise the logs and alert on them:
- Ship access and error logs from every Nginx server to OpenObserve with Fluent Bit, Vector, or the OpenTelemetry Collector. See our guides to monitoring Nginx with Fluent Bit and Nginx log management.
- Parse the fields you'll filter by: status code, upstream address, upstream response time, and request time. VRL functions in OpenObserve can parse Nginx log lines at ingestion.
- Search with SQL, for example every 502 and 504 in the last hour by upstream:
SELECT upstream_addr, status, COUNT(*) AS errors
FROM "nginx_access"
WHERE status IN (502, 504)
GROUP BY upstream_addr, status
ORDER BY errors DESC
- Alert on the 5xx rate per server and on error log messages such as
upstream timed outandworker_connections are not enough. - Follow the request into the upstream with traces, so a 504 leads straight to the slow span.
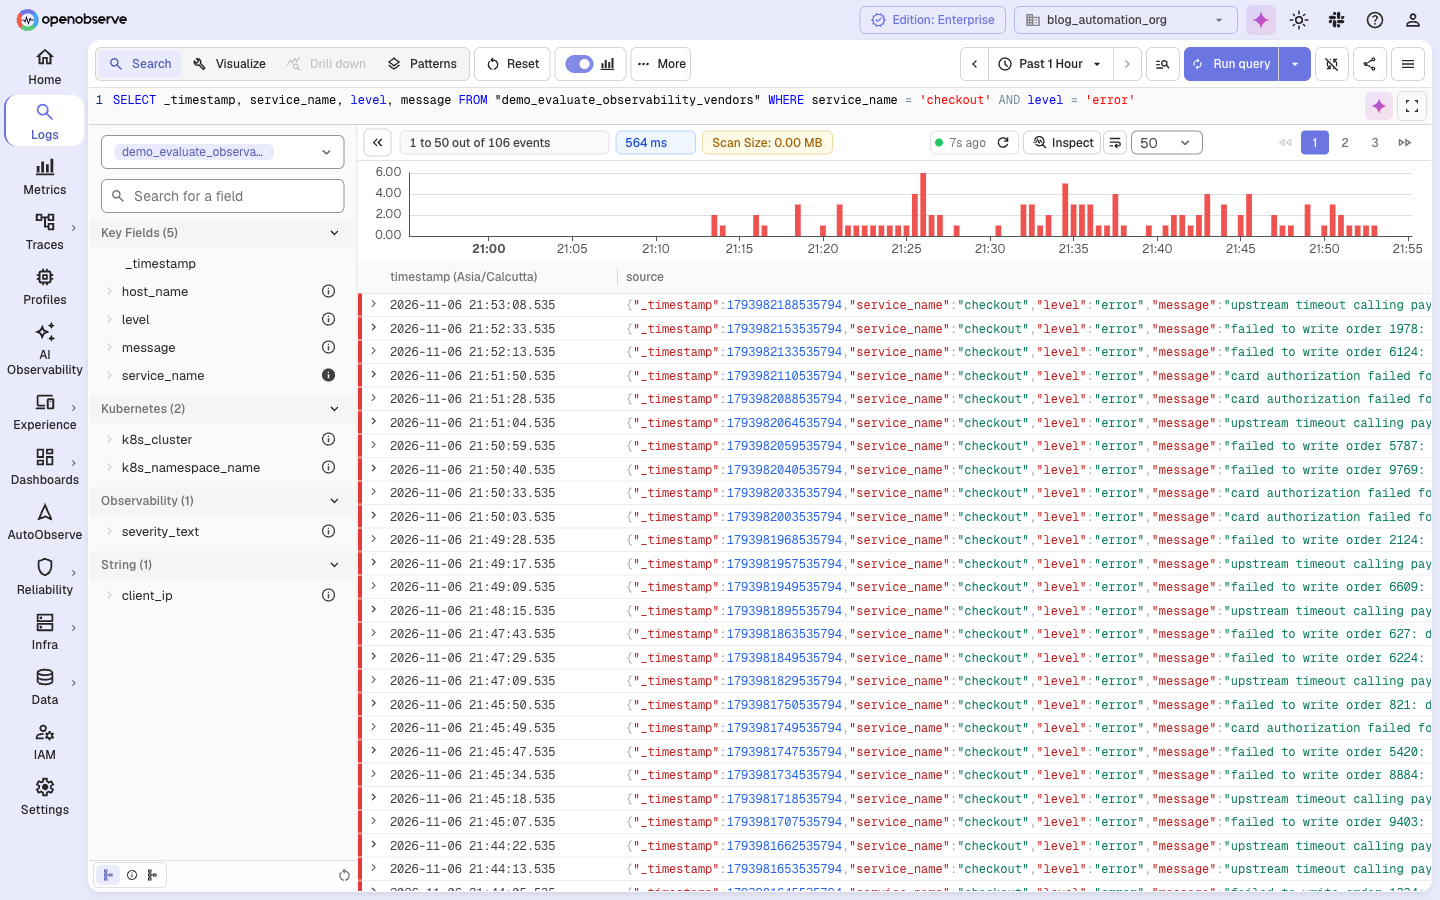
OpenObserve is an open-source (AGPL-3.0) observability platform, so Nginx logs sit next to the metrics and traces of the services behind them:
- Telemetry: logs, metrics, and traces with a service graph and service catalog, plus continuous profiles.
- Frontend monitoring: real user monitoring (RUM), session replay, and error tracking.
- Synthetic monitoring: scheduled browser and protocol checks.
- AI: AI Assistant, SRE Agent for AI root cause analysis, an MCP server, LLM observability and evaluations, anomaly detection, log patterns, and insights.
- Alerting and reliability: scheduled, real-time, composite, and anomaly alerts, incident management, and SLOs with error budgets and burn rates.
- Dashboards and reports: real-time dashboards and scheduled PDF, PNG, or CSV reports.
- Data processing: pipelines, VRL functions, enrichment tables, and metrics downsampling.
- Storage and cost: Parquet on object storage, Bring Your Own Bucket on Cloud, extended retention, and ingest-based pricing with unlimited users.
- Security and governance: SSO, RBAC, multi-tenancy, sensitive data redaction, audit trail, cipher keys, and federated search.
- Compliance: SOC 2 Type II, ISO 27001, and GDPR via the EU-Central 1 (Frankfurt) region.
- Open standards: OpenTelemetry-native ingestion, PromQL and SQL querying, and open source under AGPL-3.0.
Get started with OpenObserve
- Sign up for OpenObserve Cloud with a 14-day free trial and send your Nginx logs.
- Follow the Fluent Bit ingestion docs to ship them.
Frequently Asked Questions
About the Author
Simran Kumari

Passionate about observability, AI systems, and cloud-native tools. All in on DevOps and improving the developer experience.
Follow OpenObserve on Google
Add OpenObserve as a preferred source to see more of our articles in Google Search and Top Stories.