How DevZero Migrated from Datadog in Under an Hour and Cut Observability Costs by 4x with OpenObserve
Updated April 24, 2026
7 min read
Don’t forget to share!
Getting Started with OpenObserve
Try OpenObserve Cloud today for more efficient and performant observability.
DevZero is a workload automation platform that helps engineering teams improve the efficiency of their Kubernetes and inference infrastructure. For Kubernetes, DevZero rightsizes workloads and the nodes they run on. For inference, it introduces semantic caching and enables platform teams to back-test and run evaluations to ensure applications are always using the most appropriate and cost-efficient models.
DevZero's customers rely on the platform to reduce spend across GKE, EKS, Bedrock, and third-party inference providers by at least 30%. Operating a globally distributed system means DevZero itself generates significant telemetry, ingesting infrastructure data from customer environments around the world, writing to databases at high throughput, and tracking cost patterns across every major cloud region.
Debo, DevZero's CEO, spent six and a half years at Uber working on compute infrastructure and security before founding the company. At Uber, he contributed to Jaeger, one of the first open-source distributed tracing systems. He knows what production-scale observability looks like - which made the friction of their Datadog setup all the more frustrating.
DevZero's observability journey followed an all-to-familiar arc. In the early days, it was logs printing to standard out, watching the system behave. As the customer base grew, metrics started to matter. Then, as the platform scaled into a truly distributed system, traces became critical for understanding where performance bottlenecks were hiding, particularly across database reads and writes, where any slowdown showed up immediately in dashboard load times.
"No one likes a slow dashboard," Debo explains. "The dashboard has to be snappy and fast at all times." Datadog was the natural starting point. It was the most prominent tool in the space, had deep integrations with the Kubernetes ecosystem, and offered startup credits through the VC network that made early adoption easy. But over time, cracks started to appear, not in the product, but in the economics.
The core problem was bill unpredictability. As the engineering team grew and more AI-generated code entered the codebase, log verbosity became harder to control. New RPCs, batch jobs, and service additions didn't always come with disciplined log-level hygiene. The result was a monthly invoice that fluctuated by 15 to 20%, month after month, with no easy way to predict or contain it.
"You have a surprise that happens at the end of the month when you get that invoice. That didn't feel very nice," Debo says. "You go and change it, you do that a couple more times, and you just notice this pattern isn't very sustainable."
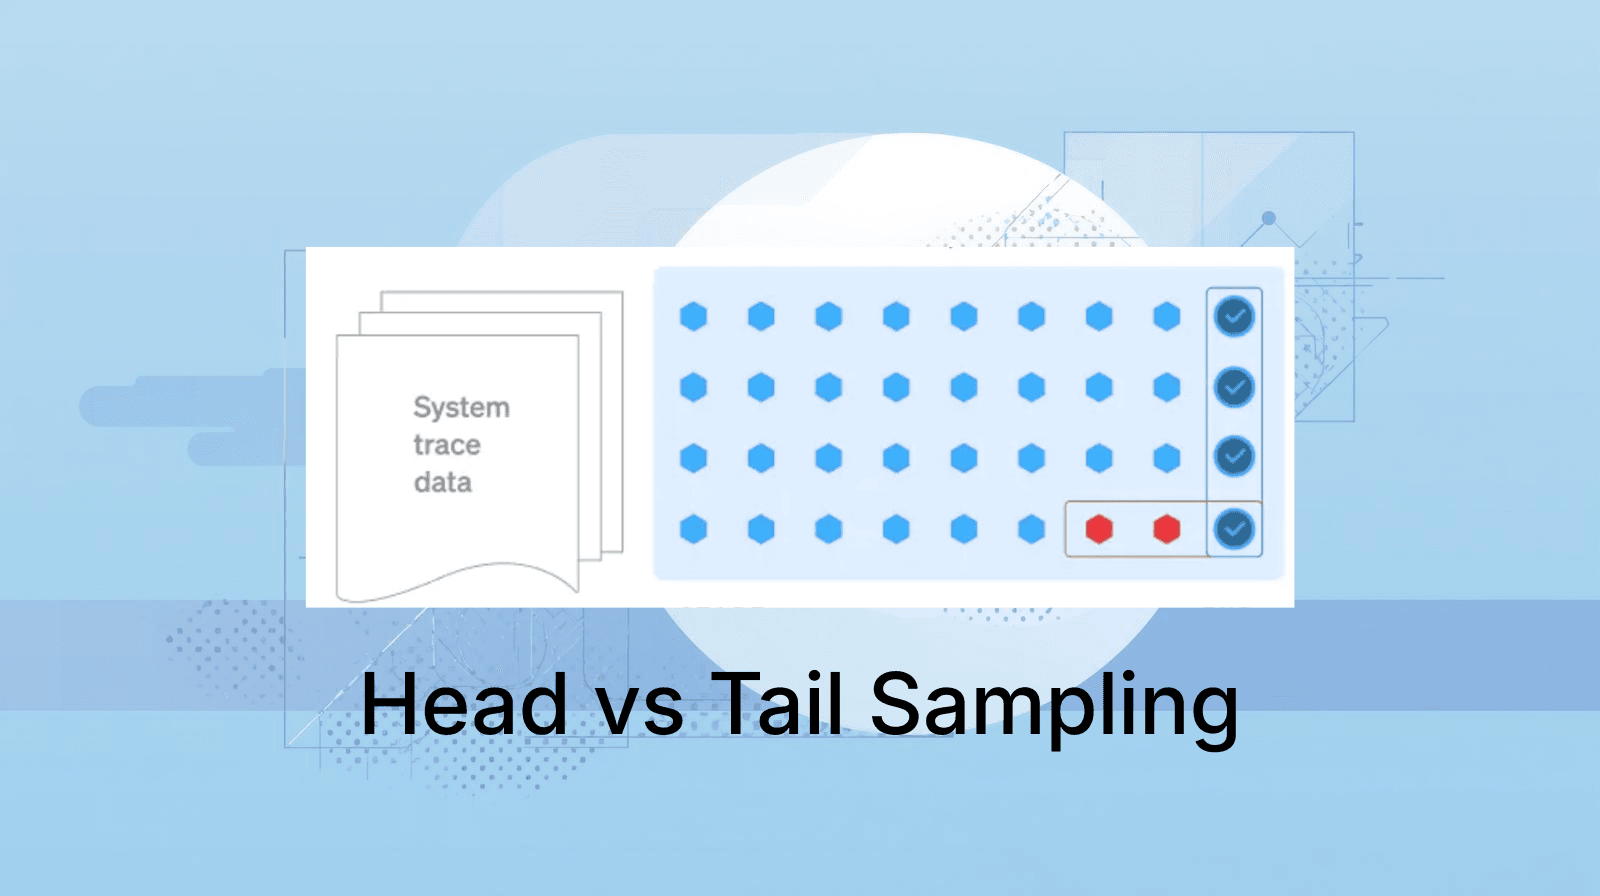
On the tracing side, the pressure was even more acute. DevZero needed high-fidelity traces to optimize database interactions and maintain sub-second page loads for their customers. Aggressive sampling was off the table - losing context during an incident wasn't acceptable. But retaining that level of tracing detail came at a cost that continued to compound.
The tipping point wasn't a single line item. It was the aggregate and the realization that the team was spending meaningful engineering time managing observability rather than improving the product. "Observability is a tool for us to serve a better platform for our customers," Debo reflects. "I don't want to spend too much time on that when there's so much else to focus on."
When DevZero began evaluating alternatives, two things mattered most: a pricing model that wouldn't surprise them, and a platform that could handle distributed tracing at the depth their system required. They had already made a strategic decision roughly a year before the migration to standardize on OpenTelemetry, both for flexibility and to avoid being locked into any single vendor's instrumentation model. That decision paid off during evaluation. OpenObserve's native OpenTelemetry support meant DevZero's existing instrumentation carried over without modification.
The evaluation process was straightforward. OpenObserve's open-source foundation meant they could stand up an instance quickly, route real data, and validate behavior before making any commitment. "Once you have enough of an understanding of how the system works, your risk profile ends up changing," Debo notes. "You see how a collector works, everyone runs one, you go and scrape, you introduce the risk. It's pretty low."
The SQL-based query interface was another factor that led to DevZero’s ease-of-adoption. While learning any new system takes time, SQL is a language engineers already know. Combined with OpenObserve's AI assistant, which understands the full schema of the platform and can generate queries from natural language, the productivity ramp was shorter than expected.
The underlying performance, driven by OpenObserve's Rust-based architecture, also showed up immediately in day-to-day use. For a team that had built their entire product philosophy around snappy, responsive interfaces, a fast observability platform wasn't a nice-to-have, it was a requirement.
The actual migration was disarmingly simple.
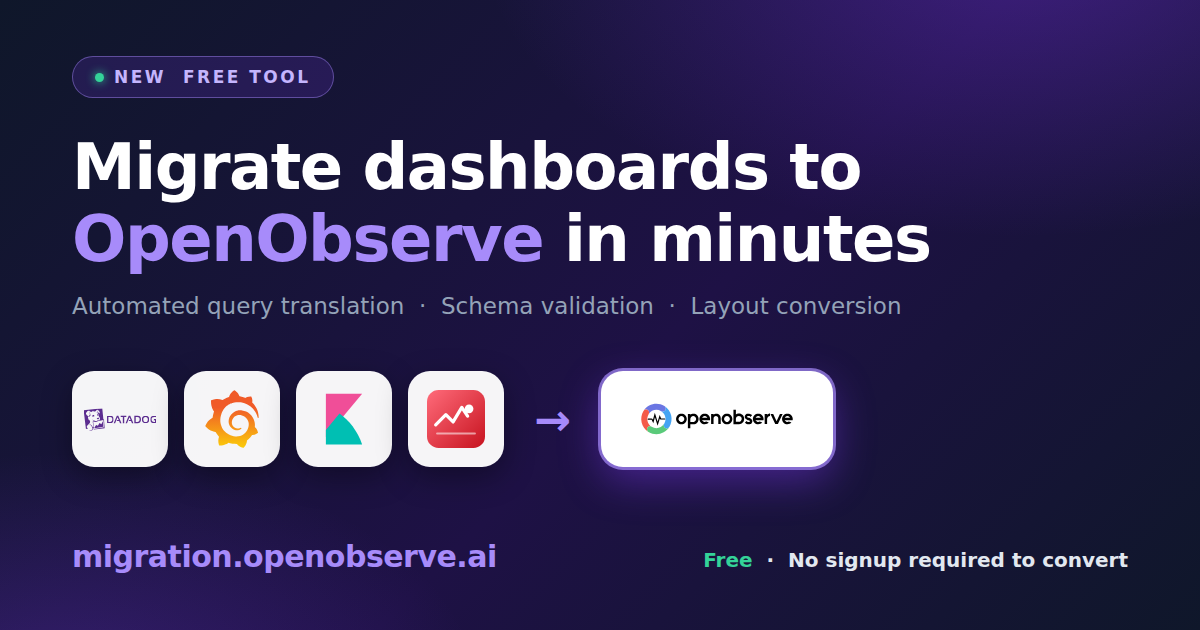
Working with the OpenObserve solutions team, DevZero first exported their existing Datadog dashboards as JSON. OpenObserve's migration tooling handled the import, mapping stream names and resolving schema differences automatically. A small number of proprietary Datadog functions required manual translation to SQL equivalents - a quick session with the OpenObserve team resolved those in under an hour. "There were a couple of cases where we were using proprietary Datadog stuff, and we figured out the right transition plan," Debo recalls. "We sat down, got it fixed up."
For infrastructure data, they deployed OpenObserve's Helm chart into their Kubernetes environment. Within minutes, data was flowing. Critically, DevZero ran both platforms in parallel during the transition - Datadog continued receiving data while OpenObserve was validated - eliminating any risk to production visibility. The parallel run started in pre-production, then extended to production once the team was satisfied. "We installed the Helm chart and everything started working immediately," Debo says. "There wasn't this big, scary migration event."
The headline number is a 4x reduction in observability spend. But Debo is quick to point out that cost alone isn't the full story, the nature of the cost matters just as much as the amount. "Money is fine. One thing we don't like is surprises. We like predictability."
OpenObserve's volume-based pricing model with no separate line items for hosts, containers, custom metrics, or re-indexing - gave DevZero exactly that. The bill reflects what they ingest. Nothing more. On the product side, trace performance has been exactly what the team needed. High-fidelity tracing across database interactions - without aggressive sampling - has made it significantly easier to identify and resolve performance bottlenecks before they reach end users.
Team adoption took roughly two weeks to fully settle. The change management challenge, Debo notes, had less to do with the software than with habits - bookmarks, PagerDuty rules, the reflexive instinct to open a familiar screen during an incident. Those adjusted naturally over time.
What stood out was something less commonly discussed in vendor evaluations: the quality of human support. For a startup running lean, the ability to jump on a Slack message or a Zoom call within minutes - not business days - matters.
"When you work with an early-stage company, the level of attention you get is very different," Debo says. "The person who actually builds the system shows up to the call. That's not something you get from a 15-year-old platform."
DevZero continues to scale its customer base, which means observability data volumes will only grow. With OpenObserve, that growth now comes with a cost model that scales predictably, and a platform built for the telemetry realities of distributed, AI-native infrastructure.
For teams considering a similar move, Debo's advice is direct: stop overthinking the planning phase. "Six years ago, I would have said you need to plan for a quarter. That's nonsense now. Stand it up, run it in parallel, see for yourself."
Ready to see what your observability costs look like with OpenObserve? Upload your current invoice to our Datadog Bill Analyzer or start a free trial and have data flowing in minutes.