What's New in OpenObserve: Terraform Support, Bring Your Own Bucket, and UX Updates

Simran Kumari
May 18, 2026
5 min read
Don’t forget to share!
What Nobody Tells You About Running AI in Production
Try OpenObserve Cloud today for more efficient and performant observability.
We've been shipping. Here's a look at what's live - Terraform support for infrastructure-as-code deployments, Bring Your Own Bucket for full control over your data storage and a round of UX and UI improvements.
Managing your observability infrastructure manually doesn't scale and now you don't have to. OpenObserve ships two Terraform modules that together cover both the deployment of OpenObserve itself and the ongoing management of resources inside it.
terraform-provider-openobserve available on the Terraform Registry — lets you manage OpenObserve resources as code: streams, dashboards, users, and organizations. Define a stream with its retention policy, full-text search keys, and index fields in a .tf file, and it goes through the same plan/apply/review cycle as any other piece of your infrastructure.
provider "openobserve" {
  endpoint = "https://openobserve.example.com"
  username = "admin@example.com"
  password = var.oo_password
  org_id   = "default"
}

resource "openobserve_stream" "app_logs" {
  org_id      = "default"
  name        = "app-logs"
  stream_type = "logs"

  settings {
    data_retention        = 30
    full_text_search_keys = ["message"]
    index_fields          = ["level", "service"]
  }
}
terraform-kubernetes-openobserve — published at registry.terraform.io/modules/openobserve/openobserve/kubernetes — handles deploying OpenObserve on Kubernetes via the official Helm chart. It covers both ends of the spectrum: a minimal single-node SQLite setup you can run locally in minutes, and a full production HA configuration with PostgreSQL, NATS, S3, Ingress, and per-component replica counts and resource limits. Set create_aws_infrastructure = true and the module will also provision the VPC, EKS cluster, S3 bucket, and IAM roles from scratch. OpenTofu is supported alongside Terraform.
The two modules are complementary — use the Kubernetes module to stand up and manage the platform, and the provider to manage what runs inside it. Both are Apache 2.0 licensed.
Read more about the setup details here
OpenObserve is built around object storage. Bring Your Own Bucket (BYOB) now lets you decide exactly where that data lives.
Instead of using OpenObserve-managed storage, you can connect your own S3 bucket, or Azure Blob container directly. Your data stays in your account, in your region, under your own security policies and access controls, OpenObserve handles ingestion, compaction, and queries against it.
The use cases this unlocks:
Setup is straightforward from the OpenObserve Cloud settings: provide your bucket details and access credentials, and you're done.
The customer's storage bucket must reside in the same region and use the same cloud provider as the OpenObserve cloud it's connected to.
For example:
us-west-1 can only use an AWS S3 bucket in us-west-1. East US 2 can only use an Azure Blob Storage container in East US 2.Cross-region and cross-provider configurations are not supported.
BYOB is available for commercial OpenObserve Cloud customers.
If you're interested in enabling this capability for your organization, please contact us through OpenObserve Contact Us.
Read more in detail here
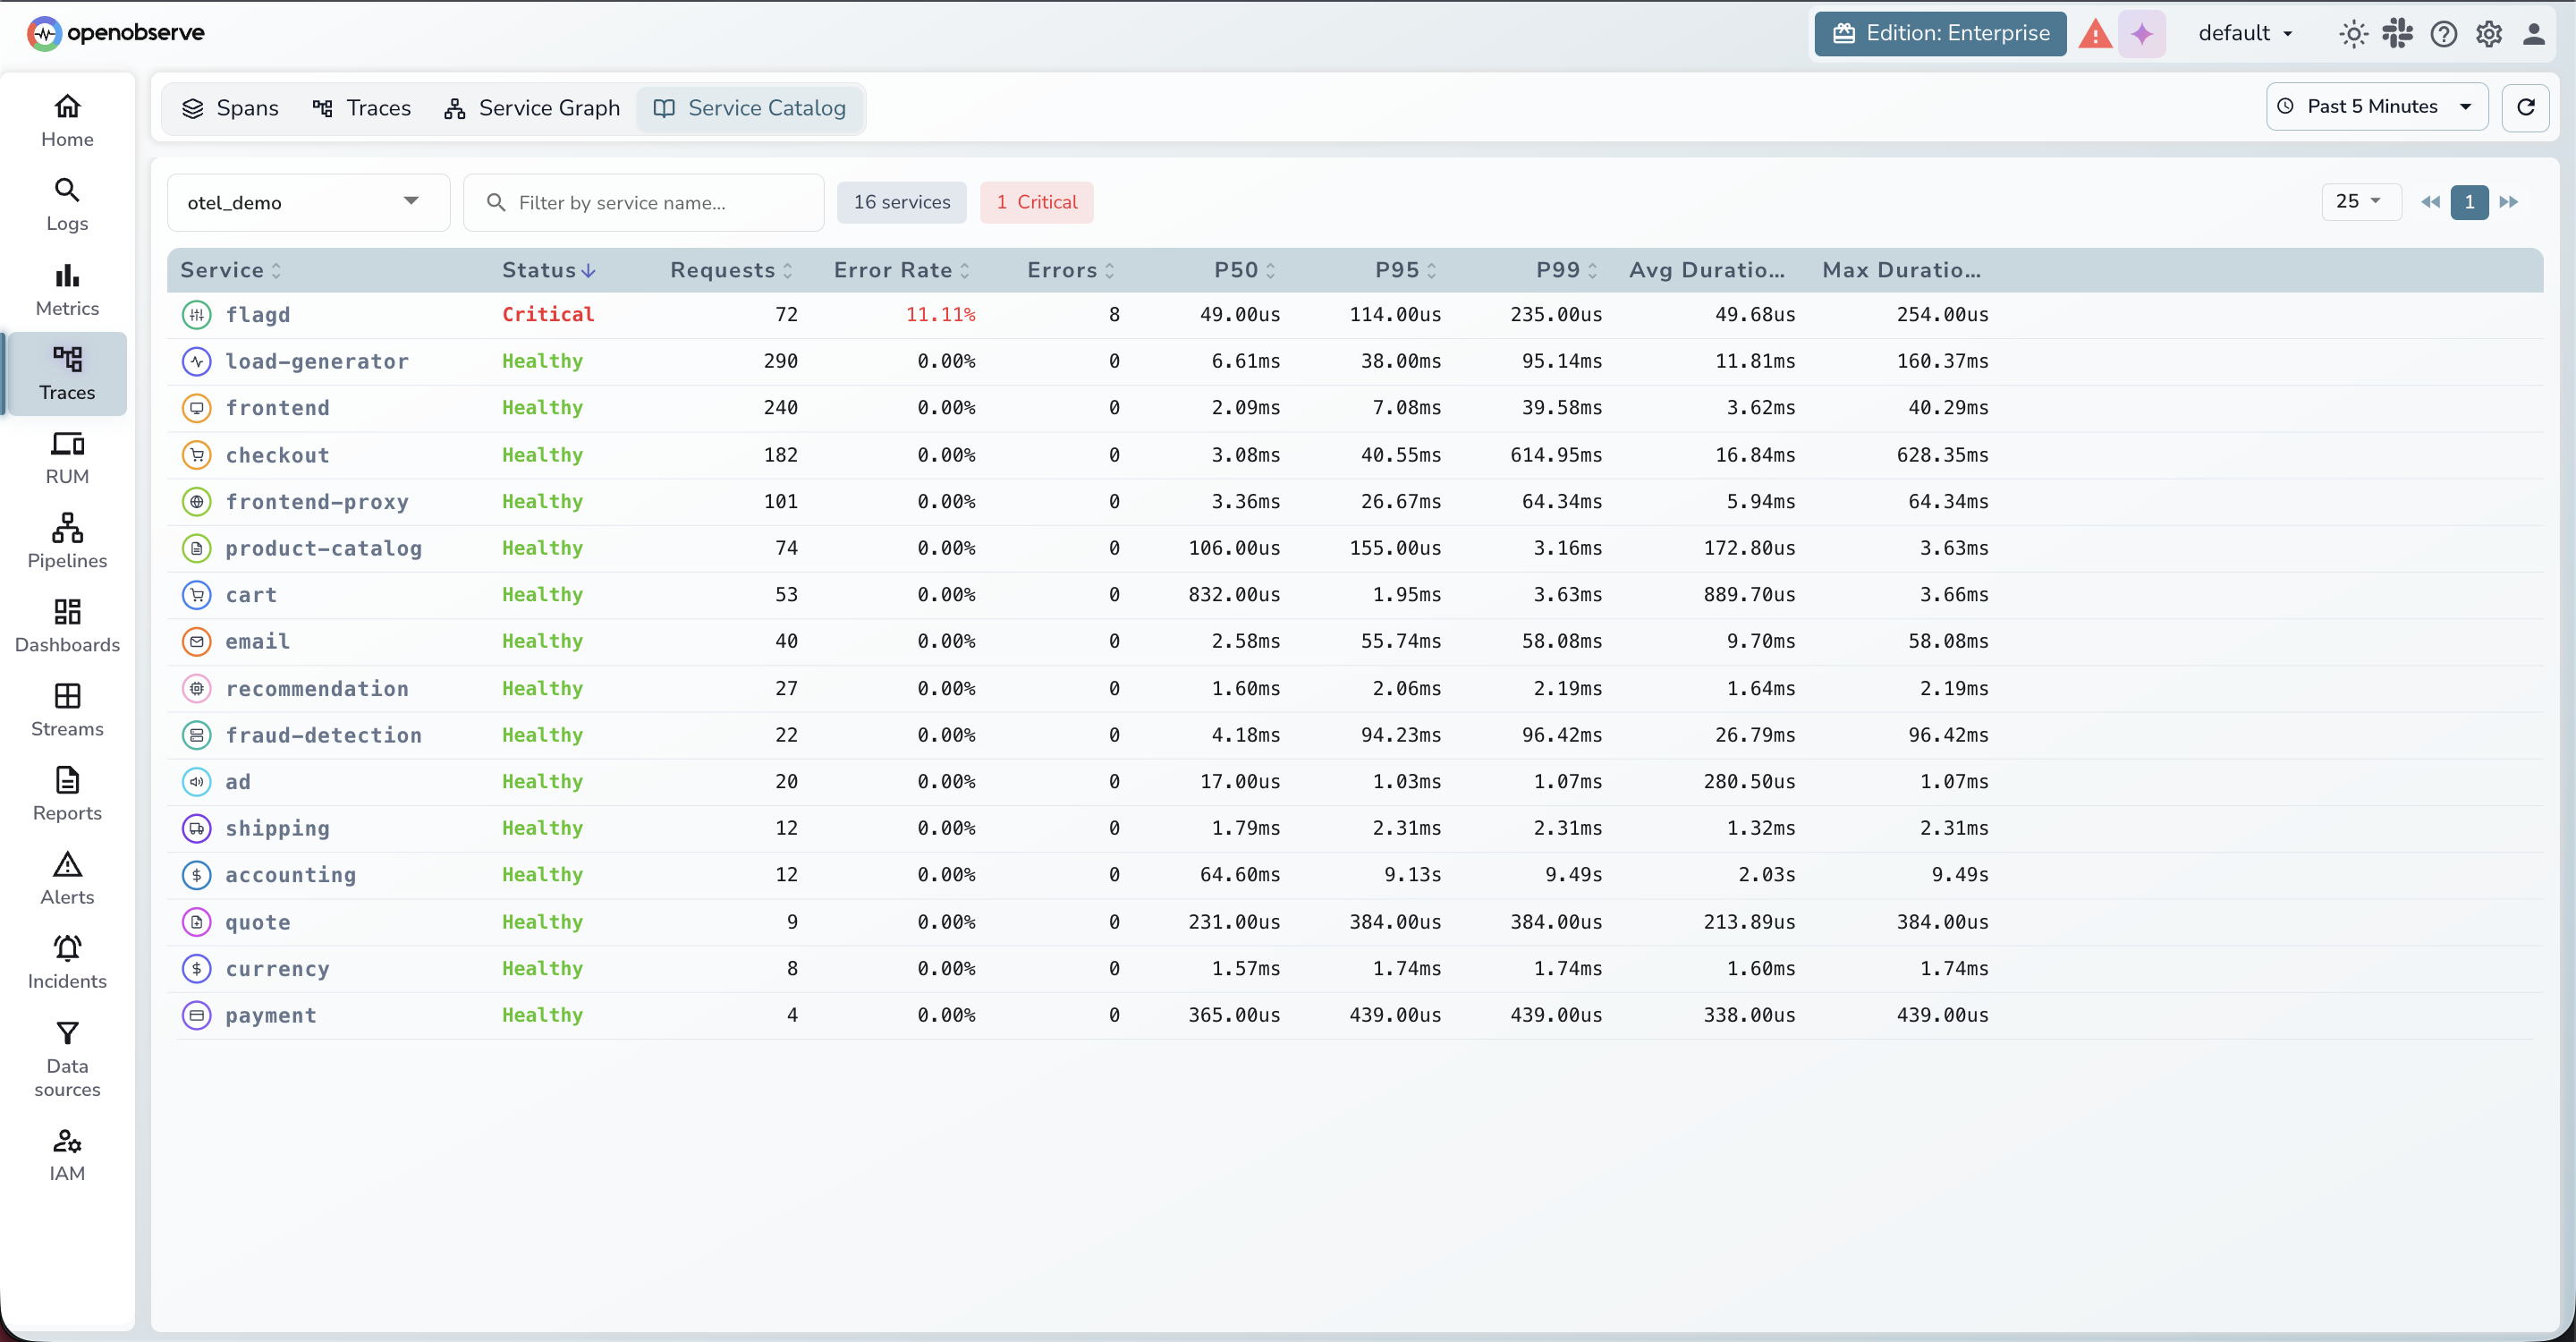
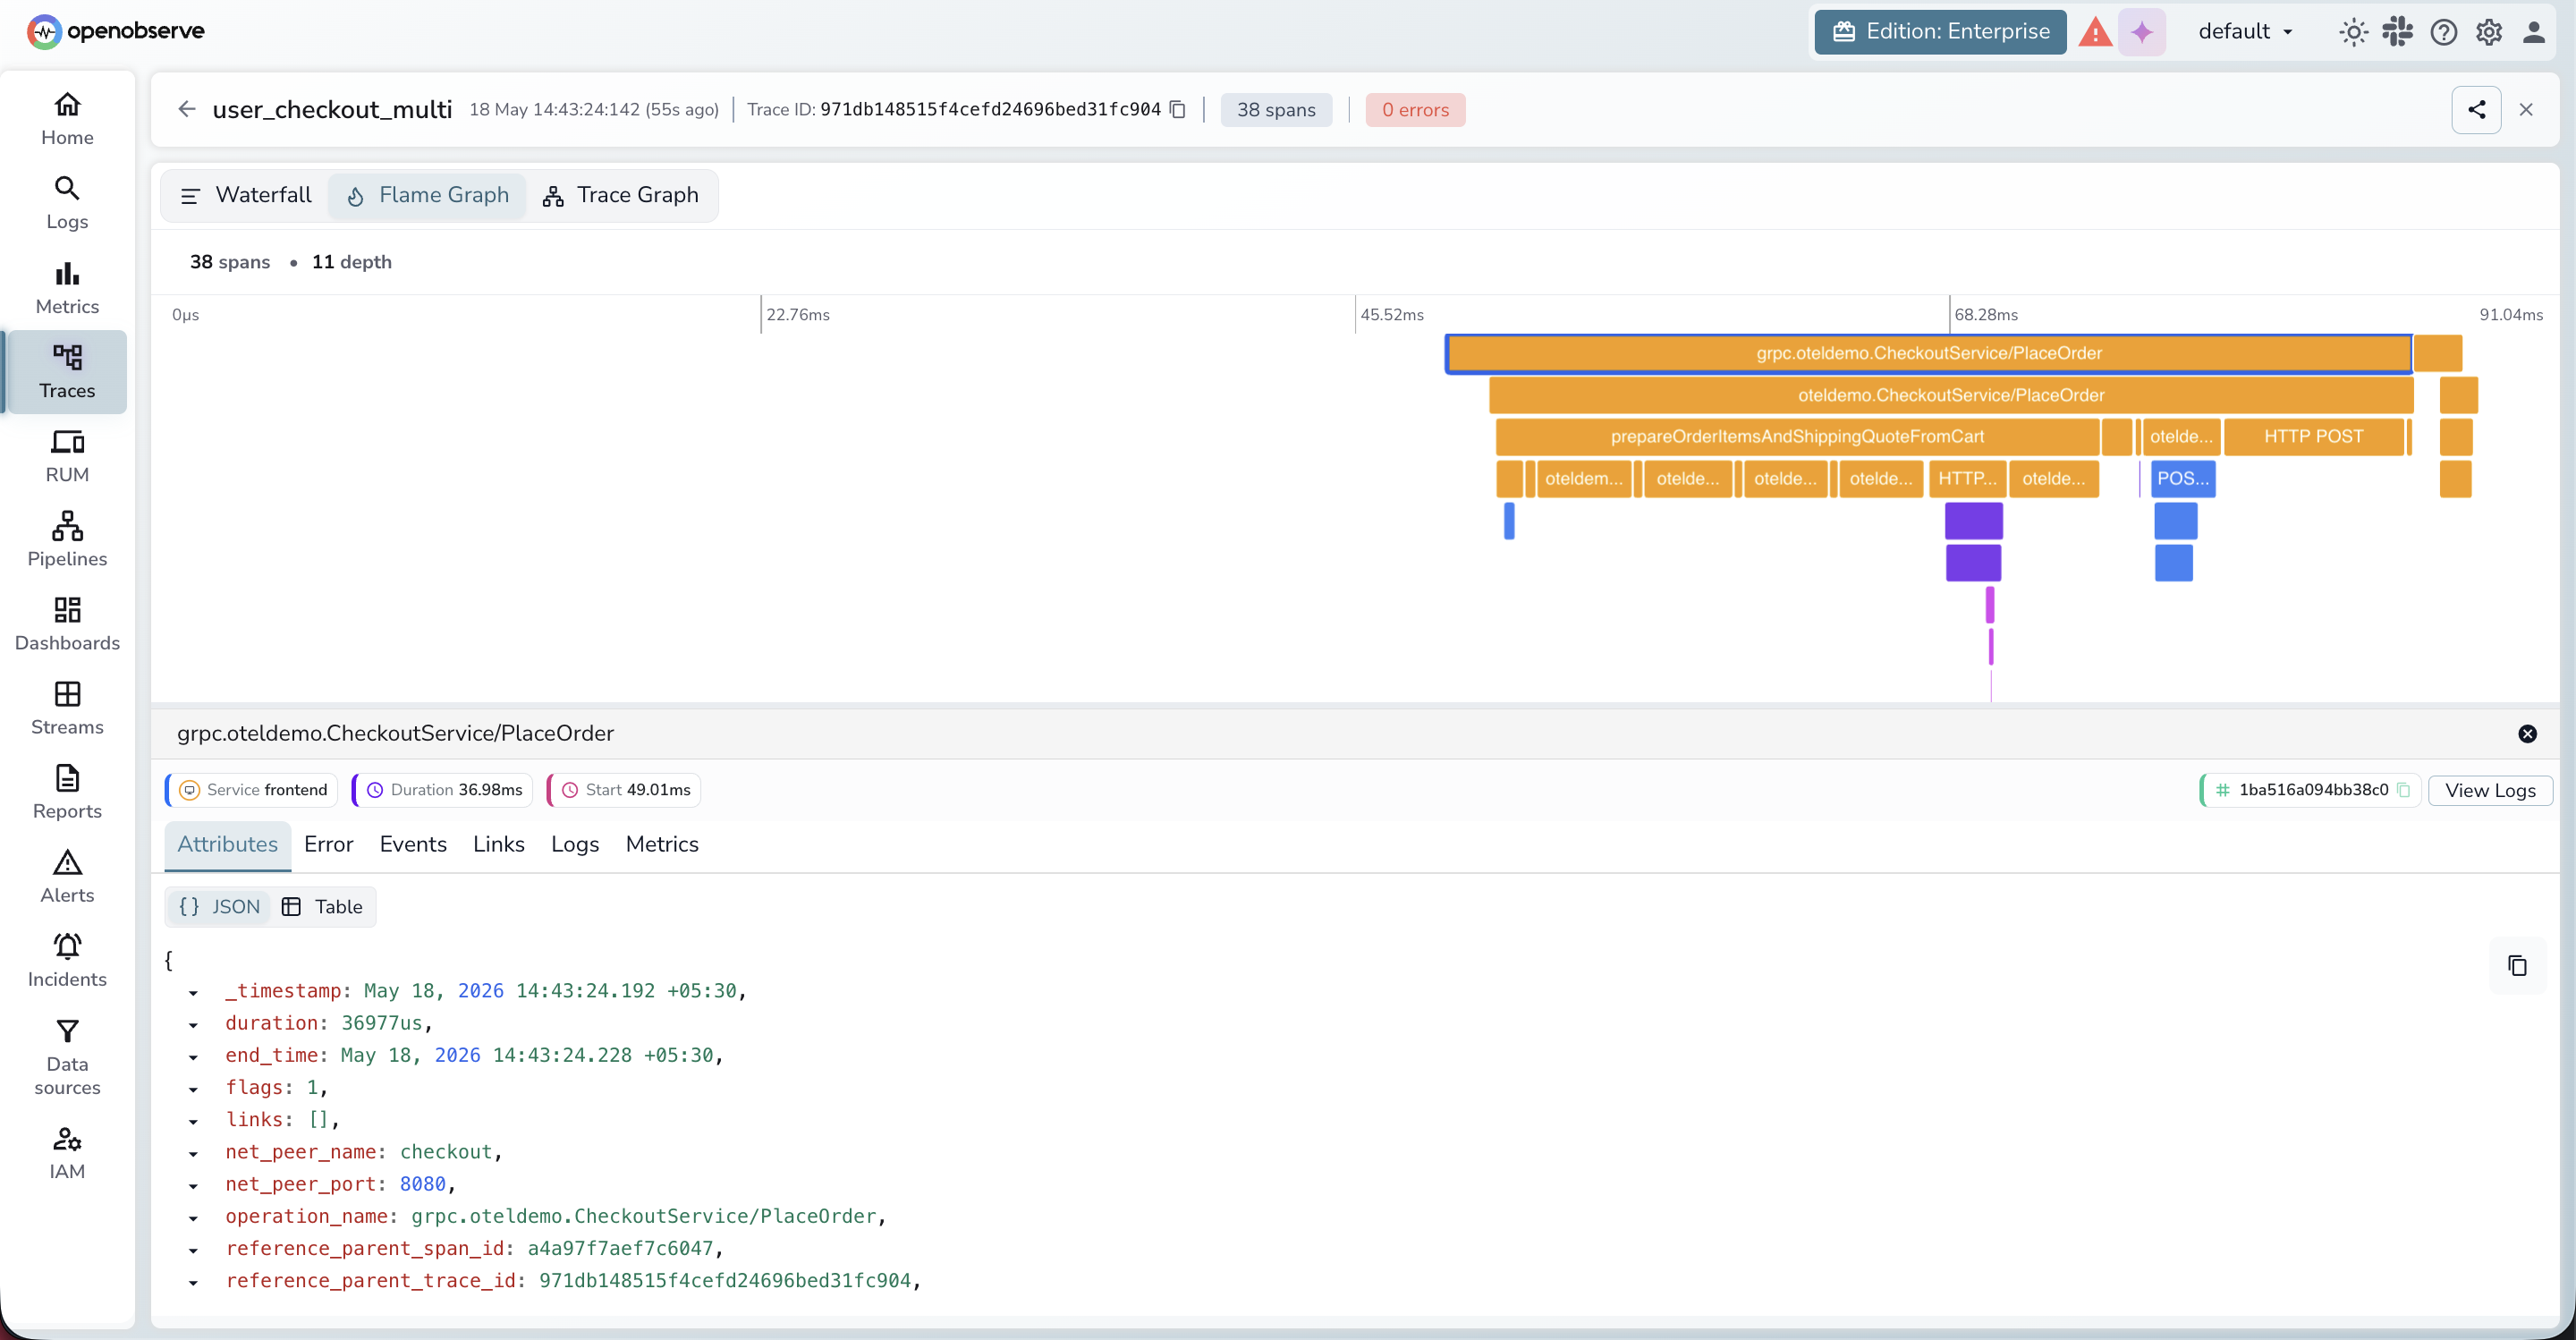
A focused set of interface improvements has landed across the service catalog, traces view, and log correlation , all aimed at reducing the number of clicks it takes to go from a signal to an answer.
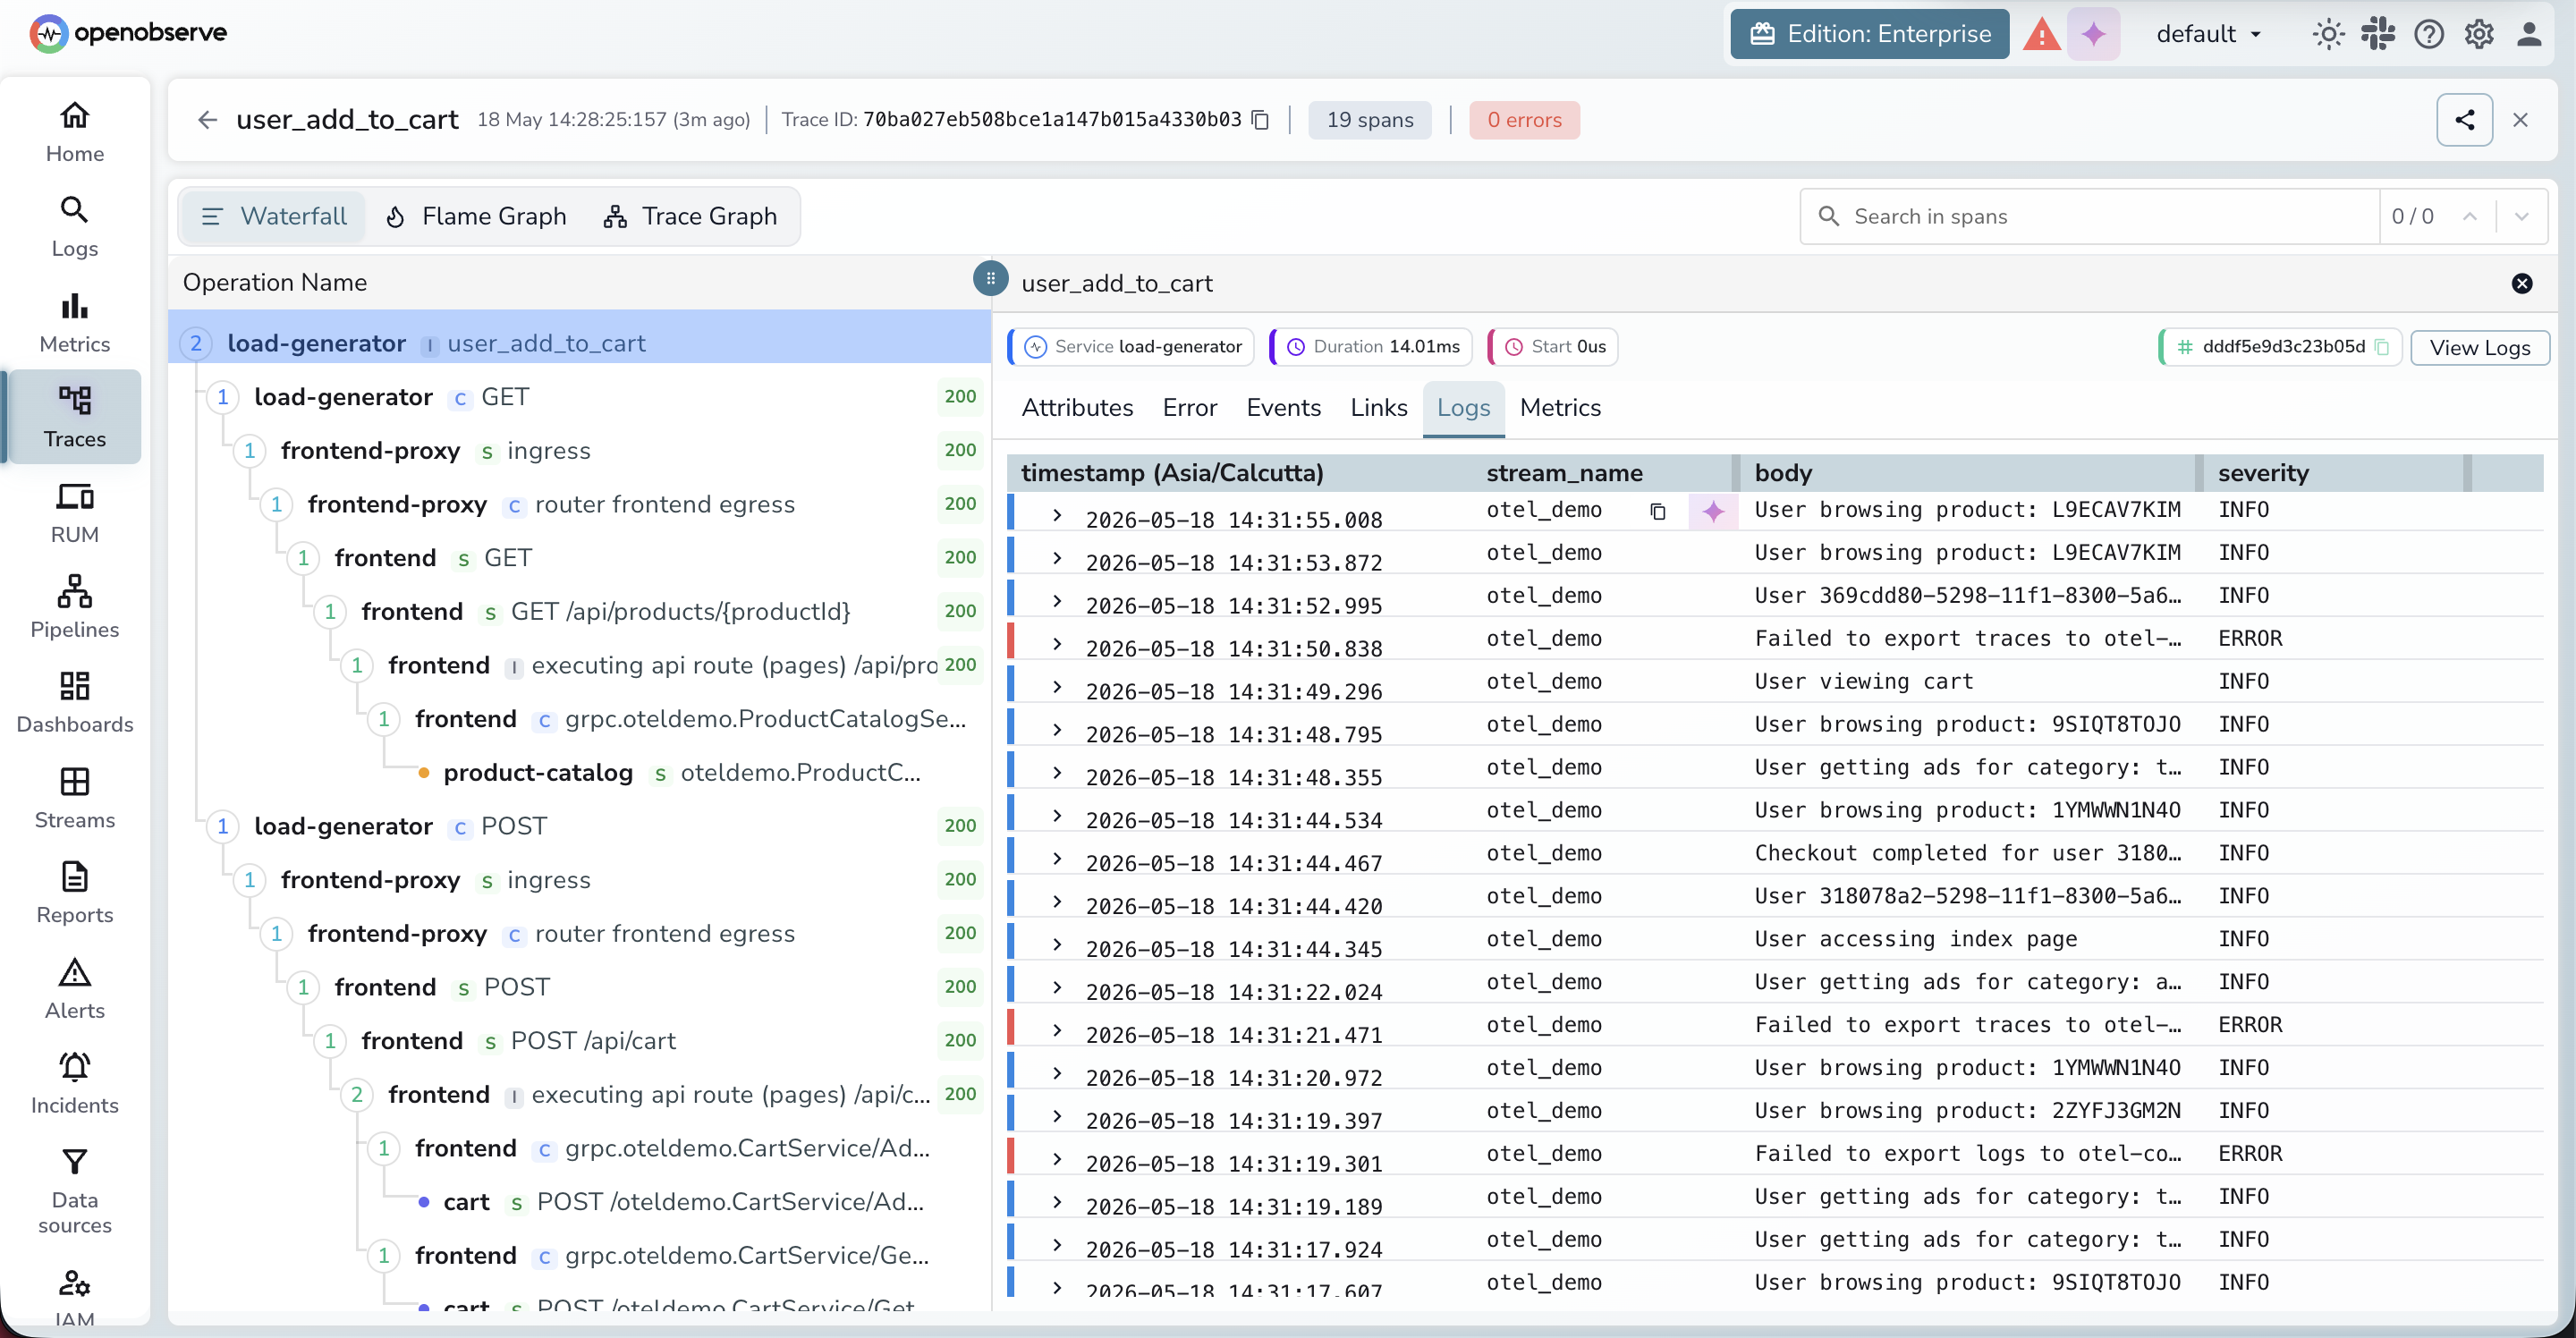
Log-to-log correlation across multiple streams. Log correlation has been extended to work across multiple streams simultaneously. A new "stream name" field makes it possible to correlate logs from different streams. Previously, only a single log stream could be shown for a trace at a time.
Smarter "View Logs" redirection. When navigating from a trace to logs via "View Logs," the system now redirects using precise filters — service name and the specific correlated streams — rather than relying solely on trace and span IDs. The system also performs field-level correlation between streams, mapping fields like k8s.namespace.name across different stream definitions so the right logs surface regardless of how each stream names its fields.
Everything above is live now.
Questions? Join the Slack Community.
Passionate about observability, AI systems, and cloud-native tools. All in on DevOps and improving the developer experience.


