What Backends Support OpenTelemetry (OTLP)? A Complete Guide

Gorakhnath Yadav
April 30, 2026
16 min read
Don’t forget to share!
Getting Started with OpenObserve
Try OpenObserve Cloud today for more efficient and performant observability.

OpenTelemetry standardizes how telemetry data is generated and shipped. It does not store or visualize anything. The OpenTelemetry specification deliberately leaves the backend layer to other tools, so you can pick (or switch) your storage independently of how you instrument.
This separation is the whole point of the OTLP protocol. You instrument once using the OTel SDK, export via OTLP, and the data can flow to any backend that speaks the protocol. Swap backends by changing Collector config, not application code.
But not all backends handle OTLP the same way. Some ingest it natively and preserve every attribute you set. Others translate it into a proprietary schema, which can mean lost fields, altered semantics, or limited queryability. Understanding this distinction matters before you commit.
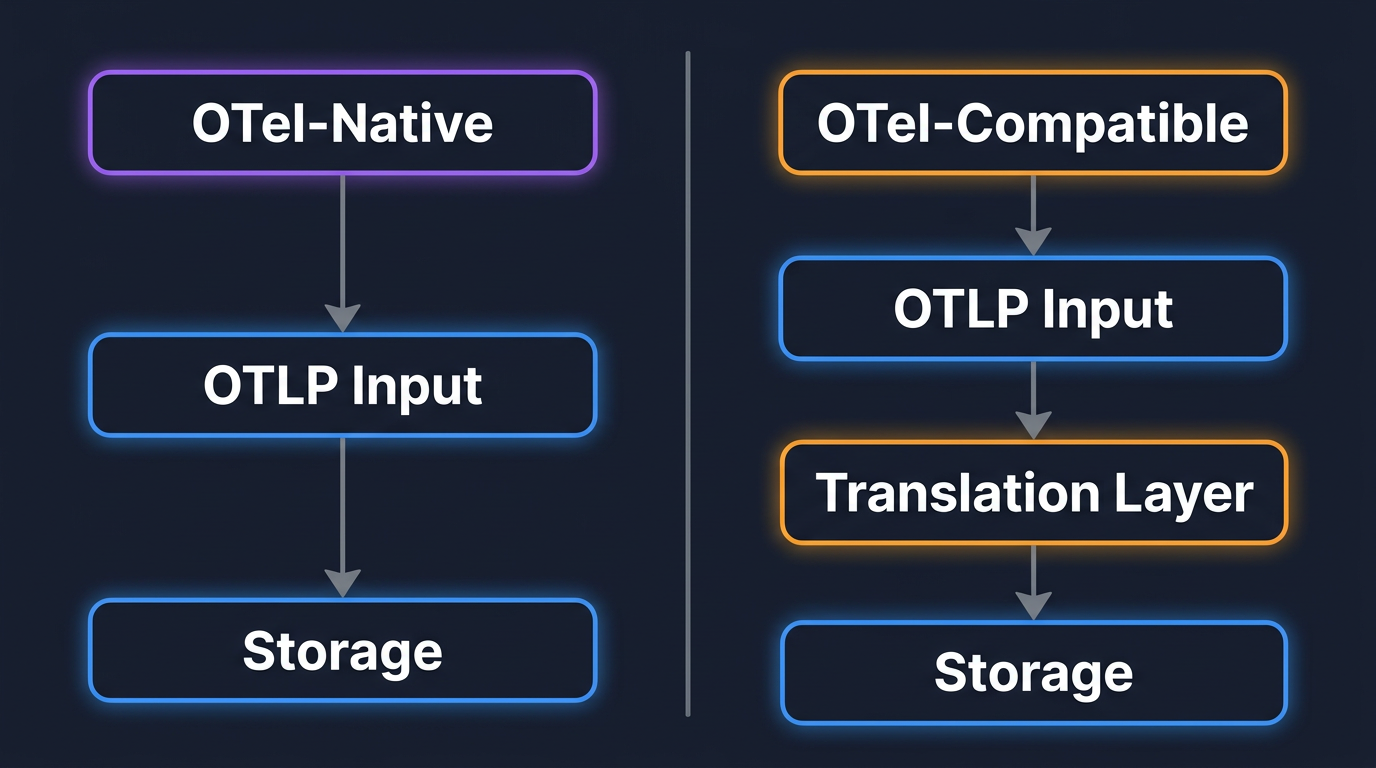
The most important distinction when evaluating backends is whether the system was designed for OpenTelemetry from the start, or whether OTLP support was bolted on later. Both categories work, but the trade-offs are different.
These platforms are built around the OpenTelemetry data model at their core. They ingest OTLP directly, store data in its native format, and preserve semantic conventions end to end. If you tag spans with customer_id or ship metrics with high-cardinality labels, those attributes remain queryable exactly as you set them.
Because there is no schema translation, you get full semantic fidelity. New OTel features (like profiling signals or new semantic conventions) land faster because the backend doesn't need a separate translation layer.
The native category itself splits further by deployment shape. Most OTel-native options (SigNoz, Uptrace) require a separate ClickHouse cluster. Others (Dash0, Honeycomb, Last9) are SaaS-only. OpenObserve is the one that handles all three signals natively in a single binary with object storage (S3, GCS, Azure Blob) as its primary store, which collapses the operational and cost story compared to a ClickHouse-backed stack.
These platforms existed before OpenTelemetry and added OTLP support later. They accept OTLP at the ingestion layer but convert incoming data into their own internal format for storage and querying. This group includes both open-source backends (Prometheus, Loki, Tempo, Elasticsearch) and commercial vendors (Datadog, New Relic, Dynatrace, Splunk).
The upside is ecosystem maturity. These platforms have years of production use, extensive dashboards, and deep integrations. The trade-off is data fidelity. Some backends truncate long attribute keys, drop rarely used fields, or change metric temporality during translation. If you depend on custom span attributes for debugging, verify after ingestion that they survive intact.
Among OTel-native backends, OpenObserve is the one that combines all three signals (traces, metrics, logs) in a single binary with object storage as its primary store. There's no ClickHouse to operate, no separate database holding your telemetry, no proprietary agent in front of OTLP. You point your Collector or SDK at the OTLP endpoint and the data lands in Apache Parquet files on S3, GCS, or Azure Blob.
That storage model is the cost story. Object storage is roughly an order of magnitude cheaper than block-storage-backed columnar databases at retention scale, and Parquet's compression on telemetry data is high. Compute scales independently from storage, so you can hold months of data without keeping that data hot in a cluster. Query happens through SQL or PromQL from the same UI.
OpenObserve also supports AI-powered anomaly detection and LLM observability, so the same backend covers traditional infrastructure and AI workloads.
| Signals | Traces, metrics, logs |
| OTLP transport | gRPC and HTTP |
| Deployment | Self-hosted (single binary or HA) or OpenObserve Cloud |
| Storage | Apache Parquet on S3 / GCS / Azure Blob |
| Query language | SQL, PromQL |
| Best for | Teams that want all three signals in one place, with object-storage economics and no separate database to operate |
SigNoz is open source, built on ClickHouse, and designed around OpenTelemetry from day one. It ingests OTLP natively and provides traces, metrics, and logs in a single UI. SigNoz offers both a self-hosted option and a cloud-managed version.
| Signals | Traces, metrics, logs |
| OTLP transport | gRPC and HTTP |
| Deployment | Self-hosted (Docker/Kubernetes) or SigNoz Cloud |
| Query language | ClickHouse SQL, custom query builder |
| Best for | Teams wanting a unified, self-hosted OTel-native platform |
Grafana's approach is a stack of specialized backends: Tempo for traces, Mimir for metrics, Loki for logs. Each accepts OTLP either directly or via the Collector. Grafana provides the visualization layer on top. The Grafana Labs docker-otel-lgtm project bundles the full stack for quick local setup.
The strength is flexibility. The trade-off is operational complexity: three query languages (TraceQL, PromQL, LogQL), three storage backends, three sets of scaling concerns.
| Signals | Traces (Tempo), metrics (Mimir), logs (Loki) |
| OTLP transport | gRPC and HTTP |
| Deployment | Self-hosted or Grafana Cloud |
| Query language | TraceQL, PromQL, LogQL |
| Best for | Teams already invested in the Grafana ecosystem or needing per-signal backend flexibility |
Jaeger is a CNCF graduated project focused exclusively on distributed tracing. It accepts OTLP directly and stores traces in Elasticsearch, Cassandra, or (more recently) Kafka plus a columnar store. Jaeger's own client libraries have been deprecated in favor of OpenTelemetry SDKs, making OTel the primary way to get data into Jaeger.
| Signals | Traces only |
| OTLP transport | gRPC and HTTP |
| Deployment | Self-hosted |
| Query language | Jaeger UI search / JQL |
| Best for | Teams that only need tracing and want a focused, mature tool |
Prometheus supports OTLP ingestion for metrics over HTTP, stable in Prometheus 3.0 (introduced experimentally in 2.47) and enabled with the --web.enable-otlp-receiver flag. It does not support traces or logs. Prometheus accepts OTLP delta-temporality metrics and converts them to cumulative for storage, which is fine for most metric types but worth knowing if you rely on delta semantics downstream.
| Signals | Metrics only |
| OTLP transport | HTTP only (no gRPC for direct ingestion) |
| Deployment | Self-hosted |
| Query language | PromQL |
| Best for | Teams with existing Prometheus infrastructure adding OTel instrumentation |
Elastic natively ingests OTLP data through their Elastic Distributions of OpenTelemetry (EDOT). Once ingested, you get Elastic's full-text search, machine-learning anomaly detection, and Kibana visualization. The OTel-first approach minimizes schema translations and aims to preserve semantic conventions without altering custom attributes.
| Signals | Traces, metrics, logs |
| OTLP transport | gRPC and HTTP (via EDOT) |
| Deployment | Self-hosted or Elastic Cloud |
| Query language | KQL, ES|QL, Lucene |
| Best for | Teams already running Elasticsearch or needing strong log search alongside traces |
Uptrace is an open-source, OTel-native APM built on ClickHouse. It covers traces, metrics, and logs with a SQL-based query interface and automatic trace-to-log correlation.
| Signals | Traces, metrics, logs |
| OTLP transport | gRPC and HTTP |
| Deployment | Self-hosted or Uptrace Cloud |
| Query language | SQL |
| Best for | Smaller teams wanting a lightweight, ClickHouse-based all-in-one |
Zipkin is an older distributed tracing system. It accepts data from the OTel Collector via the Zipkin exporter, though this involves a format translation from OTLP to Zipkin's native format. It's largely been superseded by Jaeger and OTel-native backends for new deployments.
| Signals | Traces only |
| OTLP transport | Via Collector Zipkin exporter (not native OTLP) |
| Best for | Legacy tracing setups transitioning to OTel |
Datadog accepts OTLP via its agent or directly to its SaaS endpoint. However, Datadog transforms OTLP data into its proprietary APM data model. Custom attributes may be renamed, span relationships may be altered, and the full OTel semantic convention set isn't always preserved 1:1. Datadog explicitly warns against mixing OTel and Datadog SDKs in the same application.
| Signals | Traces, metrics, logs |
| Pricing | Per-host + data volume + per-feature add-ons |
| Trade-off | Deep feature set, but strong vendor lock-in and complex pricing |
New Relic accepts OTLP data directly. Their free tier includes 100 GB/month of ingestion. Data lands in their proprietary NRDB storage. Per-user pricing can become expensive as teams scale.
| Signals | Traces, metrics, logs |
| Pricing | Per-user + per-GB ingestion |
| Trade-off | Generous free tier, but user-based pricing discourages broad team access |
Dynatrace supports OTLP ingestion alongside its proprietary OneAgent. Their causal AI engine (Davis) provides automated root cause analysis. OTel data is integrated into their proprietary data model.
| Signals | Traces, metrics, logs |
| Pricing | Per-unit consumption model |
| Trade-off | Strong AI-driven analysis, but deep vendor coupling |
Splunk accepts OTLP via the Splunk distribution of the OTel Collector. Traces go to Splunk APM, metrics to Splunk Infrastructure Monitoring, and logs to Splunk platform. The AlwaysOn Profiling feature adds CPU and memory profiling correlated with traces.
| Signals | Traces, metrics, logs |
| Pricing | Workload-based |
| Trade-off | Enterprise-scale capabilities with enterprise-scale pricing |
Honeycomb is purpose-built for high-cardinality trace analysis and was an early adopter of OpenTelemetry. It accepts OTLP natively and preserves high-cardinality attributes well, making it strong for detailed debugging of complex distributed systems.
Unlike most commercial vendors, Honeycomb ingests OTLP natively without translating it into a proprietary format.
| Signals | Traces, metrics, logs (traces are the primary strength) |
| Pricing | Event-based |
| Trade-off | Excellent for debugging, less comprehensive as a full-stack monitoring platform |
The major cloud providers all offer OTLP-compatible managed services:
AWS: X-Ray (traces) and CloudWatch (metrics/logs) accept OTel data via the AWS Distro for OpenTelemetry (ADOT) Collector.
Google Cloud: Cloud Trace and Cloud Monitoring accept OTLP directly or via the Google Cloud OTel exporter.
Azure: Azure Monitor accepts OTLP data via the Azure Monitor OpenTelemetry exporter. Application Insights provides the analysis layer.
Cloud provider backends are convenient if you're already committed to a specific cloud, but they create platform lock-in that goes beyond the observability layer.
The headers below assume OTLP is supported in some form. The differences are in which signals, where it stores them, and how you query.
| Backend | Signals | Self-hosted | Storage | Query language | OTLP transport |
|---|---|---|---|---|---|
| OpenObserve | Traces, metrics, logs | Yes (single binary or HA) | Parquet on S3 / GCS / Azure Blob | SQL, PromQL | gRPC + HTTP |
| SigNoz | Traces, metrics, logs | Yes (Docker / K8s) | ClickHouse | ClickHouse SQL, query builder | gRPC + HTTP |
| Grafana stack (Tempo + Mimir + Loki) | Traces, metrics, logs (split) | Yes | Object storage per component | TraceQL, PromQL, LogQL | gRPC + HTTP |
| Jaeger | Traces only | Yes | Elasticsearch / Cassandra / Kafka + columnar | Jaeger UI search / JQL | gRPC + HTTP |
| Prometheus | Metrics only | Yes | Local TSDB | PromQL | HTTP only |
| Elastic (EDOT) | Traces, metrics, logs | Yes | Elasticsearch | KQL, ES|QL, Lucene | gRPC + HTTP |
| Uptrace | Traces, metrics, logs | Yes | ClickHouse | SQL | gRPC + HTTP |
| Honeycomb | Traces, metrics, logs | No (SaaS) | Proprietary columnar | Query builder | gRPC + HTTP |
| Datadog | Traces, metrics, logs | No (SaaS) | Proprietary | Datadog query DSL | gRPC + HTTP (via Agent or direct) |
| New Relic | Traces, metrics, logs | No (SaaS) | NRDB | NRQL | gRPC + HTTP |
| Dynatrace | Traces, metrics, logs | No (SaaS) | Grail | DQL | gRPC + HTTP |
| Splunk Observability | Traces, metrics, logs | No (SaaS) | Proprietary | SignalFlow, SPL | gRPC + HTTP |
Two patterns to notice. First, the backends that store telemetry in object storage (OpenObserve, the Grafana stack components) have a different cost curve at retention than the ones that store it in a database cluster (SigNoz, Uptrace, Elastic). Second, every SaaS option is OTel-compatible rather than OTel-native except Honeycomb, which is the SaaS that ingests OTLP without translating it.
The list of backends that "support OTLP" is long. The real question is how well they support it. Here's what to check:
Signal coverage. Does it accept all three signals (traces, metrics, logs) via OTLP, or only a subset? Prometheus only handles metrics. Jaeger only handles traces. Unified backends like OpenObserve, SigNoz, and Grafana stack cover all three.
Data fidelity. After ingestion, are your custom attributes, resource labels, and semantic conventions intact and queryable? Or has the backend normalized them into a different schema? The only reliable test is to send your actual telemetry and check what comes out.
OTLP transport. Does it support both gRPC (port 4317) and HTTP (port 4318)? Some backends only support one. gRPC is generally more efficient for high-volume pipelines; HTTP is easier to route through proxies and load balancers.
Query capabilities. SQL, PromQL, proprietary DSL? SQL-based backends lower the barrier for teams that don't want to learn a vendor-specific language. Check whether you can join across signal types (e.g., correlate a trace with related logs).
Cost model. Per-host, per-GB, per-signal, per-user? Model your cost at your actual data volume before committing. Some pricing models that look cheap at demo scale become painful at production scale. Observability costs are a real concern for most teams, and the right backend choice can make a 10x difference.
Operational overhead. Self-hosted means you run, scale, and upgrade the backend yourself. Managed/SaaS means the vendor handles that. Be honest about your team's capacity. Running a production Elasticsearch cluster or a Prometheus federation at scale is real operational work.
If there's one takeaway from this post, it's this: the OpenTelemetry Collector is what makes backend choice reversible.
The Collector sits between your applications and your backend. It receives OTLP from your SDKs, processes the data (batching, filtering, sampling, PII redaction), and exports to one or more destinations. Because it handles the connection to the backend, your application code never needs to know where the data is going.
This means you can:
A basic Collector config sending to OpenObserve looks like this:
receivers:
  otlp:
    protocols:
      grpc:
        endpoint: 0.0.0.0:4317
      http:
        endpoint: 0.0.0.0:4318

processors:
  batch:

exporters:
  otlphttp/openobserve:
    endpoint: https://api.openobserve.ai/api/your-org
    headers:
      Authorization: Basic <your-base64-credentials>
      stream-name: default

service:
  pipelines:
    traces:
      receivers: [otlp]
      processors: [batch]
      exporters: [otlphttp/openobserve]
    metrics:
      receivers: [otlp]
      processors: [batch]
      exporters: [otlphttp/openobserve]
    logs:
      receivers: [otlp]
      processors: [batch]
      exporters: [otlphttp/openobserve]
To fan out to a second backend, add another exporter and include it in the pipeline's exporter list. The Collector handles the rest.
For a self-hosted OpenObserve target with credentials pulled from the environment, a dedicated exporter per signal, and queue / retry tuning suited to production traffic, the config looks like this (note: in OpenObserve each metric is written to its own stream automatically, so the metrics exporter does not set a stream-name header):
receivers:
  otlp:
    protocols:
      grpc:
        endpoint: 0.0.0.0:4317
      http:
        endpoint: 0.0.0.0:4318

processors:
  batch:
    timeout: 10s
  memory_limiter:
    check_interval: 1s
    limit_percentage: 80
    spike_limit_percentage: 25

exporters:
  otlphttp/openobserve_traces:
    endpoint: https://openobserve.example.com/api/default
    headers:
      Authorization: ${env:O2_AUTH}
      stream-name: traces
    sending_queue:
      enabled: true
      num_consumers: 4
      queue_size: 5000
    retry_on_failure:
      enabled: true
      max_interval: 30s
  otlphttp/openobserve_metrics:
    endpoint: https://openobserve.example.com/api/default
    headers:
      Authorization: ${env:O2_AUTH}
    sending_queue:
      enabled: true
      num_consumers: 4
      queue_size: 5000
    retry_on_failure:
      enabled: true
      max_interval: 30s
  otlphttp/openobserve_logs:
    endpoint: https://openobserve.example.com/api/default
    headers:
      Authorization: ${env:O2_AUTH}
      stream-name: logs
    sending_queue:
      enabled: true
      num_consumers: 4
      queue_size: 5000
    retry_on_failure:
      enabled: true
      max_interval: 30s

service:
  pipelines:
    traces:
      receivers: [otlp]
      processors: [memory_limiter, batch]
      exporters: [otlphttp/openobserve_traces]
    metrics:
      receivers: [otlp]
      processors: [memory_limiter, batch]
      exporters: [otlphttp/openobserve_metrics]
    logs:
      receivers: [otlp]
      processors: [memory_limiter, batch]
      exporters: [otlphttp/openobserve_logs]
O2_AUTH is the full Basic <base64-credentials> header value, so credentials never live in the config file. Per-signal exporters let each pipeline target a different stream without one signal's backpressure stalling the others.
For deeper coverage of Collector architecture and components, see the OTel Collector Contrib guide and the introduction to OTel exporters.
If you're evaluating backends and want to see how OTLP ingestion works in practice, OpenObserve Cloud is the fastest way to test. Point your Collector or SDK at the OTLP endpoint, send some traffic, and explore your traces, metrics, and logs in a single interface with SQL and PromQL. No proprietary agent required, no data translation, no credit card for the free tier.
Full setup docs and per-language quickstarts are in the OpenObserve ingestion documentation.
Gorakhnath is a passionate developer advocate, working on bridging the gap between developers and the tools they use. He focuses on building communities and creating content that empowers developers to build better software.