n8n Monitoring with OpenTelemetry and OpenObserve

Gorakhnath Yadav
May 05, 2026
9 min read
Don’t forget to share!
Getting Started with OpenObserve
Try OpenObserve Cloud today for more efficient and performant observability.

TL:DR;
openobserve-telemetry-sdk wraps those calls in OTel spans automatically. This works regardless of whether n8n is self-hosted or Cloud.
n8n gives you an execution list and per-run logs in the UI. That covers debugging: click into a failed run, see which node errored, inspect the input and output. For a development environment, that is enough.
In production it falls short. The execution list is not queryable from outside n8n. Alerting on failure rate is not possible. Cross-workflow correlation, queue depth comparisons, and week-over-week trend analysis are all outside its scope. If a node silently times out and triggers a retry, the UI shows the retry succeeded. The underlying latency problem is invisible.
n8n is a Node.js application, which means standard observability tooling applies. The gap is configuration, not capability. For workflow automation at any production scale, full-stack observability connecting logs, metrics, and traces matters the same as for any other service in your stack.
Self-hosted n8n includes a Prometheus metrics endpoint, disabled by default. Set N8N_METRICS=true to enable it at /metrics. The endpoint exposes counters and histograms covering execution activity across all workflows.
Key metrics the endpoint exposes:
| Metric | Type | What it tells you |
|---|---|---|
n8n_workflow_execution_duration_seconds |
Histogram | Per-execution wall time; status label: success or failed; mode label: manual, webhook, or trigger |
n8n_active_workflow_count |
Gauge | Number of active workflows |
n8n_scaling_mode_queue_jobs_waiting |
Gauge | Jobs queued but not yet picked up (worker mode) |
n8n_scaling_mode_queue_jobs_active |
Gauge | Jobs being processed by workers (worker mode) |
n8n_scaling_mode_queue_jobs_completed |
Counter | Total completed jobs since instance start (worker mode) |
n8n_scaling_mode_queue_jobs_failed |
Counter | Total failed jobs since instance start (worker mode) |
The last four metrics require N8N_METRICS_INCLUDE_QUEUE_METRICS=true set as an environment variable on your n8n container, alongside N8N_METRICS=true.
n8n Enterprise includes log streaming: execution events forwarded in real time to a syslog server or a generic webhook. It gives you event-level data outside the UI and integrates with log aggregators. This is an Enterprise-only feature.
For self-hosted n8n, you get both metrics and traces. Prometheus metrics need only an environment variable. OTel traces require a small custom Docker image that installs the OTel SDK and loads a bootstrap file before n8n starts. Neither approach modifies n8n's workflow logic.
Add these environment variables to your n8n container. No custom image needed for this step:
N8N_METRICS=true
N8N_METRICS_INCLUDE_QUEUE_METRICS=true
Verify the endpoint is live after restarting:
curl http://localhost:5678/metrics | grep n8n_
n8n does not ship with the OTel SDK initialized, so traces require a bootstrap file loaded before the process starts via NODE_OPTIONS=--require. This means building a small custom image on top of the official one.
Create tracing.js:
"use strict";

const { NodeSDK } = require("@opentelemetry/sdk-node");
const {
  OTLPTraceExporter,
} = require("@opentelemetry/exporter-trace-otlp-http");
const {
  getNodeAutoInstrumentations,
} = require("@opentelemetry/auto-instrumentations-node");

const sdk = new NodeSDK({
  traceExporter: new OTLPTraceExporter({
    url:
      process.env.OTEL_EXPORTER_OTLP_ENDPOINT ||
      "http://otel-collector:4318/v1/traces",
  }),
  instrumentations: [
    getNodeAutoInstrumentations({
      "@opentelemetry/instrumentation-fs": { enabled: false },
    }),
  ],
});

sdk.start();

process.on("SIGTERM", () => {
  sdk.shutdown().finally(() => process.exit(0));
});
Filesystem instrumentation is disabled to suppress span noise from n8n's internal file operations.
Create a Dockerfile that installs the OTel packages at the system level where Node.js resolves them via NODE_OPTIONS:
FROM n8nio/n8n:2.19.3

USER root

RUN mkdir -p /opt/otel && npm install --prefix /opt/otel \
  @opentelemetry/sdk-node \
  @opentelemetry/auto-instrumentations-node \
  @opentelemetry/exporter-trace-otlp-http

COPY tracing.js /opt/otel/tracing.js

USER node
The Collector scrapes the Prometheus endpoint for metrics and receives OTLP spans from n8n. Both streams go to OpenObserve. The OpenTelemetry Collector Contrib distribution includes both the Prometheus receiver and OTLP exporter needed here.
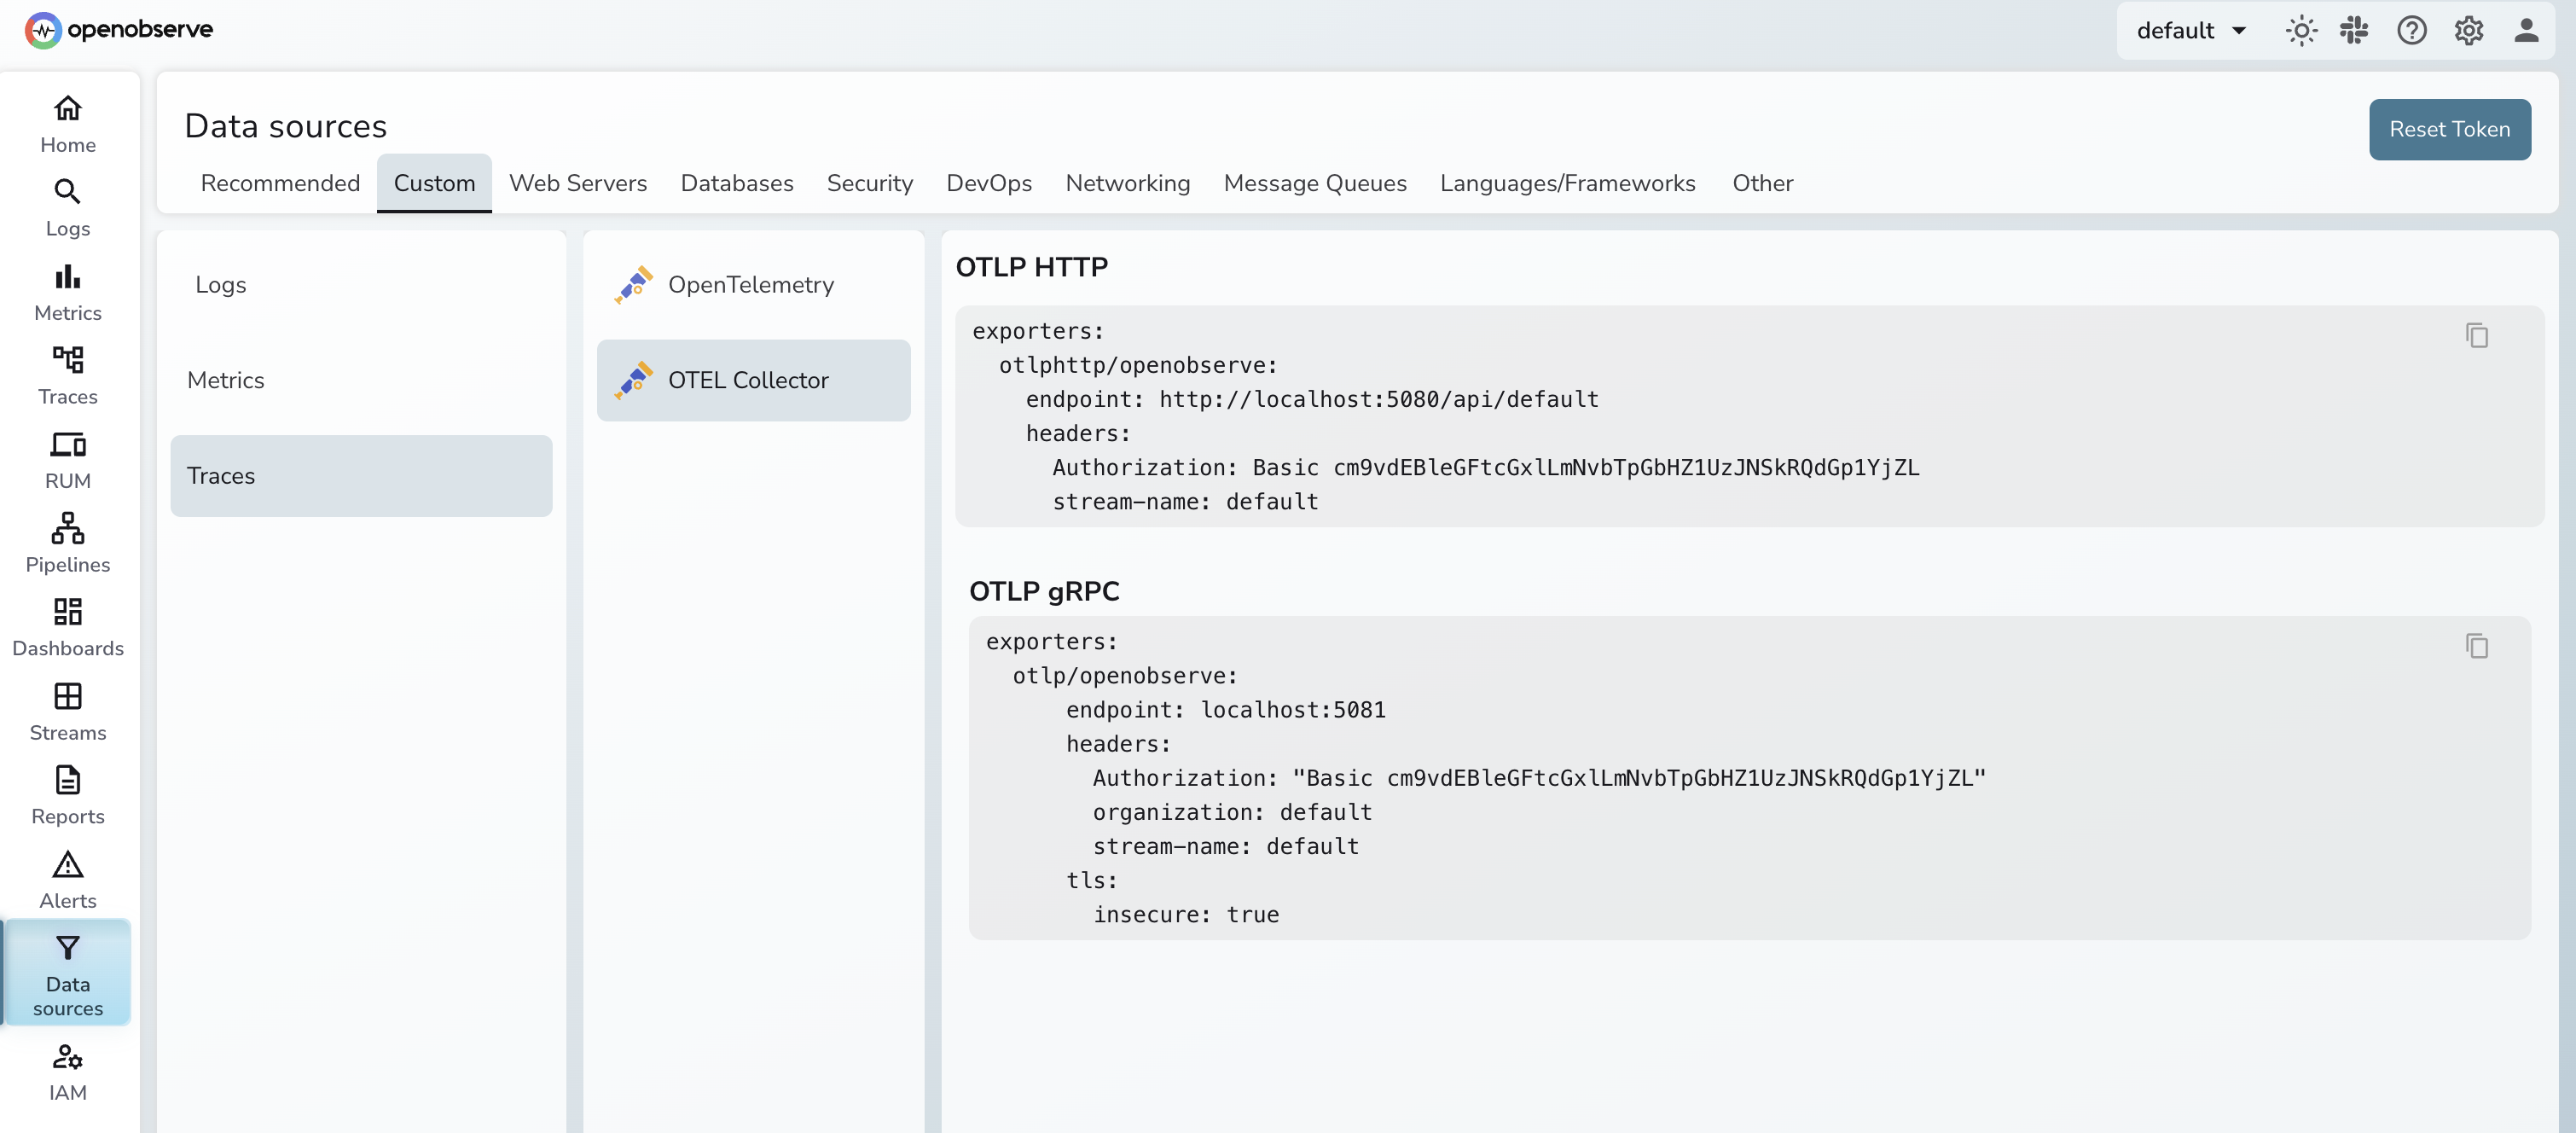
Before writing the config, grab your OTLP endpoint and authorization header from the OpenObserve UI under Data Sources → Custom → Logs/Traces/Metrics → OTEL Collector. The page shows the exact endpoint URL and the pre-encoded Authorization header for your organization, so you don't have to construct them by hand.
Create otel-collector-config.yaml:
receivers:
  prometheus:
    config:
      scrape_configs:
        - job_name: n8n
          scrape_interval: 30s
          static_configs:
            - targets: ["n8n:5678"]
          metrics_path: /metrics

  otlp:
    protocols:
      grpc:
        endpoint: 0.0.0.0:4317
      http:
        endpoint: 0.0.0.0:4318

processors:
  batch:
    timeout: 5s

exporters:
  otlphttp/openobserve:
    endpoint: <your-openobserve-otlp-endpoint>
    headers:
      Authorization: <your-authorization-header>

service:
  pipelines:
    metrics:
      receivers: [prometheus]
      processors: [batch]
      exporters: [otlphttp/openobserve]
    traces:
      receivers: [otlp]
      processors: [batch]
      exporters: [otlphttp/openobserve]
Paste the endpoint and Authorization header straight from the Data Sources page above. For a full breakdown of OTLP exporter options, see Getting Started with OpenTelemetry OTLP Exporters.
services:
  n8n:
    build:
      context: .
      dockerfile: Dockerfile
    ports:
      - "5678:5678"
    environment:
      - N8N_METRICS=true
      - N8N_METRICS_INCLUDE_QUEUE_METRICS=true
      - NODE_OPTIONS=--require /opt/otel/tracing.js
      - OTEL_SERVICE_NAME=n8n
      - OTEL_EXPORTER_OTLP_ENDPOINT=http://otel-collector:4318/v1/traces
    volumes:
      - n8n_data:/home/node/.n8n
    depends_on:
      - otel-collector

  otel-collector:
    image: otel/opentelemetry-collector-contrib:latest
    command: ["--config=/etc/otel-collector-config.yaml"]
    volumes:
      - ./otel-collector-config.yaml:/etc/otel-collector-config.yaml
    ports:
      - "4317:4317"
      - "4318:4318"

volumes:
  n8n_data:
Start the stack:
docker compose up -d
Allow 30-60 seconds for the first Prometheus scrape to complete and the first workflow execution spans to appear in OpenObserve.
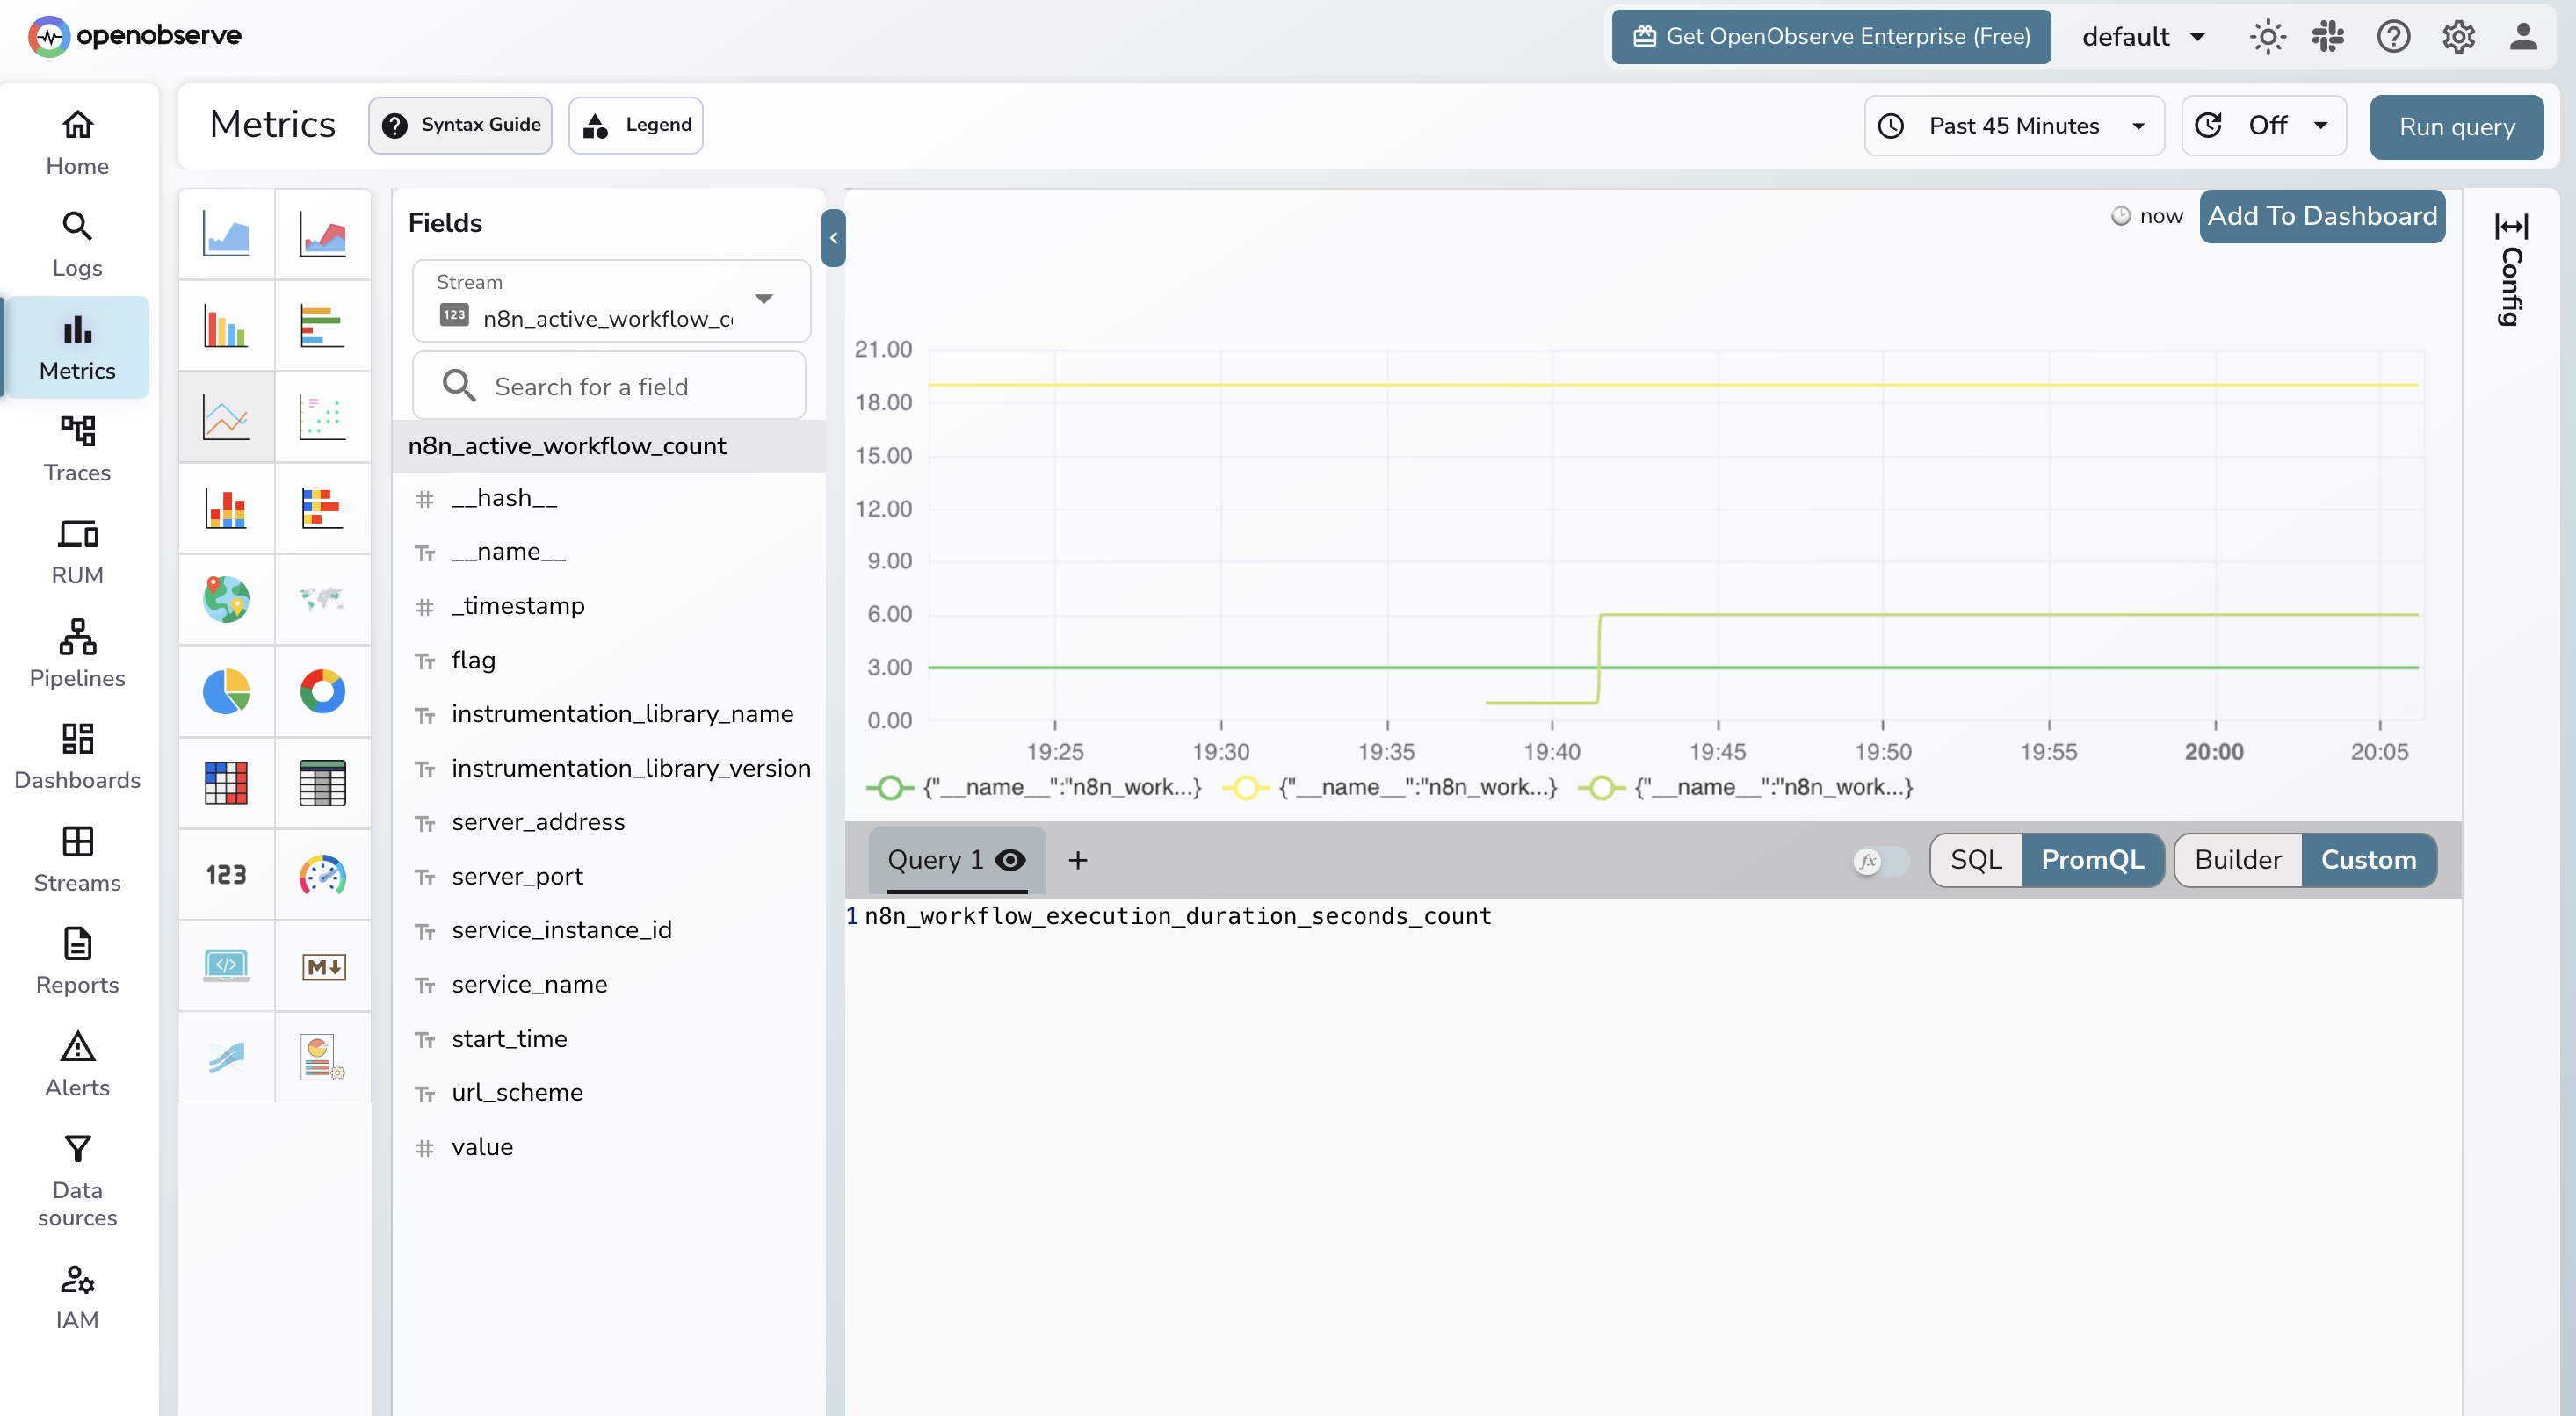
In Metrics, n8n_workflow_execution_duration_seconds_count broken down by status gives you success and failure counts. n8n_workflow_execution_duration_seconds_bucket gives you p50/p95/p99 latency histograms. n8n_scaling_mode_queue_jobs_waiting shows whether your worker queue is building up.
In Traces, each workflow execution appears as a root span with child spans for individual nodes. For workflows calling external services, the outbound HTTP spans appear under the relevant node span, showing exactly how long the downstream call took.
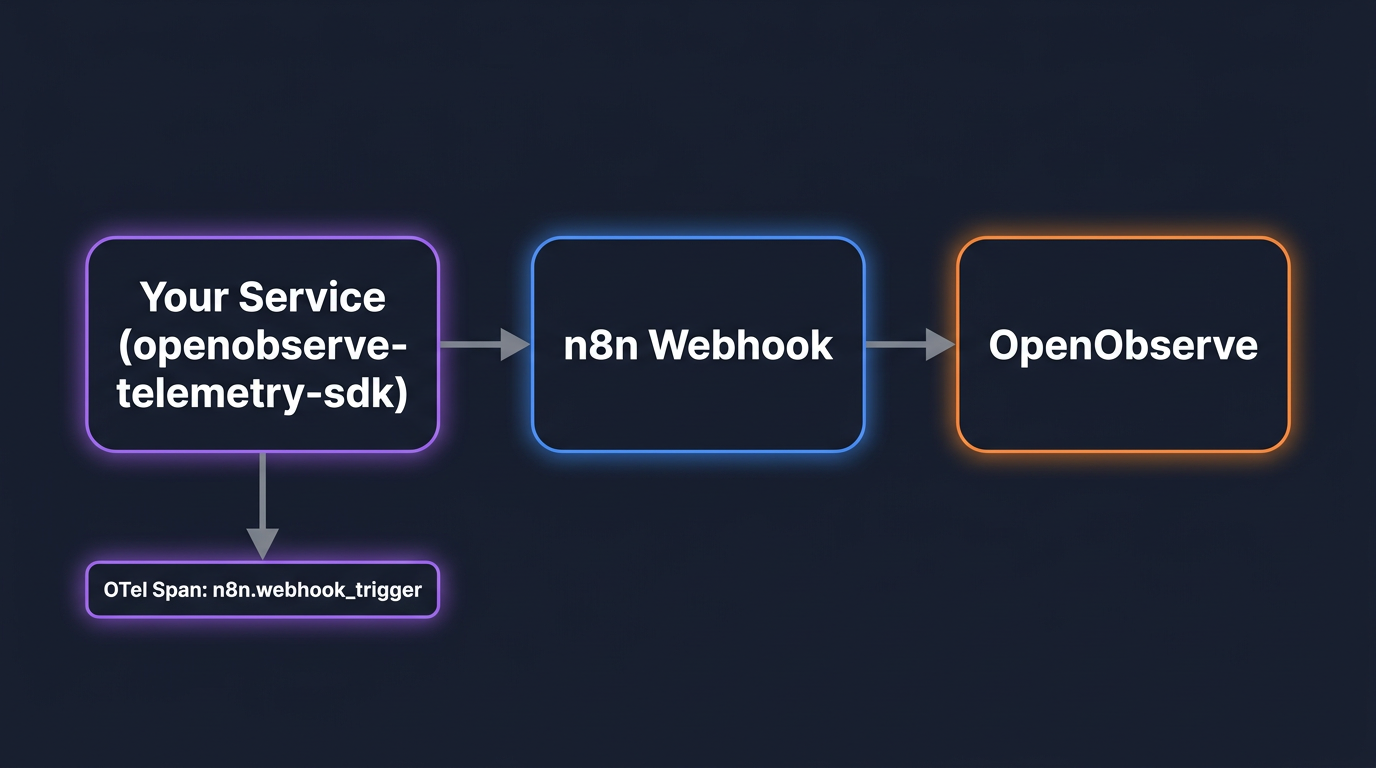
Whether you use n8n Cloud or self-hosted, any service that triggers n8n via webhooks can be instrumented independently using the openobserve-telemetry-sdk. This gives you traces on every webhook invocation: latency, HTTP status codes, and error details, all in OpenObserve without touching n8n's infrastructure.
This is the approach covered in OpenObserve's official n8n integration guide.
pip install openobserve-telemetry-sdk opentelemetry-api requests python-dotenv
Create a .env file:
OPENOBSERVE_URL=https://api.openobserve.ai/
OPENOBSERVE_ORG=your_org_id
OPENOBSERVE_AUTH_TOKEN=Basic <your_base64_token>
N8N_BASE_URL=http://localhost:5678
N8N_WEBHOOK_ID=your-webhook-path
Get OPENOBSERVE_ORG from the OpenObserve UI under your account settings. The AUTH_TOKEN is your Base64-encoded email:password.
from dotenv import load_dotenv
load_dotenv()

from openobserve import openobserve_init
openobserve_init()

from opentelemetry import trace
import os
import requests

tracer = trace.get_tracer(__name__)

base_url = os.environ.get("N8N_BASE_URL", "http://localhost:5678")
webhook_id = os.environ["N8N_WEBHOOK_ID"]


def trigger_webhook(payload: dict):
    with tracer.start_as_current_span("n8n.webhook_trigger") as span:
        span.set_attribute("n8n.webhook_id", webhook_id)
        span.set_attribute("n8n.payload_keys", str(list(payload.keys())))
        resp = requests.post(
            f"{base_url}/webhook/{webhook_id}",
            headers={"Content-Type": "application/json"},
            json=payload,
            timeout=30,
        )
        span.set_attribute("n8n.status_code", resp.status_code)
        span.set_attribute("span_status", "OK" if resp.ok else "ERROR")
        return resp


result = trigger_webhook({"message": "Hello from my service"})
print(result.status_code, result.text)
openobserve_init() reads the OPENOBSERVE_* env vars and configures the OTel SDK to export directly to OpenObserve. Every call to trigger_webhook produces a span with these attributes:
| Attribute | Value |
|---|---|
n8n.webhook_id |
The webhook path being called |
n8n.payload_keys |
Field names in the request payload |
n8n.status_code |
HTTP response code from n8n |
span_status |
OK or ERROR |
For services that trigger n8n in multiple places, wrap each call site the same way. If your service already uses OpenTelemetry for its own instrumentation, the n8n webhook span becomes a child of the existing trace automatically, giving you end-to-end context from your application into n8n. For a broader look at how OTel context propagation works across services, see What is OpenTelemetry?.
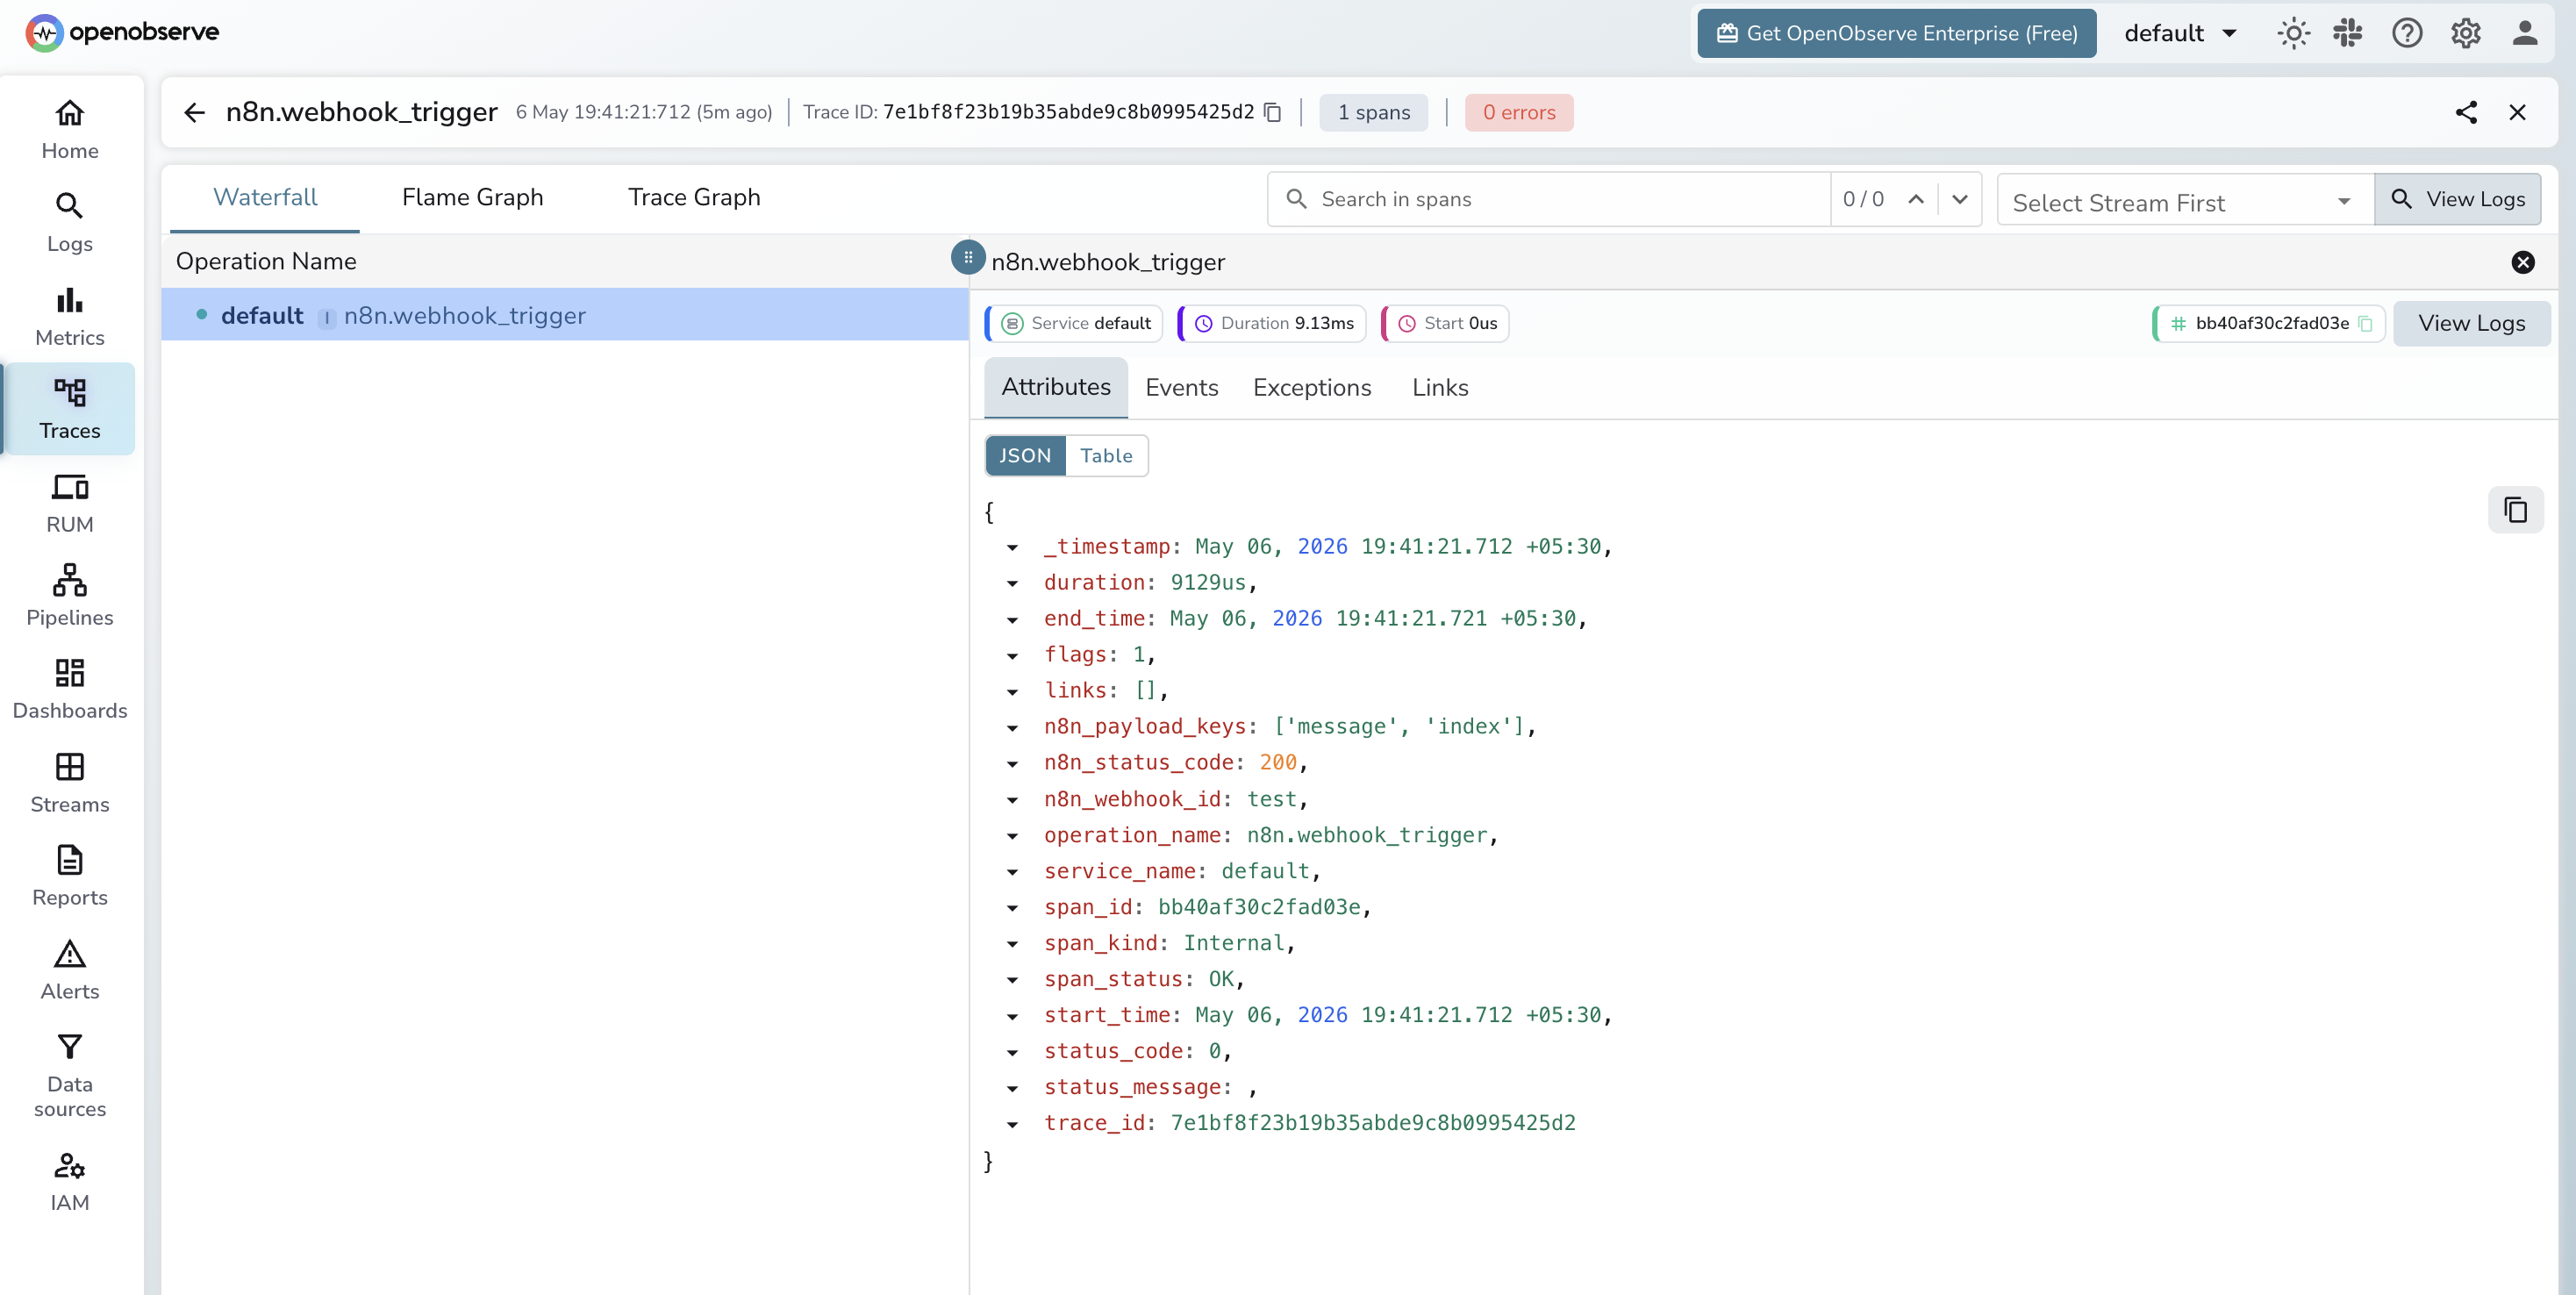
In the Traces explorer, filter by span name n8n.webhook_trigger. You can see latency distribution across all webhook calls, which webhook IDs are failing, and full error messages for non-2xx responses.
This pairs naturally with the self-hosted Prometheus metrics if you run both: metrics show what is happening inside n8n, traces show what your application sees when it calls n8n. For AI workflows, the same SDK and the same pipeline handle LLM observability alongside your workflow traces.
With metrics in OpenObserve, these four signals cover most production failure modes.
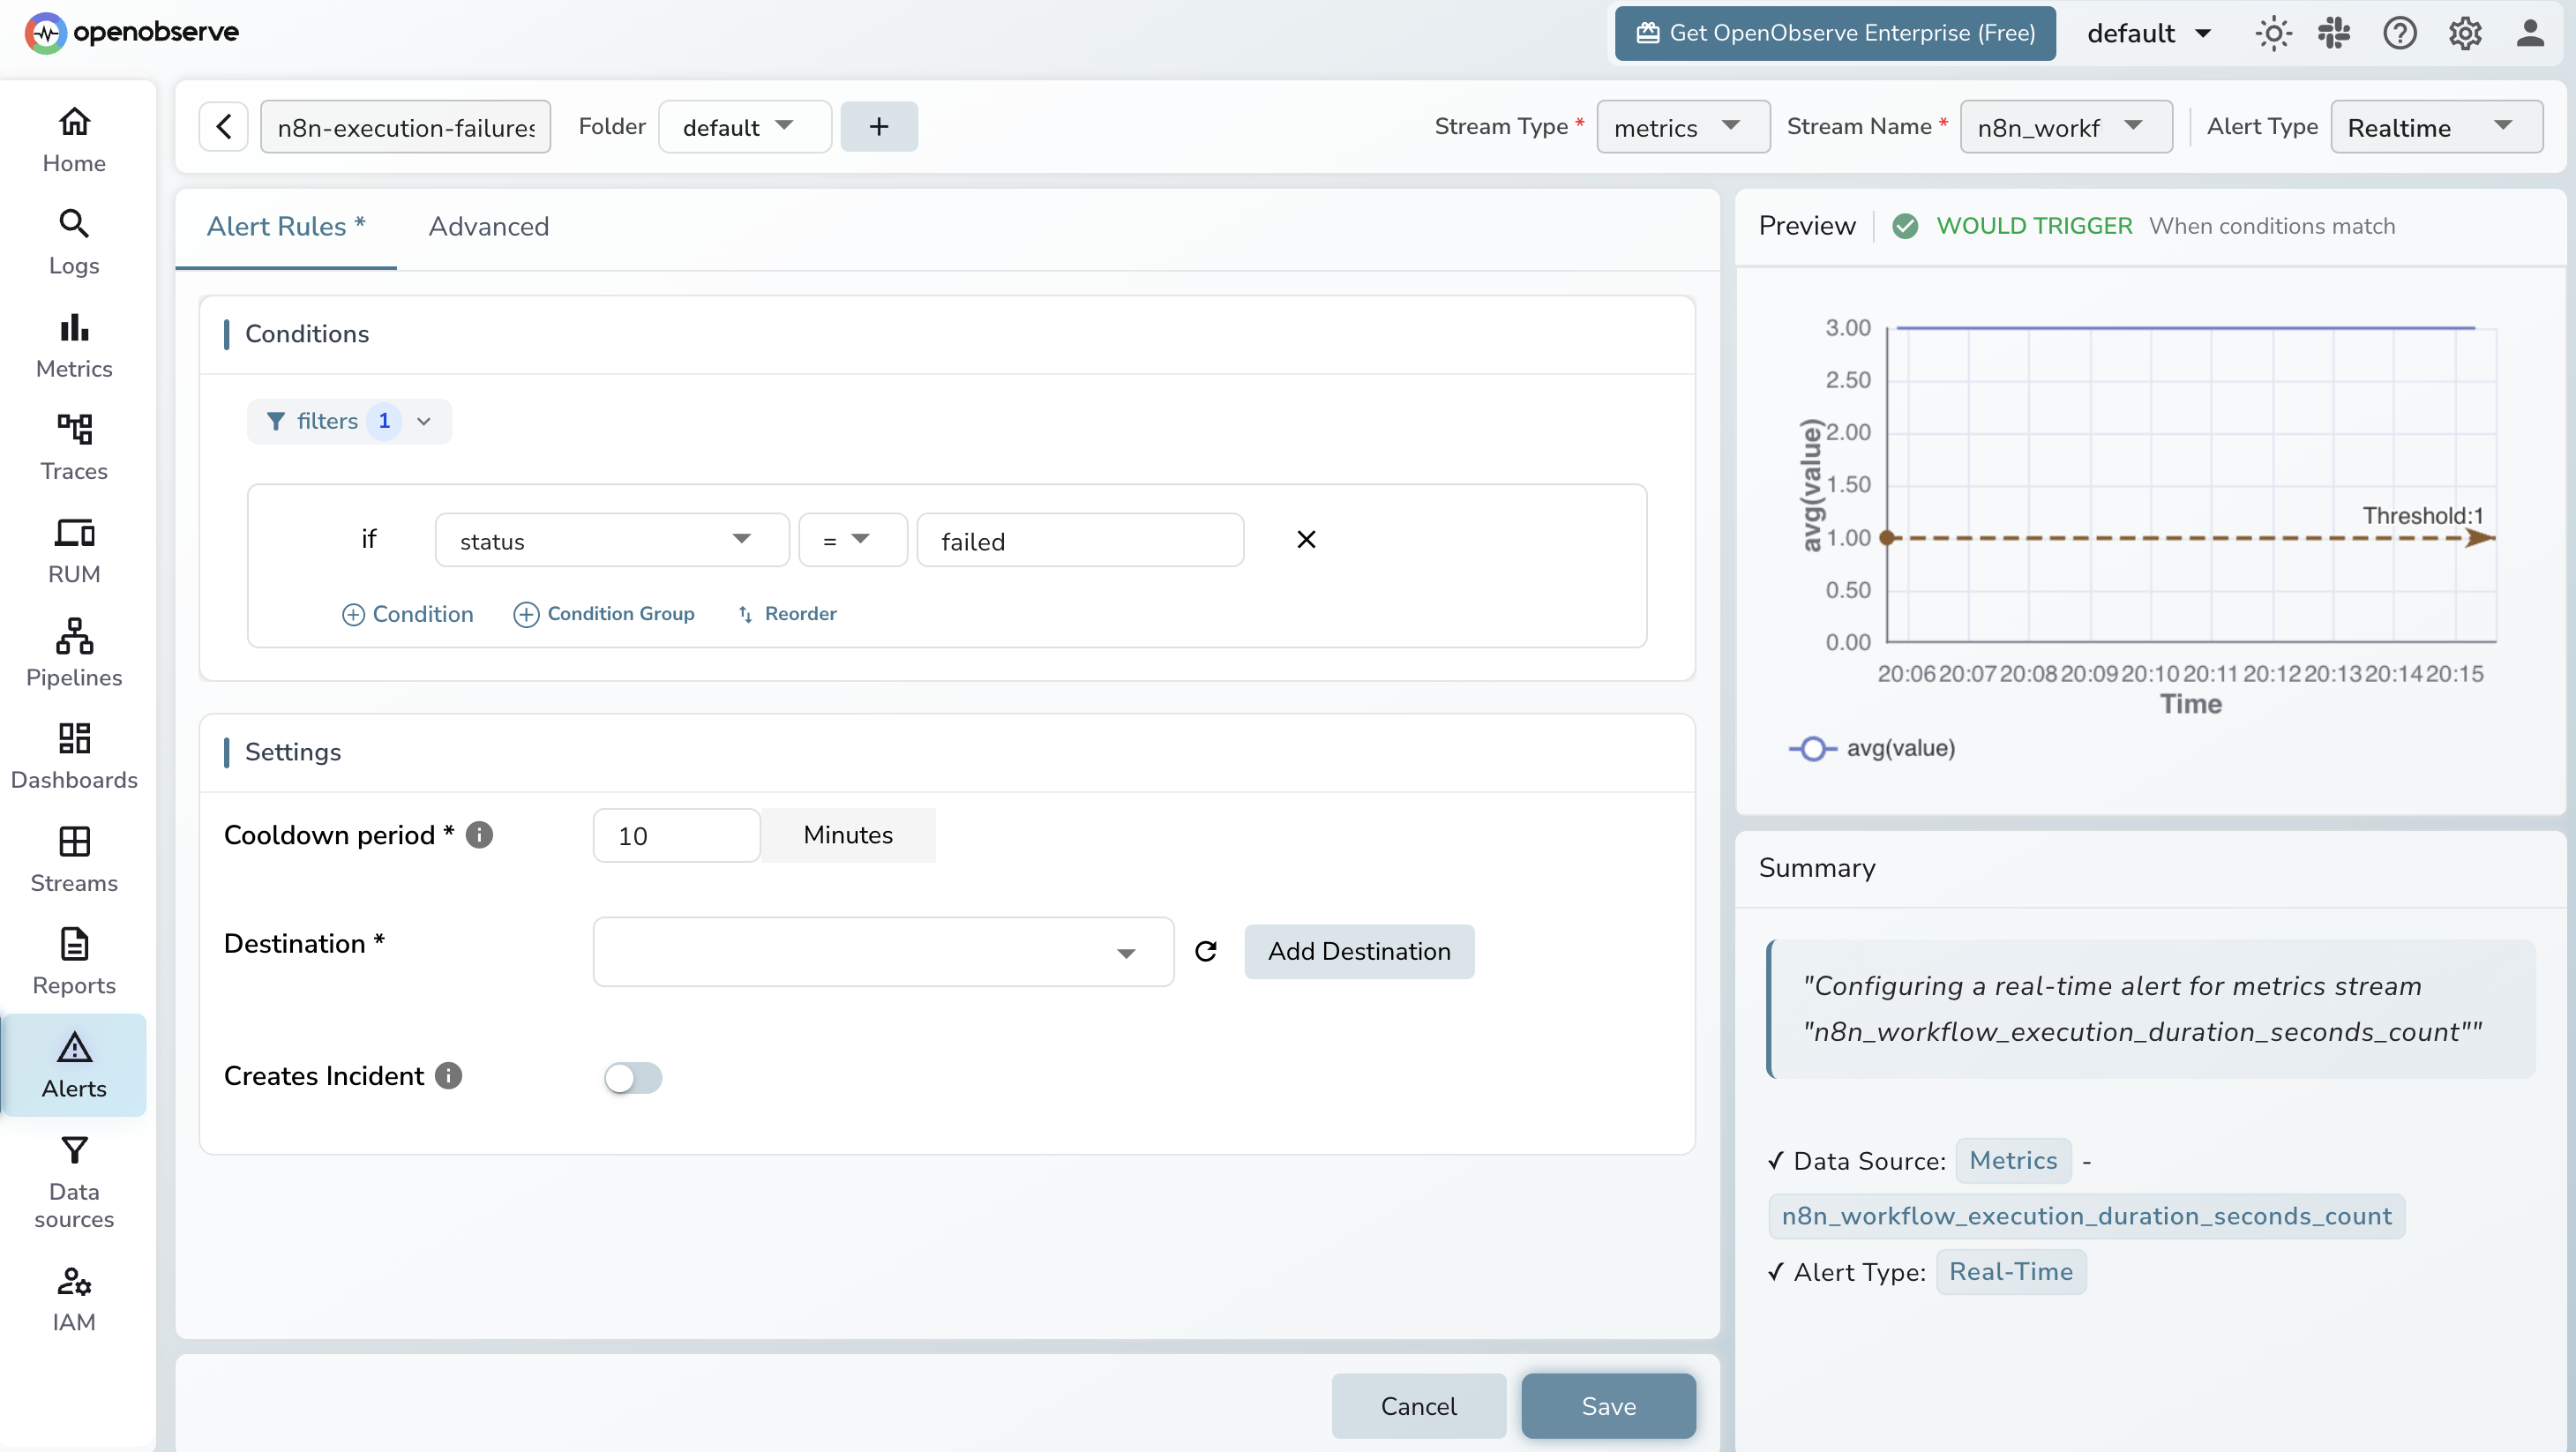
Execution failure rate rising. In OpenObserve, create a scheduled query alert:
rate(n8n_workflow_execution_duration_seconds_count{status="failed"}[5m]) > 0.1
A threshold of 0.1 is roughly 6 failures per minute. Start with > 0 to catch any failure during initial setup, then tune to your baseline.
Execution duration spiking. Track p95 latency using the histogram:
histogram_quantile(0.95, rate(n8n_workflow_execution_duration_seconds_bucket[10m]))
Baseline this over a week of normal operation and alert when it exceeds 2x.
Queue backlog building up. For n8n in worker mode:
n8n_scaling_mode_queue_jobs_waiting > 100
A queue that keeps growing without draining means workers are falling behind. Adjust the threshold to your normal operating depth.
Dead-man alert. Alert when no executions have run in a window where you normally see activity:
rate(n8n_workflow_execution_duration_seconds_count[10m]) == 0
Scope this to your expected active periods. A zero execution rate during a busy window means something has stopped scheduling workflows.
For services using the webhook instrumentation path, add an alert on webhook error rate directly in OpenObserve using the n8n.status_code span attribute. Filter traces where span_status = ERROR and alert when the error count crosses your threshold.
OpenObserve Cloud accepts OTLP over HTTP with no infrastructure to manage. Point your OTel Collector exporter or the openobserve-telemetry-sdk at your cloud endpoint, and n8n metrics and traces start appearing immediately. The free tier covers enough ingestion to get started. Sign up at cloud.openobserve.ai.
Gorakhnath is a passionate developer advocate, working on bridging the gap between developers and the tools they use. He focuses on building communities and creating content that empowers developers to build better software.