How to Replace Elasticsearch for Log Management

Gorakhnath Yadav
May 08, 2026
11 min read
Don’t forget to share!
What Nobody Tells You About Running AI in Production
Try OpenObserve Cloud today for more efficient and performant observability.

TL;DR
filelog receiver is the primary replacement for Filebeat: configure it once, and it handles logs, metrics, and traces in a single agent.
If you're running Elasticsearch for log management at scale, you've probably hit at least one of these: runaway disk usage, shard management that takes more time than the debugging it's supposed to support, or an index that grew a mapping explosion because a single log line introduced a dynamic nested field.
None of those are bugs in Elasticsearch. They're consequences of using a full-text search engine for a workload it wasn't designed for.
For a broader look at how Elasticsearch compares to purpose-built observability tools, see Best Elasticsearch Alternatives 2026.
When Elasticsearch indexes a document, it writes four separate on-disk structures:
_source: the raw JSON blob, stored for retrieval.For a log line with a message string, a timestamp, and a handful of structured fields, you need structures 1 and 3. Structures 2 and 4 are overhead your log queries will rarely touch.
Note: A published ClickHouse benchmark on 50 billion OpenTelemetry log rows found Elasticsearch uses 12.01 TiB of disk for a dataset that takes 2.43 TiB in a columnar store: 4.95x more. The benchmark is reproducible and the dataset is public.
Log workloads in Elasticsearch mean owning index lifecycle management: when to roll over an index, how large to let shards grow, when to move data to warm or cold tiers, when to delete. Get the shard size wrong (too small and you get too many small shards dragging query coordination; too large and recovery after a node failure becomes slow) and query performance degrades.
Mapping explosions are the other common failure mode. A single log line with a dynamic nested field adds field mappings to the index. At high ingestion rates and varied log sources, this grows into Elasticsearch's mapping limit, which requires a reindex to resolve. Reindexing at log volumes is not a fast operation.
Beyond disk, Elasticsearch's JVM heap requirements scale with the dataset. A JVM-based architecture means garbage collection pauses, which surface as ingestion latency spikes at exactly the moments you most need fast log access. For large log workloads, running a healthy Elasticsearch cluster typically requires dedicated ops time that has nothing to do with the systems you're monitoring.
Before changing any configuration, be clear about scope.
You are migrating the shipper output. Wherever Filebeat, Logstash, or another forwarder writes to an Elasticsearch output block, you are replacing that output block. Everything upstream stays: log file paths, parsing rules, filters, tags.
OTel Collector or Fluent Bit?
Use the table below to decide:
| OpenTelemetry Collector | Fluent Bit | |
|---|---|---|
| Already in your environment | Probably not | Common in Kubernetes |
| Handles logs + metrics + traces | Yes, single agent | Logs, metrics, and traces (v3.x+) |
| Best for | New pipelines, full OTel adoption | Existing deployments, K8s DaemonSets |
| Config format | YAML (receivers/processors/exporters) | INI sections |
If you're already running Fluent Bit and it's working, skip to Option 2. If you're starting fresh or want a single agent for all telemetry, start with Option 1.
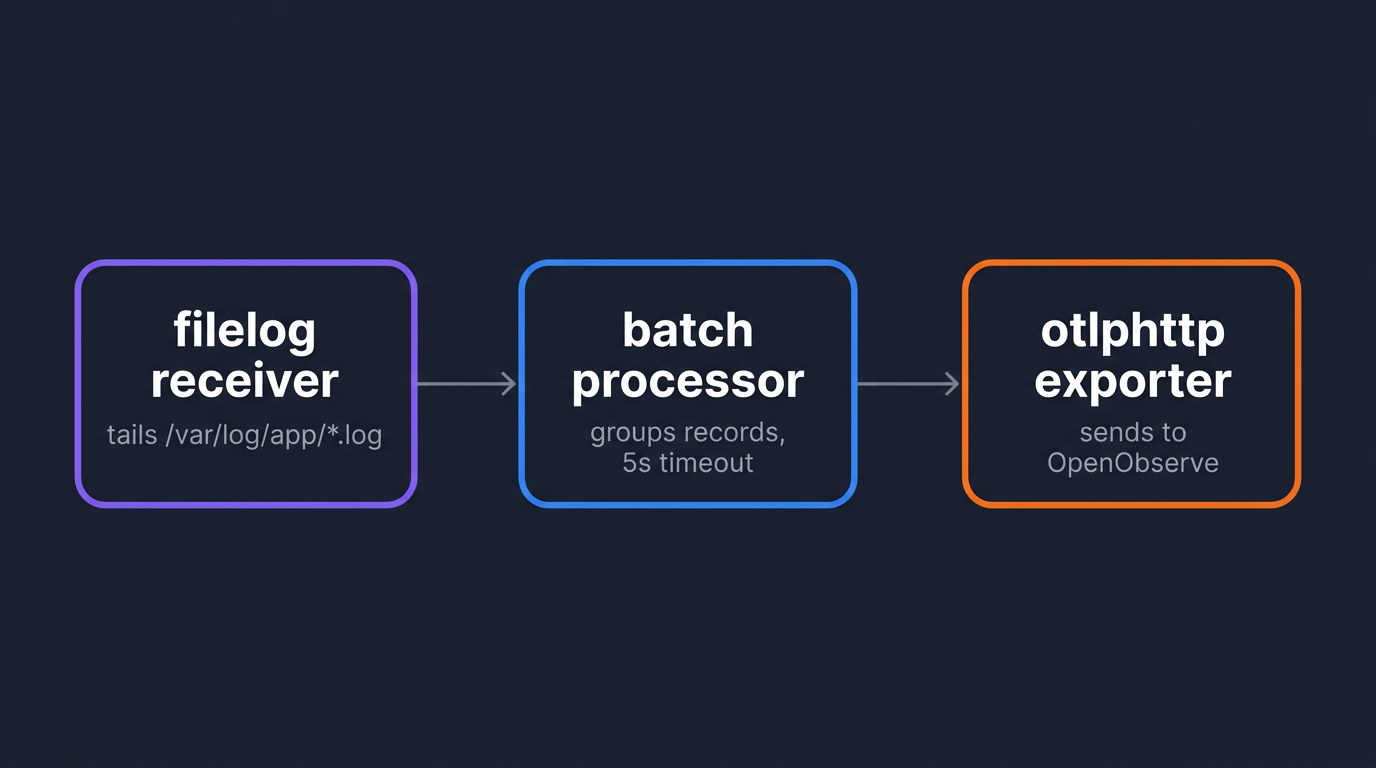
The OTel Collector's filelog receiver tails log files and forwards them over OTLP to any compatible backend. It is a direct functional replacement for Filebeat. OpenObserve is OTel-native and accepts OTLP/HTTP directly.
If you're new to the Collector's data model, Understanding OpenTelemetry Logging covers how log records map to OTel's log data model. For a full breakdown of the contrib distribution's components, see OpenTelemetry Collector Contrib: Complete Guide.
The contrib distribution includes the filelog receiver, which is not in the core distribution.
# Linux amd64
VERSION=0.151.0
wget "https://github.com/open-telemetry/opentelemetry-collector-releases/releases/download/v${VERSION}/otelcol-contrib_${VERSION}_linux_amd64.tar.gz"
tar -xzf "otelcol-contrib_${VERSION}_linux_amd64.tar.gz"
sudo mv otelcol-contrib /usr/local/bin/otelcol
0.151.0 was the latest release at time of writing; check the OTel Collector releases page for newer versions.
Verify the install:
otelcol --version
Create /etc/otelcol/config.yaml:
receivers:
  filelog:
    include:
      - /var/log/app/*.log
    start_at: end
    operators:
      - type: json_parser
        timestamp:
          parse_from: attributes.time
          layout: "%Y-%m-%dT%H:%M:%S.%LZ"

processors:
  batch:
    timeout: 5s
    send_batch_size: 1000

exporters:
  otlphttp:
    endpoint: http://localhost:5080/api/default
    headers:
      Authorization: "Basic <base64_encoded_credentials>"

service:
  pipelines:
    logs:
      receivers: [filelog]
      processors: [batch]
      exporters: [otlphttp]
A few things to set for your environment:
localhost:5080 with your OpenObserve host and port. For the Cloud endpoint and credential format, follow the OpenObserve Quickstart, which walks through both self-hosted and Cloud setups end-to-end.default in the endpoint path is the OpenObserve organization name. Change it if you're using a named org.Authorization header is Basic followed by the base64 encoding of email:password.Generate the credential value:
echo -n "user@example.com:your_password" | base64
The start_at: end setting means the Collector begins tailing from the current end of each file. Change it to beginning if you want to catch up on recent logs before the cutover window. For OTLP exporter options including retry behavior, compression, and TLS, see Getting Started with OpenTelemetry OTLP Exporters.
If you're using OpenObserve Cloud instead of self-hosted, only the exporter block changes. Replace it with:
exporters:
  otlphttp:
    endpoint: https://api.openobserve.ai/api/<your_org>
    headers:
      Authorization: "Basic <base64_encoded_credentials>"
The receivers, processors, and service.pipelines blocks stay identical. The exporter still appends /v1/logs automatically, and Cloud terminates TLS for you.
The earlier wget step puts the binary on disk but doesn't start it. systemd is the standard way to run long-lived agents on Linux: it starts the Collector at boot, restarts it on crash, and routes its output to journalctl for inspection. The block below writes a unit file and activates the service.
sudo tee /etc/systemd/system/otelcol.service > /dev/null <<EOF
[Unit]
Description=OpenTelemetry Collector
After=network.target

[Service]
ExecStart=/usr/local/bin/otelcol --config /etc/otelcol/config.yaml
Restart=on-failure
RestartSec=5

[Install]
WantedBy=multi-user.target
EOF

sudo systemctl daemon-reload
sudo systemctl enable otelcol
sudo systemctl start otelcol
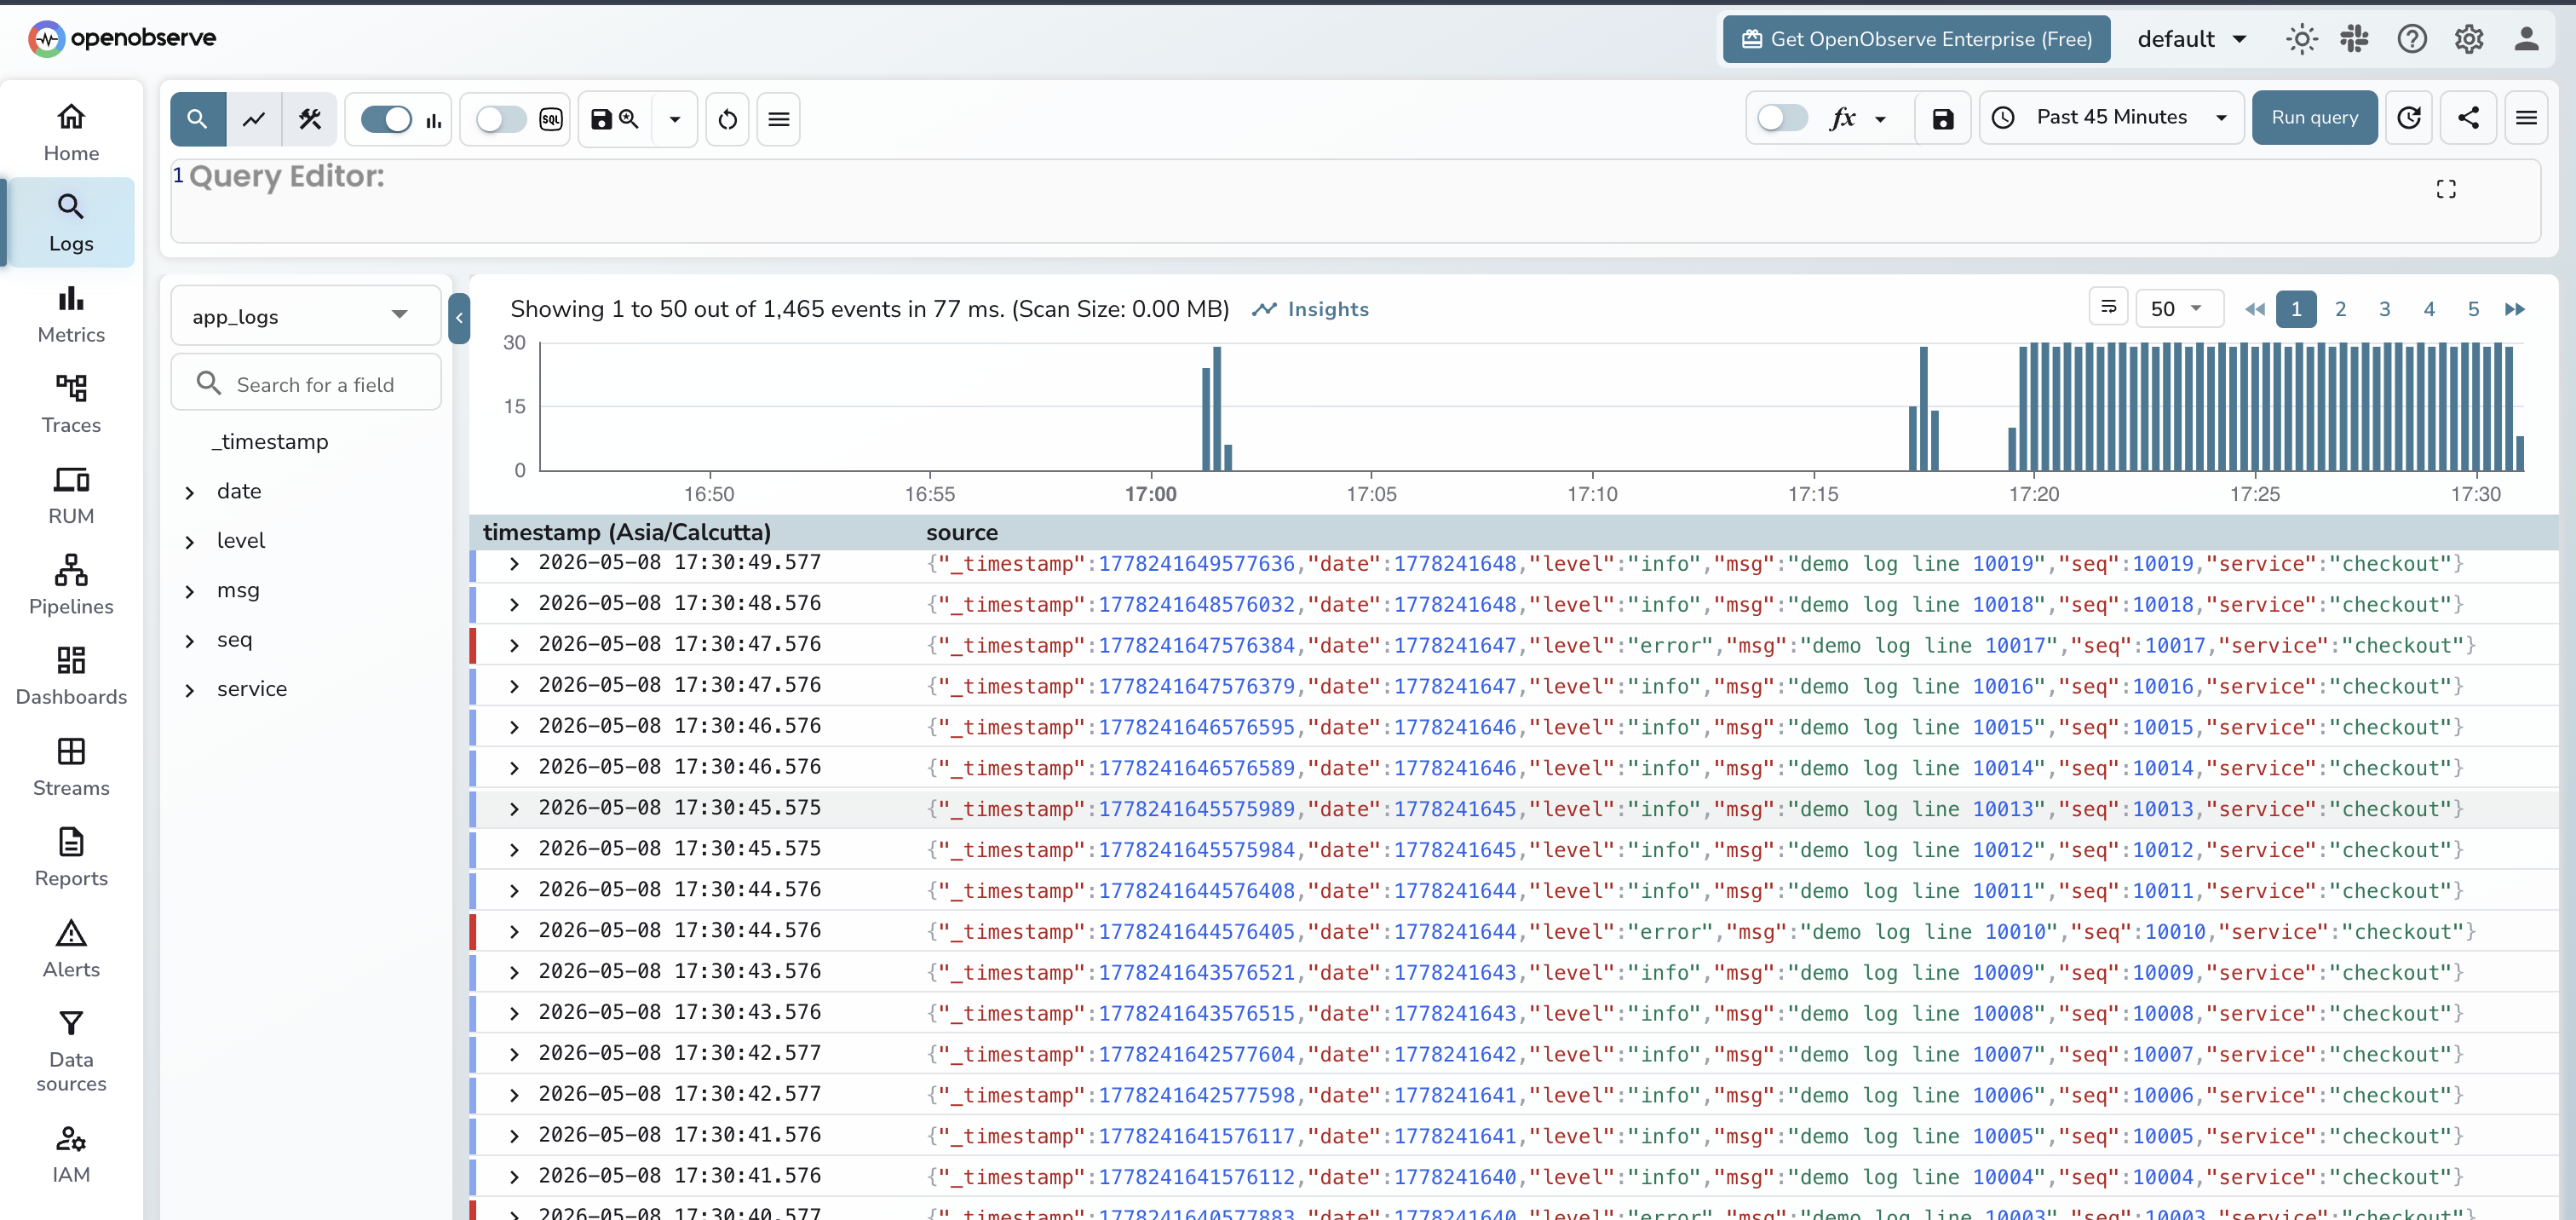
Open the OpenObserve UI, go to Logs, and look for a stream named default (or your service name, if your logs include a service.name resource attribute). Log entries should appear within seconds of the Collector starting. If nothing shows up after a minute, check the Collector output for export errors:
journalctl -u otelcol -f
Common issues: wrong base64 encoding (re-run the echo -n command, the -n flag is required to avoid encoding a trailing newline), wrong org name in the endpoint path, or a firewall blocking port 5080.
If Fluent Bit is already deployed and collecting logs, the migration is a single output block change. Everything upstream (inputs, parsers, filters, tags) stays untouched.
For a clean Fluent Bit setup from scratch on Ubuntu, see Setup Fluent Bit on Ubuntu for Efficient Log Forwarding.
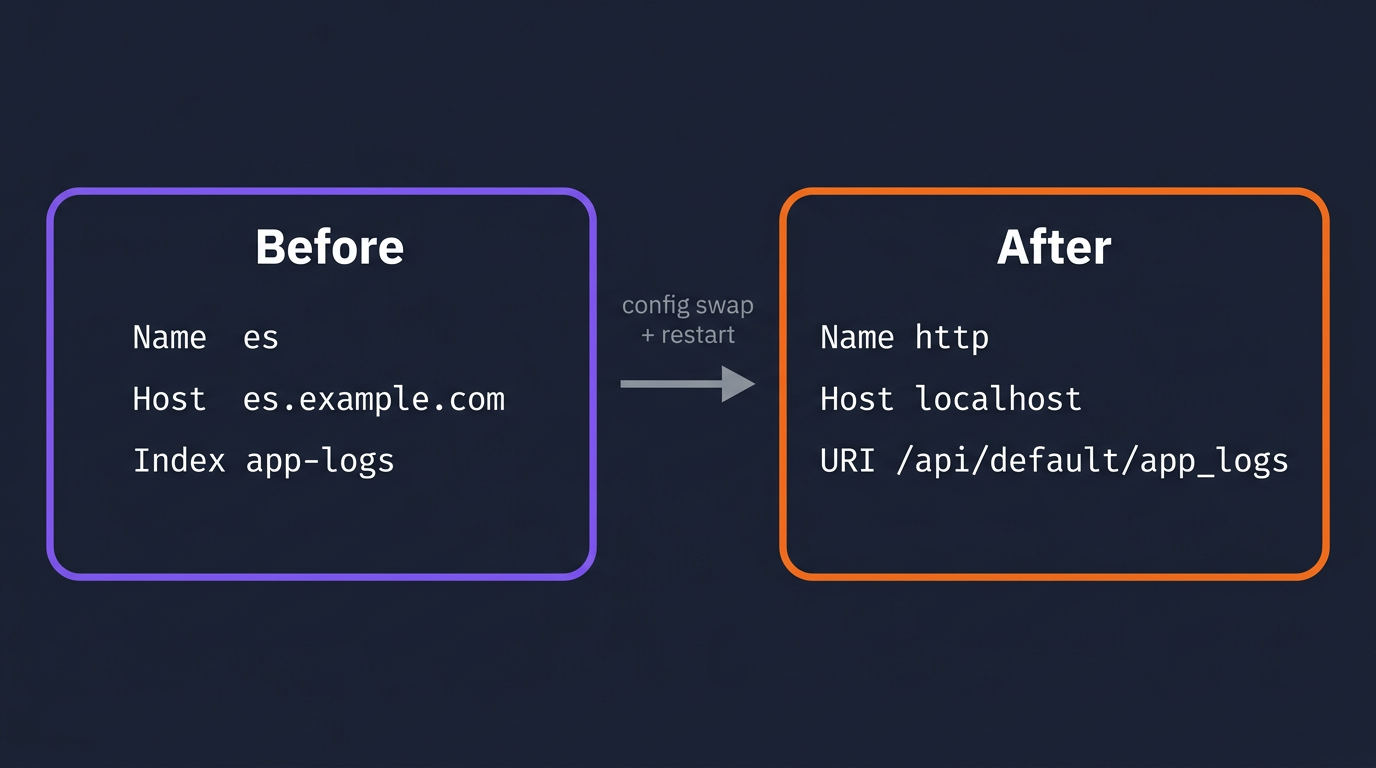
A typical existing Fluent Bit config writing to Elasticsearch:
[OUTPUT]
    Name           es
    Match          *
    Host           elasticsearch.example.com
    Port           9200
    Index          app-logs
    Type           _doc
Replace it with OpenObserve's HTTP output:
[OUTPUT]
    Name           http
    Match          *
    Host           localhost
    Port           5080
    URI            /api/default/app_logs/_json
    Format         json
    Http_User      user@example.com
    Http_Passwd    your_password
    tls            Off
The URI path follows the pattern /api/<org>/<stream_name>/_json. The stream app_logs is created automatically in OpenObserve on first ingest. No schema definition required.
For OpenObserve Cloud, the same [OUTPUT] http block uses the Cloud host on TLS:
[OUTPUT]
    Name         http
    Match        *
    Host         api.openobserve.ai
    Port         443
    URI          /api/<your_org>/<stream_name>/_json
    Format       json
    Http_User    <your_cloud_email>
    Http_Passwd  <your_cloud_password>
    tls          On
Compared to the self-hosted block: Host points at the Cloud ingest host, Port is 443, and tls is On. The URI keeps the same shape (/api/<org>/<stream_name>/_json) but uses your Cloud organization in place of default. Auth still uses Http_User / Http_Passwd, just with your Cloud credentials.
Full fluent-bit.conf with input included, for reference:
[SERVICE]
    Flush        1
    Log_Level    info
    Parsers_File parsers.conf

[INPUT]
    Name         tail
    Path         /var/log/app/*.log
    Tag          app.logs
    Parser       json
    DB           /var/log/flb_app.db

[OUTPUT]
    Name         http
    Match        *
    Host         localhost
    Port         5080
    URI          /api/default/app_logs/_json
    Format       json
    Http_User    user@example.com
    Http_Passwd  your_password
    tls          Off
The DB field in the [INPUT] section persists the file read position across Fluent Bit restarts. Keep it if it was already in your config.
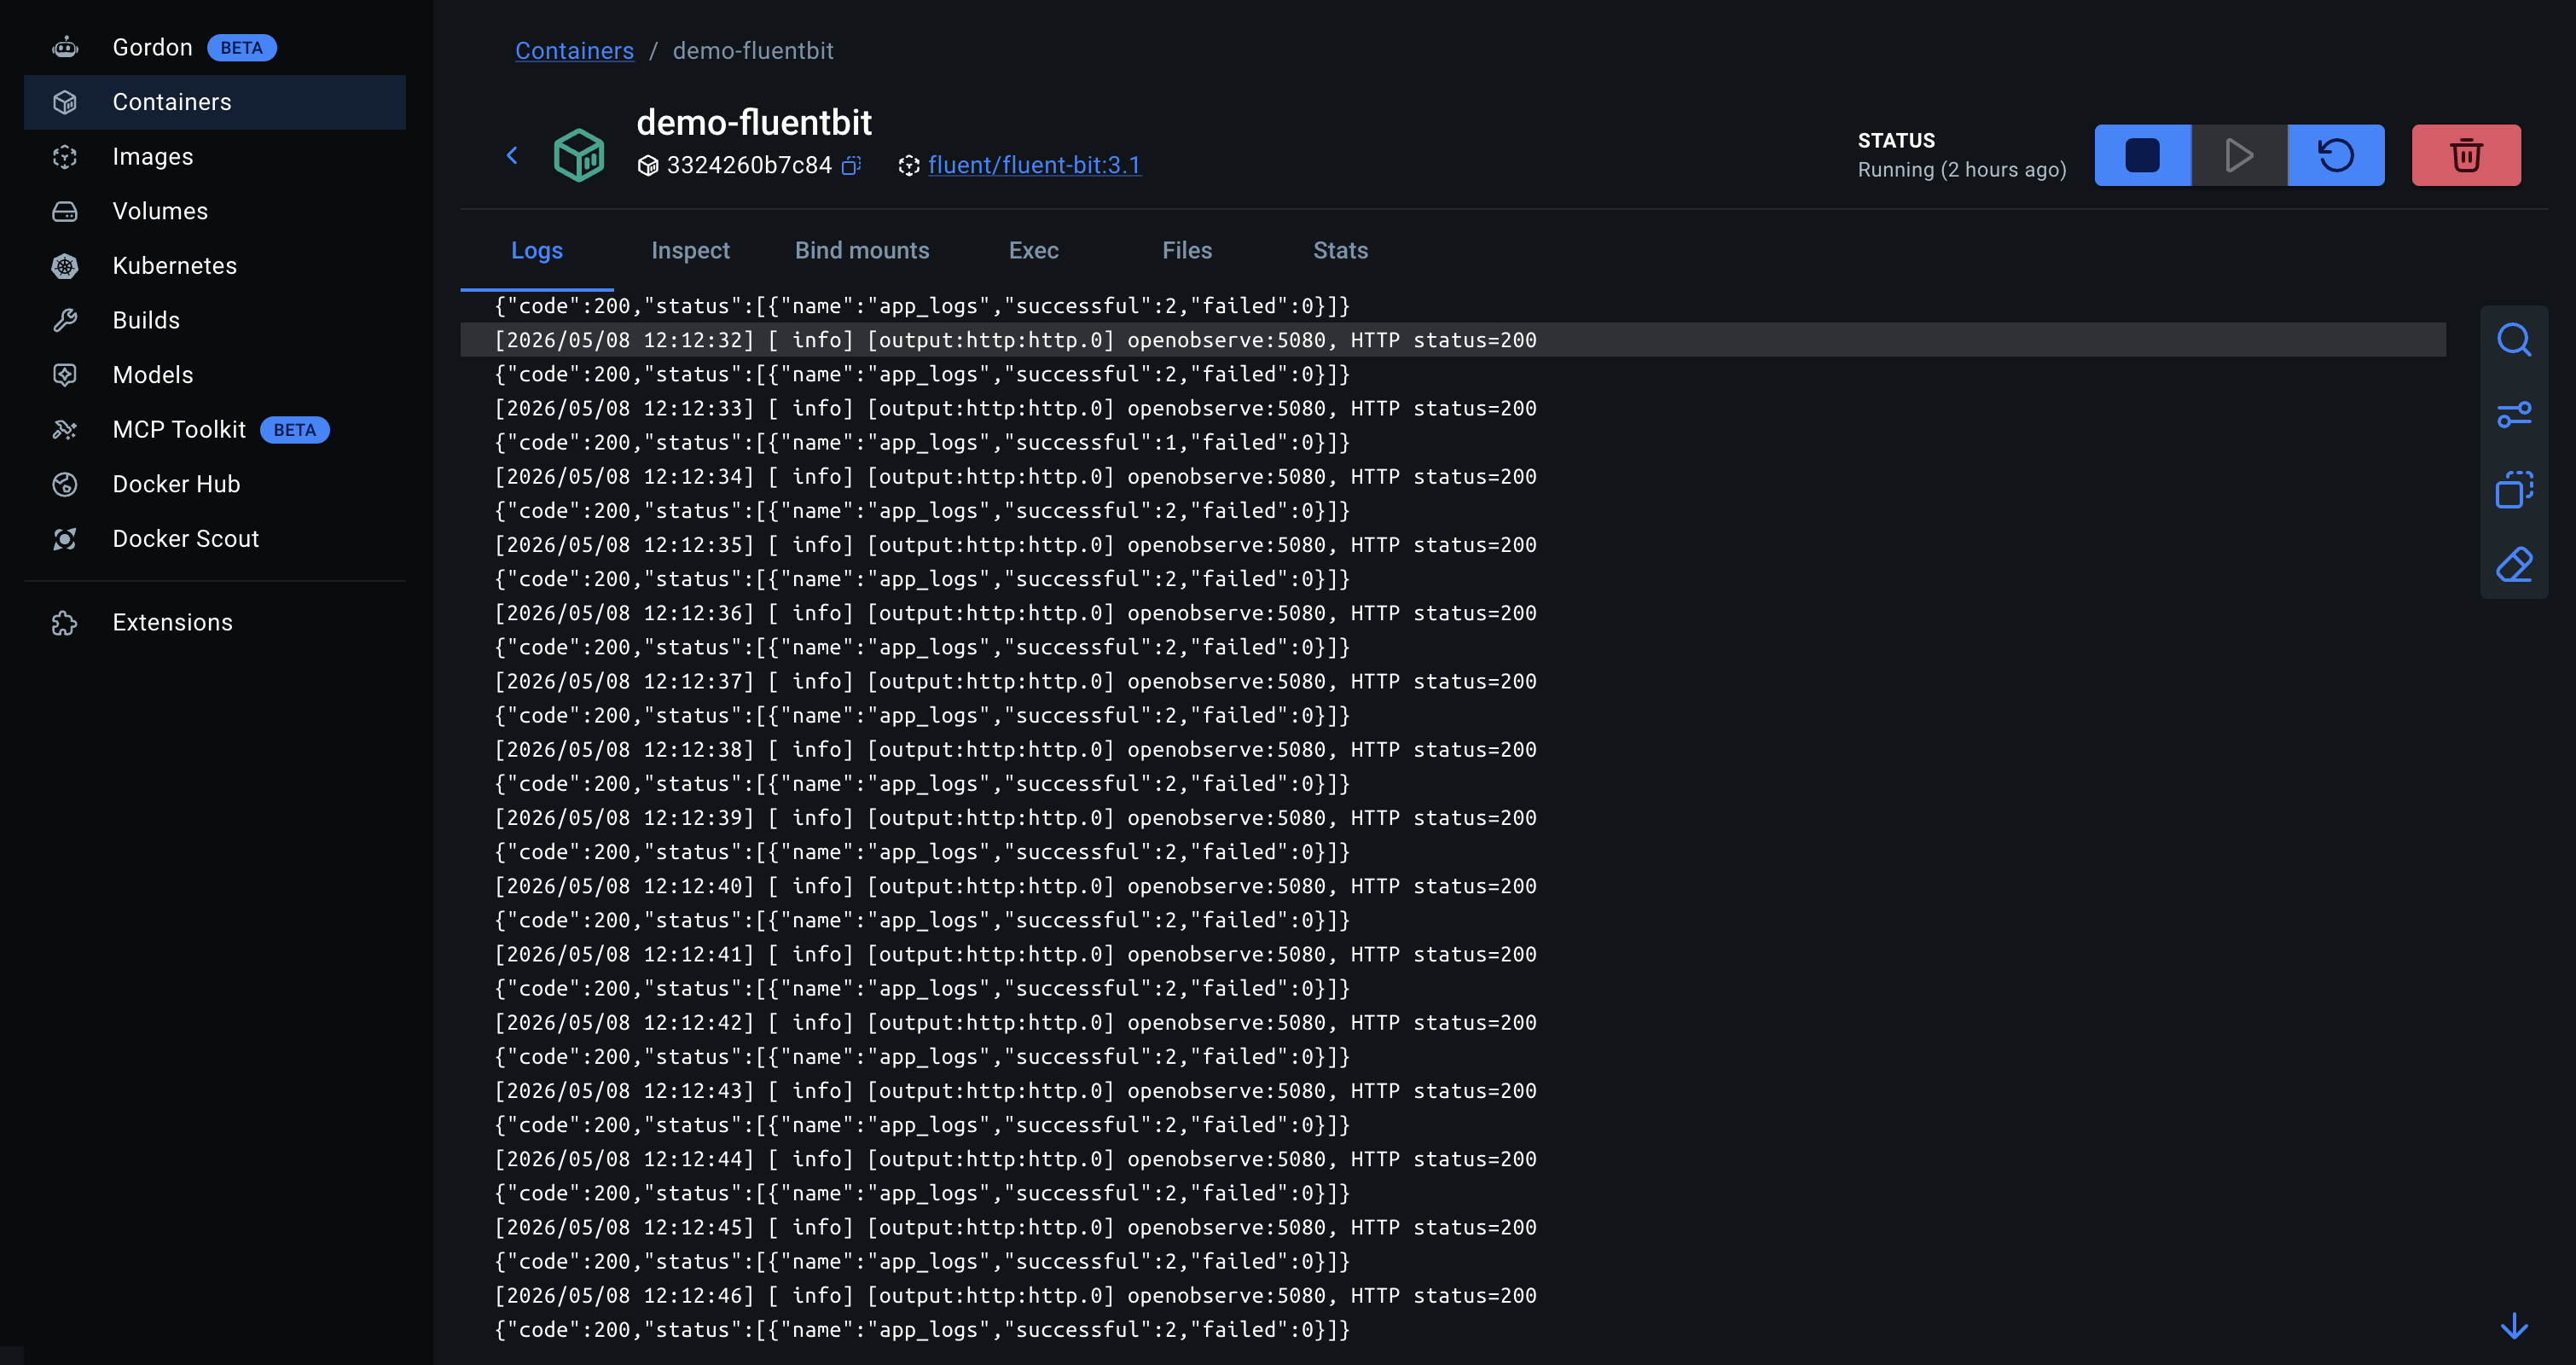
Restart Fluent Bit and check the OpenObserve Logs UI the same way as with the Collector. To see Fluent Bit's output plugin activity in real time:
sudo systemctl restart fluent-bit
journalctl -u fluent-bit -f
Look for lines showing HTTP 200 responses from OpenObserve. A non-200 response with a JSON body will include OpenObserve's error message.
In Kubernetes, both agents run as a DaemonSet so every node ships its own container logs.
For Fluent Bit, you're updating the ConfigMap that holds fluent-bit.conf, replacing the [OUTPUT] section as shown above. The DaemonSet spec and container image don't change. See Kubernetes Logs with Fluent Bit and OpenObserve for a complete DaemonSet manifest including RBAC and the ConfigMap structure.
For the OTel Collector in Kubernetes, use the OpenTelemetry Operator to manage the Collector as a DaemonSet. The processors, exporters, and service.pipelines blocks stay identical to the VM setup above; the Operator handles mounting the config as a ConfigMap and managing pod lifecycle. The filelog receiver itself needs one Kubernetes-specific change: use the container log paths and the container operator, which handles Docker and containerd log format parsing automatically.
receivers:
  filelog:
    include:
      - /var/log/pods/*/*/*.log
    include_file_path: true
    operators:
      - type: container
The container operator extracts the container name, pod name, and namespace from the log path and adds them as log record attributes. No separate parsing step needed.
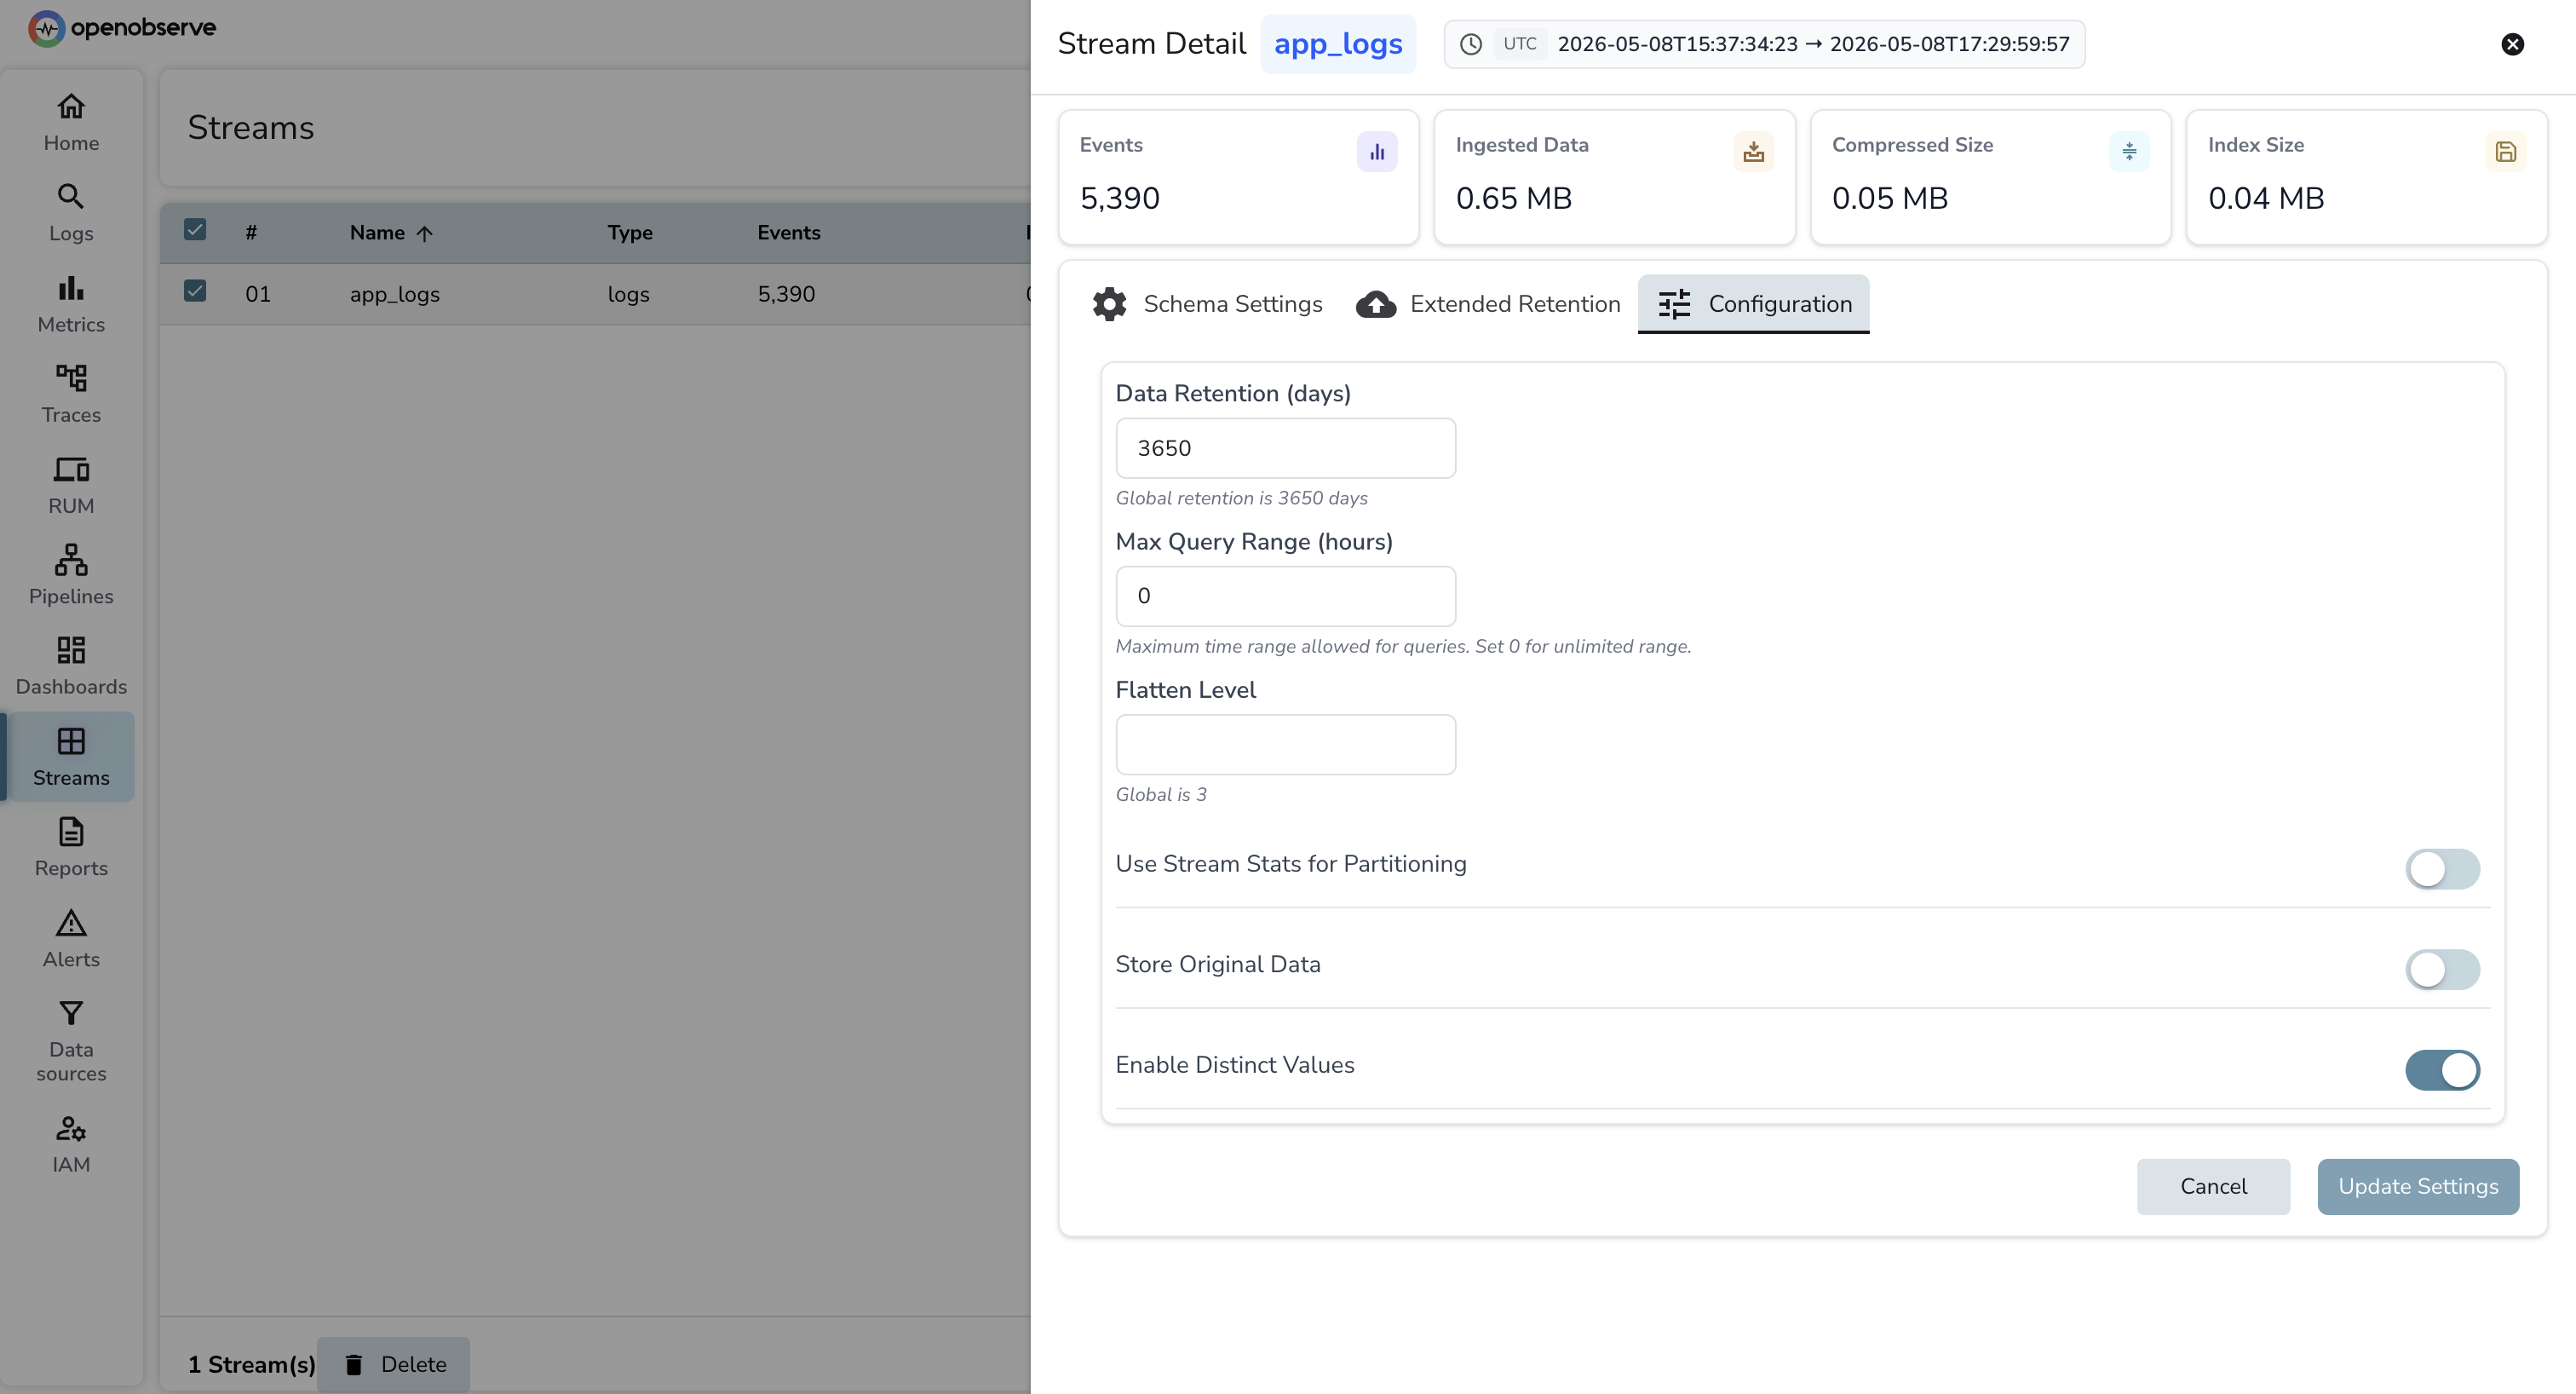
Streams instead of indices. OpenObserve uses streams instead of indices. A stream is created automatically when the first log line arrives at a new URI path or stream name. There is no mapping to define, no shard count to set, and no ILM policy to write. Retention is one field at the stream level.
SQL instead of Elasticsearch DSL. Queries in OpenObserve are SQL. The equivalent of a bool filter with a must clause and a terms aggregation is a WHERE clause and a GROUP BY. If your team writes Kibana queries today, the adjustment is short. OpenObserve also has a quick filter bar for common field lookups that doesn't require SQL.
Log parsing with VRL. OpenObserve uses VRL (Vector Remap Language) for in-platform log parsing and transformation. Grok patterns from Logstash pipelines translate to VRL parse_grok() calls. See How Log Parsing Works in OpenObserve for the full reference on parsers, conditional routing, and field manipulation.
OpenObserve Cloud is the hosted version of OpenObserve. No cluster to provision, no disk to manage, no shard alerts at 2am. The Cloud variants of both shipper configs are shown earlier in this post (under each option's "Pointing... at OpenObserve Cloud" subsection), so the cutover is the same workflow with a different destination.
Current ingestion limits and pricing are at openobserve.ai/pricing.
Gorakhnath is a passionate developer advocate, working on bridging the gap between developers and the tools they use. He focuses on building communities and creating content that empowers developers to build better software.


