The On-Call Runbook Template That Actually Helps at 3AM

Manas Sharma
May 06, 2026
13 min read
Don’t forget to share!
What Nobody Tells You About Running AI in Production
Try OpenObserve Cloud today for more efficient and performant observability.
Most runbooks fail the moment they're needed. They say things like "check the dashboard" or "look at the logs" — which is useless when you're half-asleep, the alert description says nothing useful, and you have five minutes before the incident escalates.
A good runbook tells you: what to check first, what the blast radius looks like, how to communicate status, and when to escalate. A bad one was written by someone who never used it under pressure.
This post gives you a practical on-call runbook template built for SREs and on-call engineers who actually get paged. It includes a 5-phase response framework, a first-5-minutes checklist, and a new approach: using AI to query your production data in natural language while on call.
Let's be honest about what a typical runbook looks like in production:
Alert: High latency on checkout service
1. Check the dashboard
2. Look at the logs for errors
3. If no errors found, escalate to infra team
This runbook has three problems. First, it assumes you know which dashboard to check — when the dashboard URL was changed three months ago and nobody updated the link. Second, "look at the logs" means writing a SQL or PromQL query from scratch while someone is paging you asking for an update. Third, it escalates responsibility without telling you how to rule out the obvious causes first.
The root issue: most runbooks are written during calm business hours by someone who knows the system well. They're never tested under actual incident conditions. And they're never updated after the incident is resolved.
What a 3AM-ready runbook looks like instead:
In short: runbooks should be written as if the reader is tired, stressed, and has never seen this alert before. Because at 3AM, that's exactly who the reader is. If you're evaluating the broader toolchain, our roundup of SRE tools covers what else belongs in your on-call stack.
Every runbook should follow a consistent structure. Here's the framework we've tested across hundreds of incidents — it works whether you're responding to a latency spike, a spike in 500s, or a complete outage.
Before you touch anything, answer these questions:
Now determine who is affected and whether it's getting worse:
This is where most runbooks break down because they assume you know exactly what to query. Good runbooks pre-populate this:
With the OpenObserve MCP server, you can skip writing these queries from scratch. More on this in section 4. For a deeper dive into correlating signals across services during incidents, see our guide on incident correlation.
The goal is to stop the bleeding, not to fully understand the root cause:
Document the three most common fixes for this service directly in the runbook. If the fix is "restart the service," write the exact kubectl command.
Bad communication makes incidents worse. Good communication buys you time to fix the problem:
Include actual message templates in the runbook. When you're responding to an incident, you shouldn't be composing Slack messages from scratch.
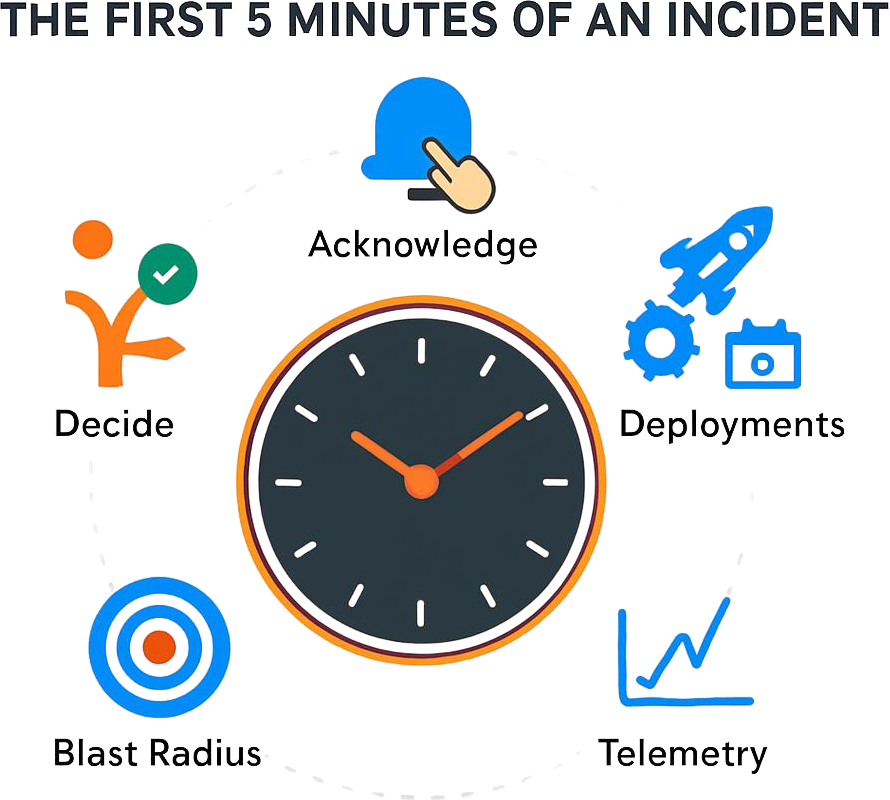
The first five minutes of an incident determine the next five hours. This checklist belongs at the very top of every runbook, above even the alert description. It should take less than a minute to read and the remaining four minutes to act on.
First 5 Minutes Checklist:
Acknowledge the alert — Click "acknowledge" in your alerting platform. If you need two minutes before you can investigate, say so in the on-call channel. Silence is worse than "I'm looking into it."
Check recent deployments — Look at the deployment log for the last 2 hours. Roughly 60-70% of incidents are triggered by a recent change. If something was deployed, flag it immediately.
Check correlated telemetry — Is the error rate rising or flat? Is latency spiking or stable? A flat error rate at 2% is a slow-burn issue; a spiking error rate at 20% and climbing is an active outage. The response is different.
Determine blast radius — One region? One service? One customer? The answer changes your communication: "Checkout is degraded in us-east-1" is very different from "checkout is completely down."
Decide: rollback vs. investigate — If something was deployed in the last 2 hours and the error started right after, roll back first, investigate after. Don't debug in production while users are impacted. If nothing was deployed, start the investigation workflow.
This checklist should be printed large enough that you can read it without your glasses at 3AM. It should be the first thing an on-call engineer sees when an alert fires — not buried in a wiki five clicks deep.
Here's the new capability that changes how runbooks work.
With the OpenObserve MCP server, you can connect Claude Code or Cursor directly to your production observability data. Instead of writing PromQL or SQL at 3AM with one eye open, you ask questions in plain English:
"What errors have spiked in the last 30 minutes?"
"Show me recent deployments correlated with error rate increases."
"Find traces for failed checkout requests and show me which downstream service is failing."
The AI doesn't replace your judgment. You still decide whether to roll back, who to escalate to, and what to communicate. But instead of starting from scratch — figuring out the right query, looking up the stream name, waiting for results, reformulating — you start from page 5 of the investigation.
Here's what that looks like in practice. Let's say the cart service is throwing errors at 2AM. In a traditional workflow, you'd:
With the MCP server connected, you type:
"otel-demo app cart is throwing errors. find the root cause."
The assistant searches across logs and traces simultaneously. It looks for errors in the last six hours, finds none, and automatically widens the search window. It identifies the pattern — cart service failing on database writes under load — and shows you the exact traces, the error distribution, and the failing downstream call.
You can also ask it to lock in the fix:
"alert me if cart error rate crosses 10 errors in 5 minutes."
Or build a dashboard so the team can track the issue:
"create a dashboard for my nginx logs showing request rate, latency percentiles, and 4xx vs 5xx errors."
This doesn't just speed up the investigation. It means your runbooks can now include prompts to ask the AI assistant, alongside the traditional checklist items. That's the bridge between the old way and the new way.
Here's the actual template. Copy it, adapt it for your services, and make sure your on-call team can access it — ideally linked directly from your alert descriptions.
Service Name: [service-name]
| Alert Name | What It Means | Severity | Runbook Link |
|---|---|---|---|
[alert-name] |
[Plain English: "p95 latency > 500ms = users waiting"] | Critical/High | This doc |
[service-name] + [dependent-service-1], [dependent-service-2]| Resource | Link |
|---|---|
| Service Dashboard | [Pre-filtered dashboard URL] |
| Log Stream | [Direct link to log stream for this service] |
| Trace Search | [Direct link to trace search, filtered] |
| Deployment Log | [Link to recent deployments] |
| Kubernetes Dashboard | [Link to pod health for this namespace] |
If you have the OpenObserve MCP server connected, start with these prompts:
"What errors have spiked in [service-name] in the last 30 minutes?"
"Show me traces for failed [service-name] requests and find the failing downstream call."
"Has anything been deployed in the last 2 hours? Check deployment logs."
"Create an alert if [service-name] error rate crosses [threshold] in [window]."
| Order | Who | When to Escalate | Contact |
|---|---|---|---|
| 1st | Primary on-call | — | [Slack/Phone] |
| 2nd | Service owner | If no root cause identified in 15 min | [Slack/Phone] |
| 3rd | Infra lead | If related to DB, network, or infra | [Slack/Phone] |
| 4th | Engineering manager | If blast radius is company-wide or after 30 min | [Slack/Phone] |
Most common fix (try first):
[Exact command or procedure — e.g., "kubectl rollout restart deployment/cartservice -n prod"]
Second most common fix:
[Exact command or procedure — e.g., "Roll back to previous deployment: kubectl rollout undo deployment/cartservice"]
Third most common fix:
[Exact command or procedure — e.g., "Scale up: kubectl scale deployment/cartservice --replicas=6"]
Initial acknowledgment (Slack — post within 2 min):
Acknowledged: [alert name] fired for [service]. Investigating now. Will update in 30 min or sooner if I find the root cause.
Status update (Slack — every 30 min):
Update on [alert name]:
- What we know: [2-3 bullet points]
- What we're investigating: [1-2 things]
- Current impact: [users affected, regions affected]
- Next update: [time]
Resolution (Slack and email):
Resolved: [alert name] for [service] at [time].
- Root cause: [1 sentence]
- What fixed it: [1 sentence]
- Follow-up: Postmortem scheduled for [date/time]. Link: [postmortem doc]
A postmortem should be triggered if:
The sustainability problem: runbooks rot. A runbook written six months ago references dashboards that no longer exist, escalation contacts who left the team, and mitigation steps that don't apply to the new architecture.
The fix is simple but requires discipline: add a runbook review step to every postmortem.
Whoever was on call during the incident updates the runbook with what was actually useful and what was missing. This takes five minutes at the end of a postmortem and prevents the runbook from becoming a historical artifact. Link these two documents together — every runbook should link to its most recent postmortem, and every postmortem template should include a "Was the runbook useful? What should we update?" section.
Runbook documentation never feels urgent until the next incident. Tying it to the postmortem process makes it part of closing the loop rather than a separate, easily deprioritized task.
The on-call experience doesn't have to be terrible. A good runbook gets you from "what is happening" to "I know what to do" in under five minutes. And with the OpenObserve MCP server, you can query your production data in natural language during the investigation — so you spend less time writing queries and more time fixing the problem.
New to OpenObserve? Register for our Getting Started Workshop for a quick walkthrough.
Manas is a passionate Dev and Cloud Advocate with a strong focus on cloud-native technologies, including observability, cloud, kubernetes, and opensource. building bridges between tech and community.


