Why My 3AM Debug Session Takes 2 Hours: Fixing the Logs-Traces-Metrics Correlation Gap

Gorakhnath Yadav
May 11, 2026
12 min read
Don’t forget to share!
Getting Started with OpenObserve
Try OpenObserve Cloud today for more efficient and performant observability.

TLDR
- Logs traces metrics correlation breaks down because the three signals live in different systems with different schemas and no shared identifier by default.
- The fix is a shared
trace_id: inject it into log records, attach it to metrics as exemplars, and propagate it across services with the W3C trace context.- With correlation in place you pivot from a metric alert to the offending trace to the exact log line in seconds, not minutes of tab-switching.
- The hard parts are not in the SDK setup. They are async context loss, sampling mismatch, and log shippers that strip your trace fields.
- One OTel Collector can receive all three signals on one OTLP endpoint and forward them to a single backend like OpenObserve, removing one whole class of glue work.

Pager fires at 2:14 AM. Error rate on the checkout service is up 4x. You open three tabs.
Tab 1 is the APM, showing a P99 latency spike. Tab 2 is the log search, where you start typing the service name and approximate timestamp. Tab 3 is the infrastructure dashboard, because the pod restart graph might tell you something.
Forty-five minutes in, you are still copy-pasting timestamps between tools. The log line you want is in there somewhere, but you cannot map it to the slow trace because the log lines do not have a trace_id and the trace UI does not link to logs. By the time you find the actual stack trace, it is 3:30 AM and the on-call from the next time zone is asking what is going on.
This is not a tooling problem. The tools are fine. It is an architecture problem: the three signals are stored separately and were never wired up to share an identifier.
Metrics are pre-aggregated time series with second or 10-second resolution. Logs are individual events with millisecond timestamps. Traces are nested span trees with their own clock. Joining them on time alone is lossy at any non-trivial QPS, because dozens of unrelated requests share any given millisecond.
Unless you add it, your application logger has no idea a span is active. Your Prometheus histogram observation does not record which request caused the high-latency sample. Your trace exporter writes a trace_id that exists nowhere else in your stack.
A typical default log line looks like this:
2026-05-11T02:14:33.221Z INFO checkout.service order_total=4892 user=92041 action=charge result=declined
Useful, but it does not link to anything. Compare to the same line with trace context:
2026-05-11T02:14:33.221Z INFO checkout.service trace_id=4bf92f3577b34da6a3ce929d0e0e4736 span_id=00f067aa0ba902b7 service.name=checkout order_total=4892 user=92041 action=charge result=declined
The second line is searchable from any of the three tools. That single field is the difference between a guided investigation and a scavenger hunt. For a deeper background on why these three signals exist in the first place, the full-stack observability primer covers the model in more detail.
Every tab switch during an incident along with finding meaningful stuff costs roughly 30-40 seconds of attention. Multiply by the 20 to 40 pivots a typical investigation requires and the math is brutal. Most of your MTTR is not the fix. It is the lookup.
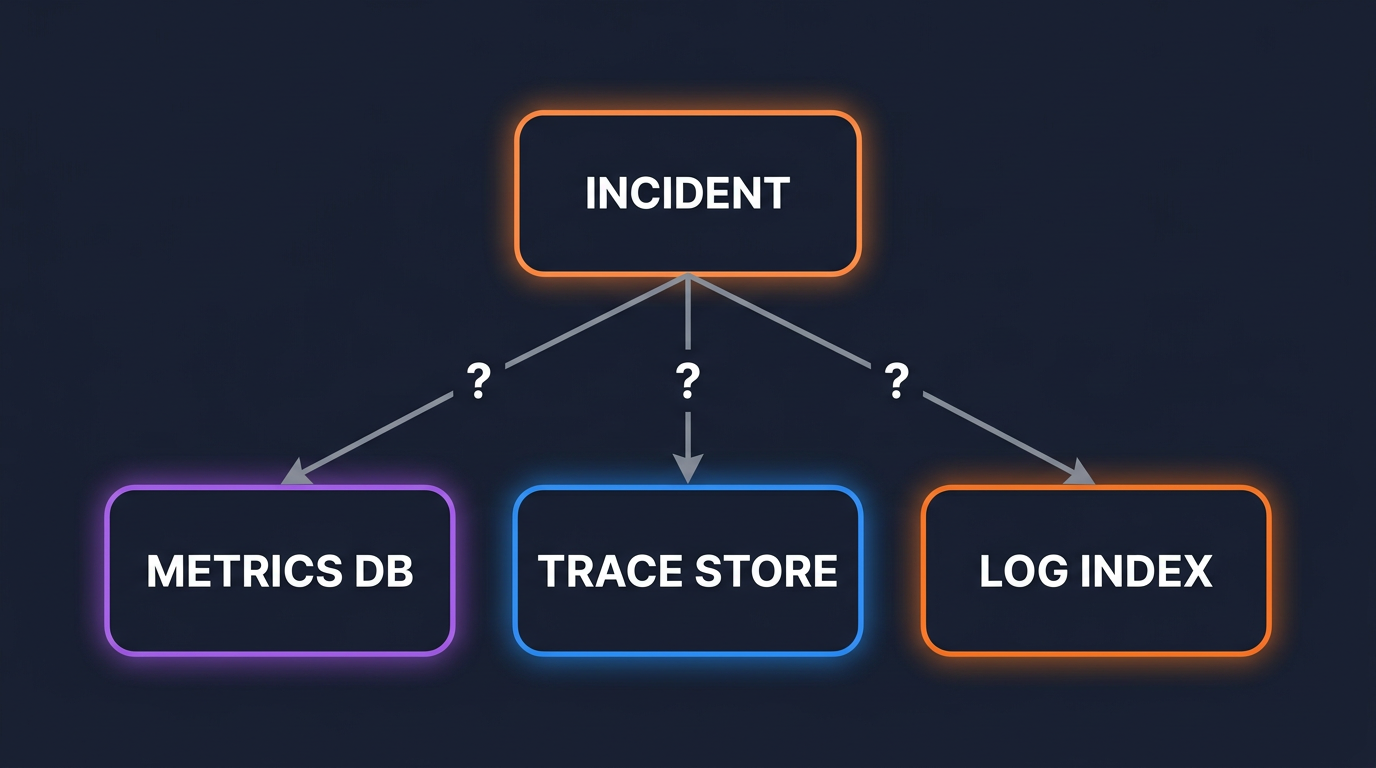
A trace_id is a 16-byte identifier that uniquely names one logical request across every service it touches. Every span inside that request shares the same trace_id and gets its own span_id.
When this ID also lives in your log records and as an exemplar on your metrics, you have correlation. Pivoting becomes a primary key lookup, not a timestamp guess.
OpenTelemetry standardizes the propagation: the W3C traceparent header carries the trace_id and span_id between services, and the OTel SDK exposes them inside any process so a logger or a metrics observation can read them. If you are new to the OTel architecture, the What is OpenTelemetry guide is a useful starting point.
Three things have to be true for correlation to work end to end:
trace_id and span_id.trace_id as an exemplar.The next three sections show how to do each of these in code.
from opentelemetry.instrumentation.logging import LoggingInstrumentor
import logging
import sys

LoggingInstrumentor().instrument(set_logging_format=False)

formatter = logging.Formatter(
    '{"ts":"%(asctime)s","level":"%(levelname)s",'
    '"msg":"%(message)s","trace_id":"%(otelTraceID)s",'
    '"span_id":"%(otelSpanID)s","service":"%(otelServiceName)s"}'
)
handler = logging.StreamHandler(sys.stdout)
handler.setFormatter(formatter)
logging.getLogger().addHandler(handler)
logging.getLogger().setLevel(logging.INFO)
LoggingInstrumentor injects otelTraceID, otelSpanID, and otelServiceName into every LogRecord. When no span is active (startup, scheduled jobs, anything outside a request), it injects the literal string "0" for those fields, so expect trace_id:"0" lines in your index for that traffic. The formatter above writes JSON so any backend can parse the trace fields without grok rules. For a deeper dive, the OpenTelemetry logging guide walks through the LogRecord model.
import pino from "pino";
import { trace, context } from "@opentelemetry/api";

const logger = pino({
  mixin() {
    const span = trace.getSpan(context.active());
    if (!span) return {};
    const { traceId, spanId } = span.spanContext();
    return { trace_id: traceId, span_id: spanId };
  },
});

logger.info({ order_id: 4892 }, "charge declined");
The mixin runs on every log call and pulls the active span out of the OTel context. If no span is active (background work, init code), the fields are simply absent. The Node.js distributed tracing post covers how to make sure a span actually exists across async hops.
package main

import (
    "context"
    "log/slog"
    "os"

    "go.opentelemetry.io/otel/trace"
)

type otelHandler struct{ slog.Handler }

func (h otelHandler) Handle(ctx context.Context, r slog.Record) error {
    if span := trace.SpanFromContext(ctx); span.SpanContext().IsValid() {
        sc := span.SpanContext()
        r.AddAttrs(
            slog.String("trace_id", sc.TraceID().String()),
            slog.String("span_id", sc.SpanID().String()),
        )
    }
    return h.Handler.Handle(ctx, r)
}

func (h otelHandler) WithAttrs(attrs []slog.Attr) slog.Handler {
    return otelHandler{h.Handler.WithAttrs(attrs)}
}

func (h otelHandler) WithGroup(name string) slog.Handler {
    return otelHandler{h.Handler.WithGroup(name)}
}

func main() {
    base := slog.NewJSONHandler(os.Stdout, nil)
    slog.SetDefault(slog.New(otelHandler{base}))
}
The handler wraps the standard library JSON handler and reads the active span from the context. Always pass a context-aware logger call site (slog.InfoContext(ctx, ...)) or the trace fields will not show up. The Go observability post covers the full instrumentation chain.
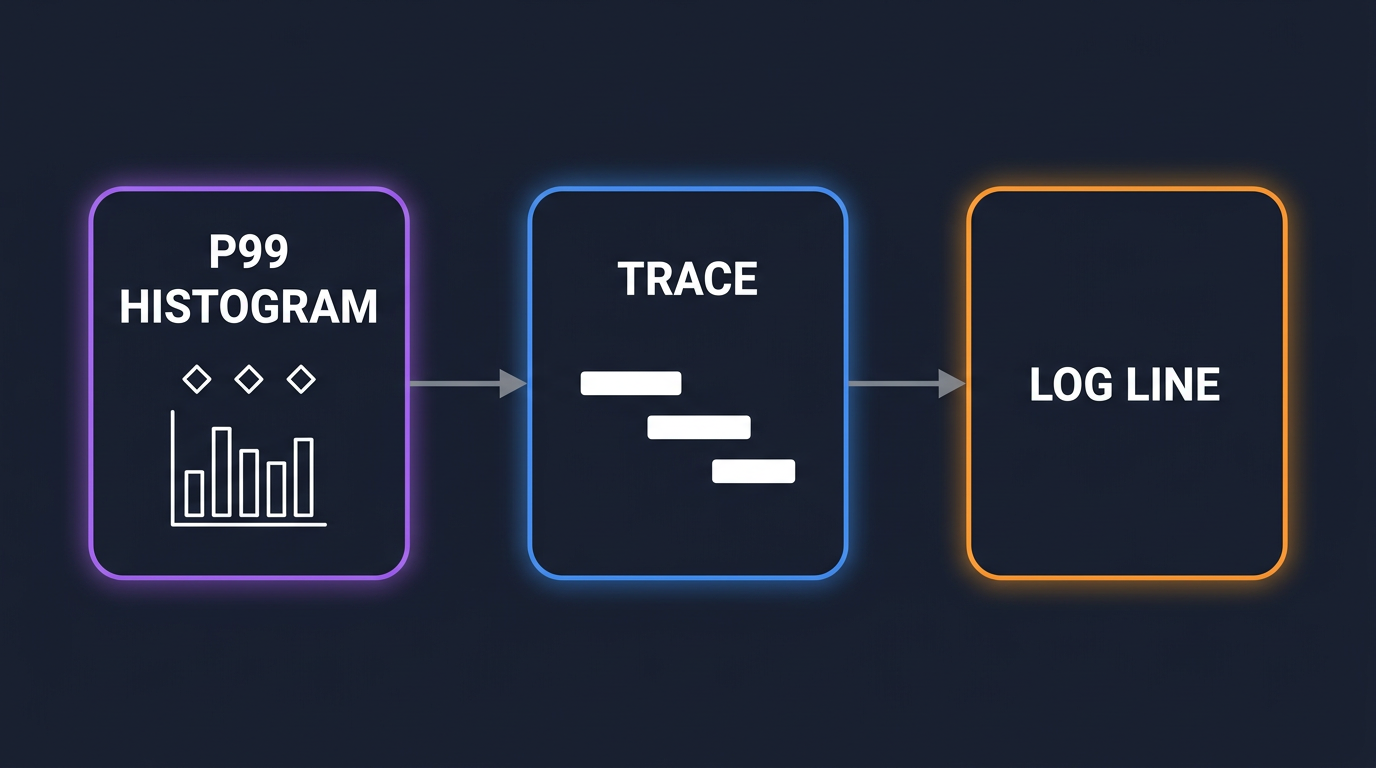
A histogram bucket count tells you "30 requests went over 1 second." It does not tell you which 30. An exemplar attaches one example trace_id per bucket so you can click through to a real slow request.
In the OTel SDK, you turn this on with the TRACE_BASED exemplar filter. Python:
from opentelemetry.sdk.metrics import MeterProvider
from opentelemetry.sdk.metrics.export import PeriodicExportingMetricReader
from opentelemetry.exporter.otlp.proto.grpc.metric_exporter import OTLPMetricExporter
import os

os.environ["OTEL_METRICS_EXEMPLAR_FILTER"] = "trace_based"

reader = PeriodicExportingMetricReader(OTLPMetricExporter())
provider = MeterProvider(metric_readers=[reader])

meter = provider.get_meter("checkout")
latency = meter.create_histogram(
    "http.server.duration",
    unit="ms",
    description="Request latency",
)

# Inside a request span:
latency.record(elapsed_ms, attributes={"http.route": "/checkout"})
trace_based records an exemplar only when the measurement happens inside a sampled span, which keeps cardinality bounded. Without that filter, an exemplar gets attached to every observation, which can blow up storage on a hot service.
If you export to Prometheus instead of OTLP, exemplars require the --enable-feature=exemplar-storage flag on the Prometheus server, and your scrape format must be OpenMetrics rather than the older Prometheus format.
A real incident with the pieces wired up looks like this.
Alert fires: checkout.http.server.duration P99 crossed 1.2s.
You open the metric panel. The histogram heatmap shows three exemplar dots above the spike. Click one. The UI knows the dot represents a real request and surfaces its trace_id.
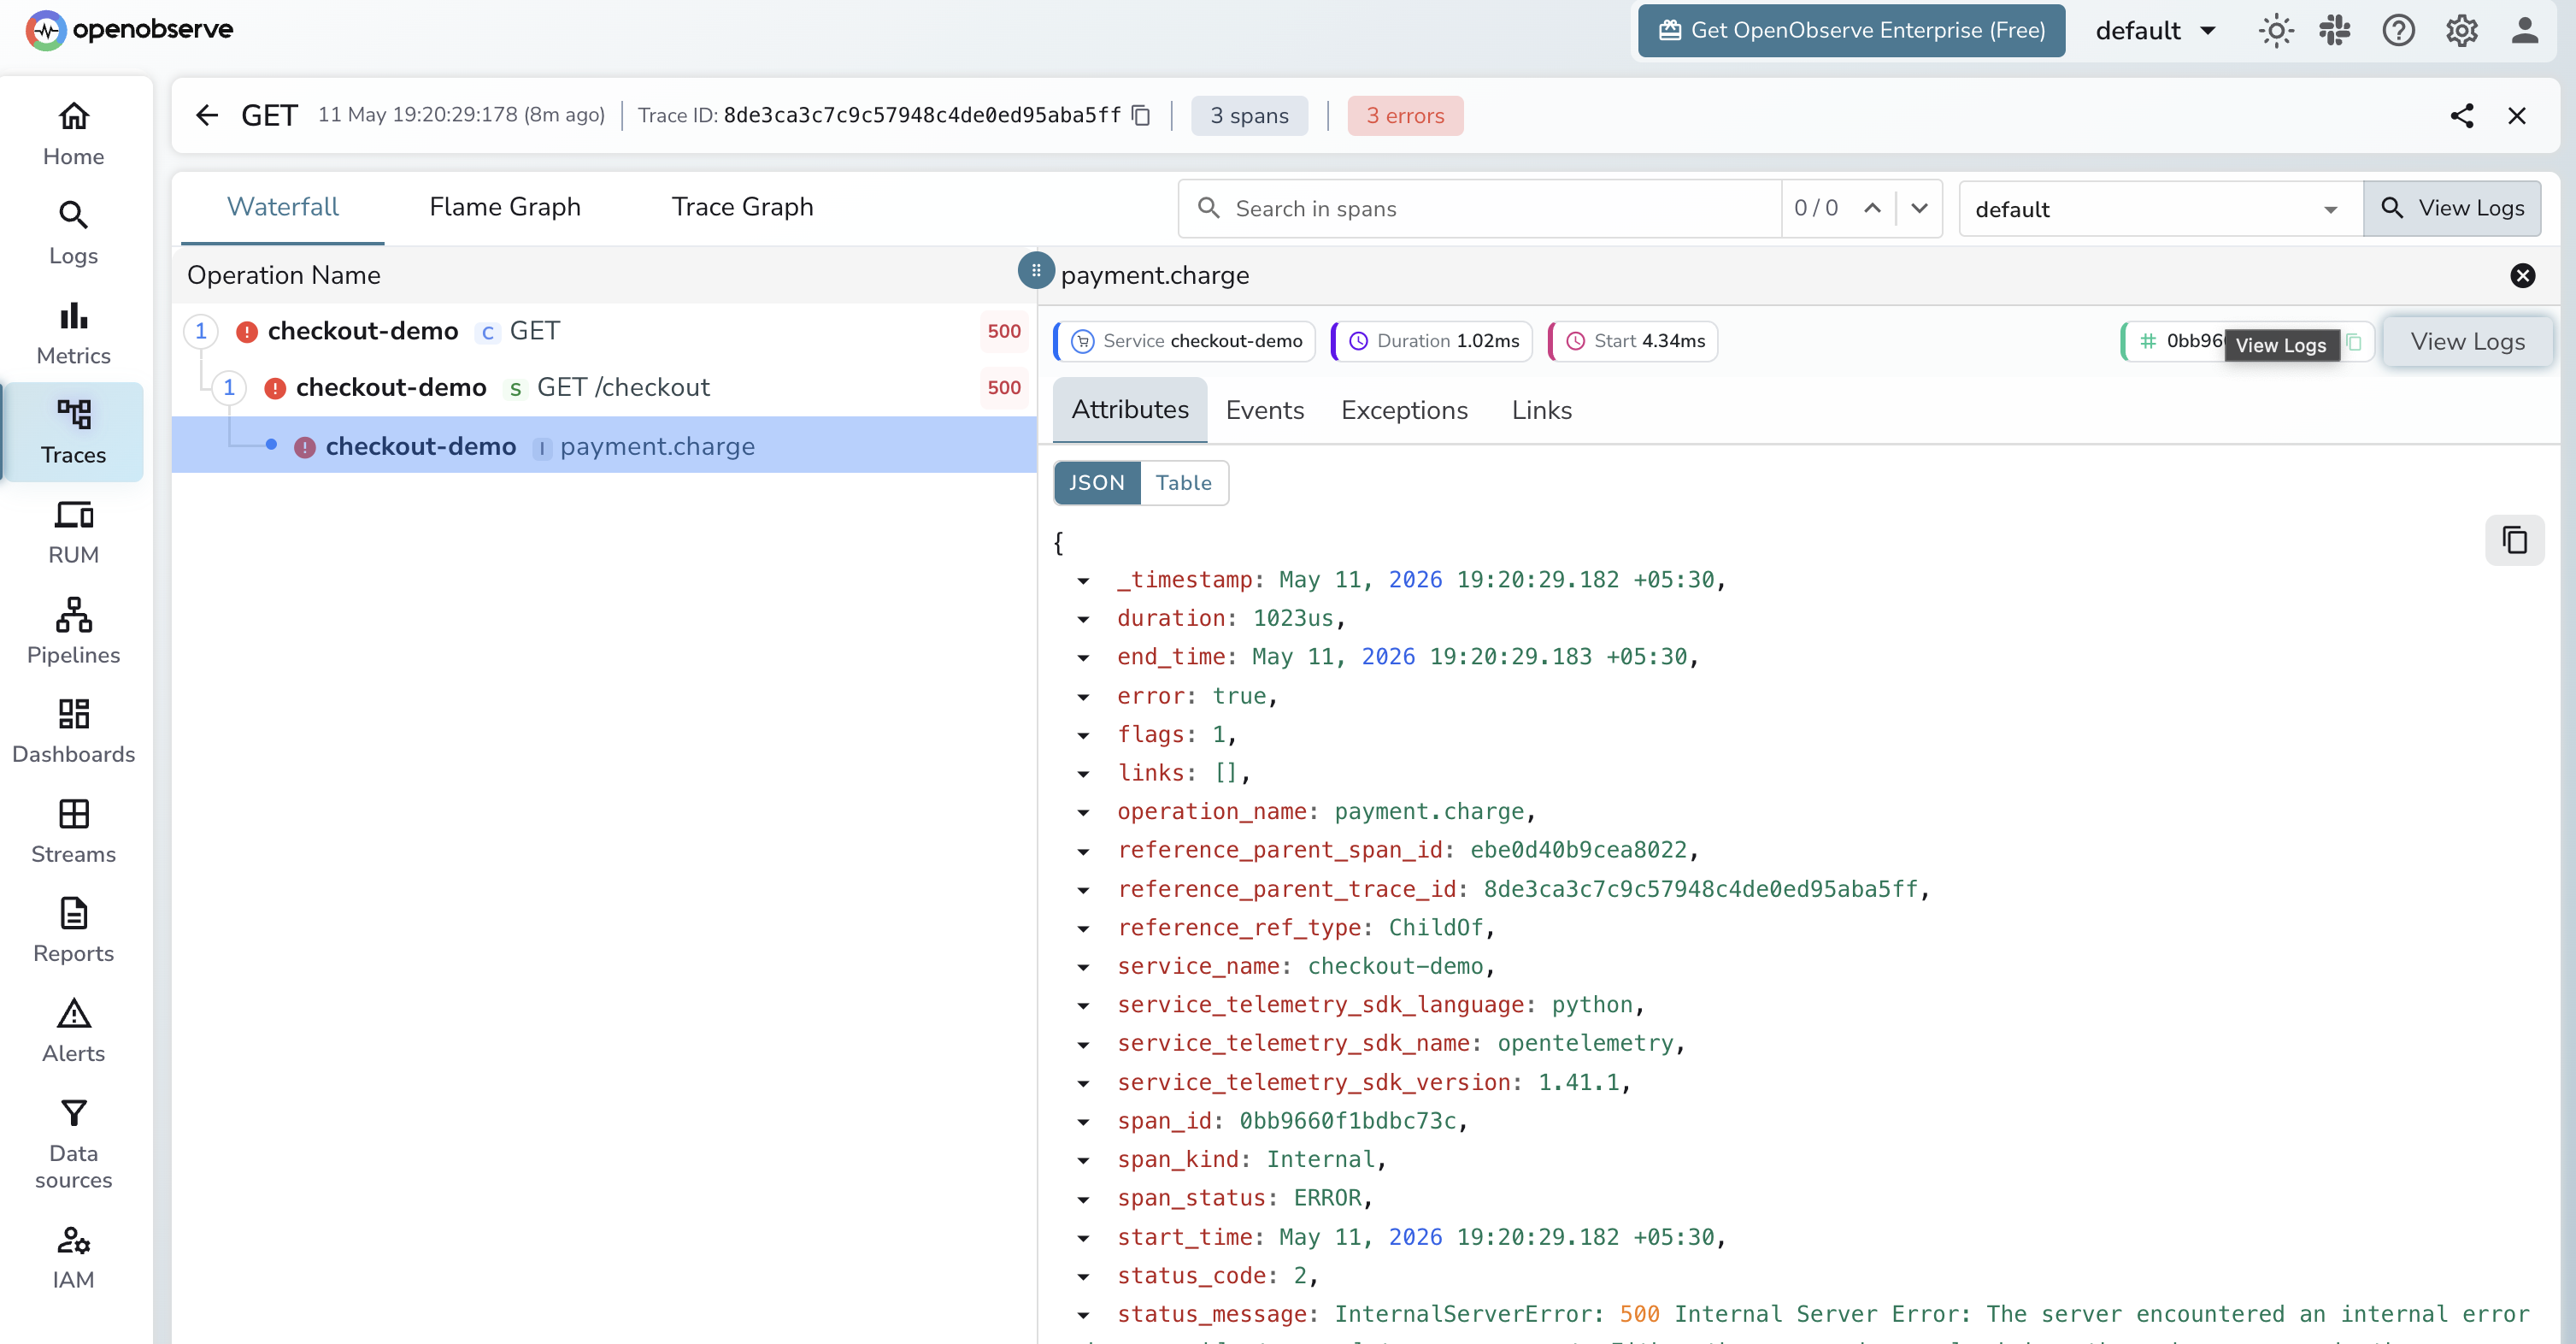
The trace view opens. Five spans: POST /checkout, auth.verify, inventory.reserve, payment.charge, notifications.send. The payment.charge span is 940ms. Two child spans inside it are red.
Click the failing span. The log panel attached to the trace view filters automatically by trace_id=4bf92f35.... Three lines come back. One reads payment_provider=stripe error="connection reset by peer" retry=3.
You have the answer. Stripe is timing out. You file the ticket and go back to bed.
The whole sequence is a chain of clicks instead of a chain of tab-switches, because at no point did you have to remember a timestamp or paste an identifier between tools. Every pivot was a primary-key lookup.
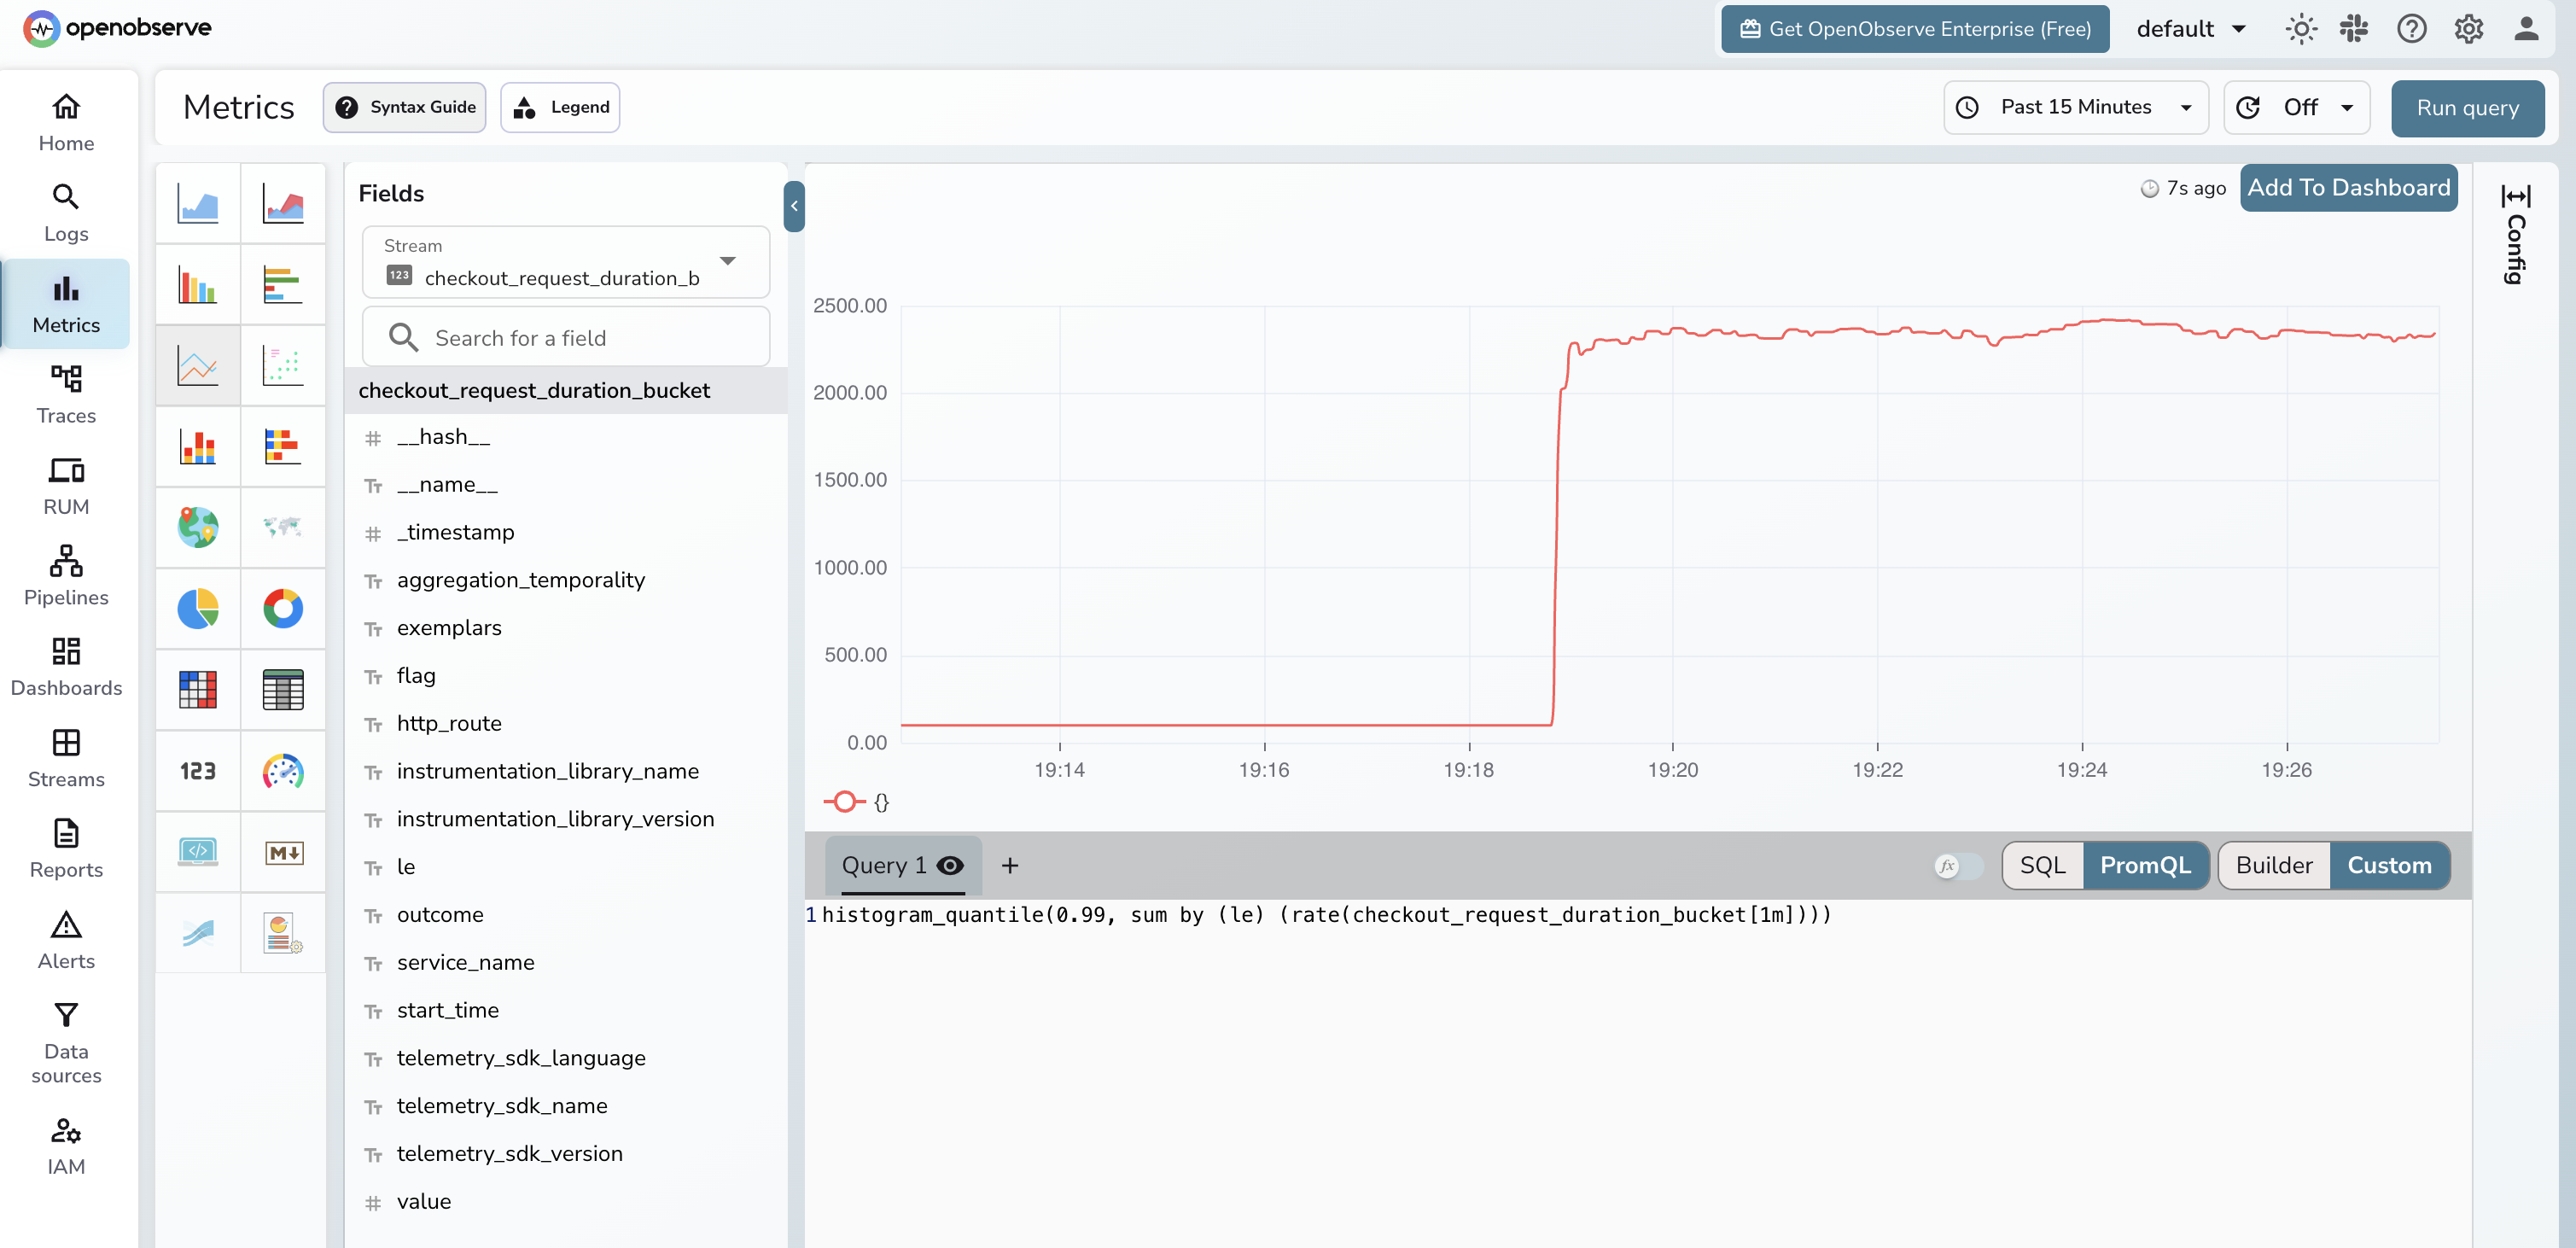
Click one of those spikes (in practice, an exemplar dot on the bucket above it) and you land on the trace it came from. The trace view shows the span waterfall, and the linked logs panel filters by trace_id automatically:
The numbers vary by team and incident type, but the direction is consistent across published reports. A 2025 industry analysis covered in PR Newswire reported that AI-driven observability with correlated signals can shorten MTTR by up to 70 percent. A research paper on observability and SRE found average MTTD and MTTR reductions of about 60 percent and 45 percent respectively when correlated traces and logs were available to on-call engineers. For the operational view of how this rolls up, the MTTR guide covers the wider metric.
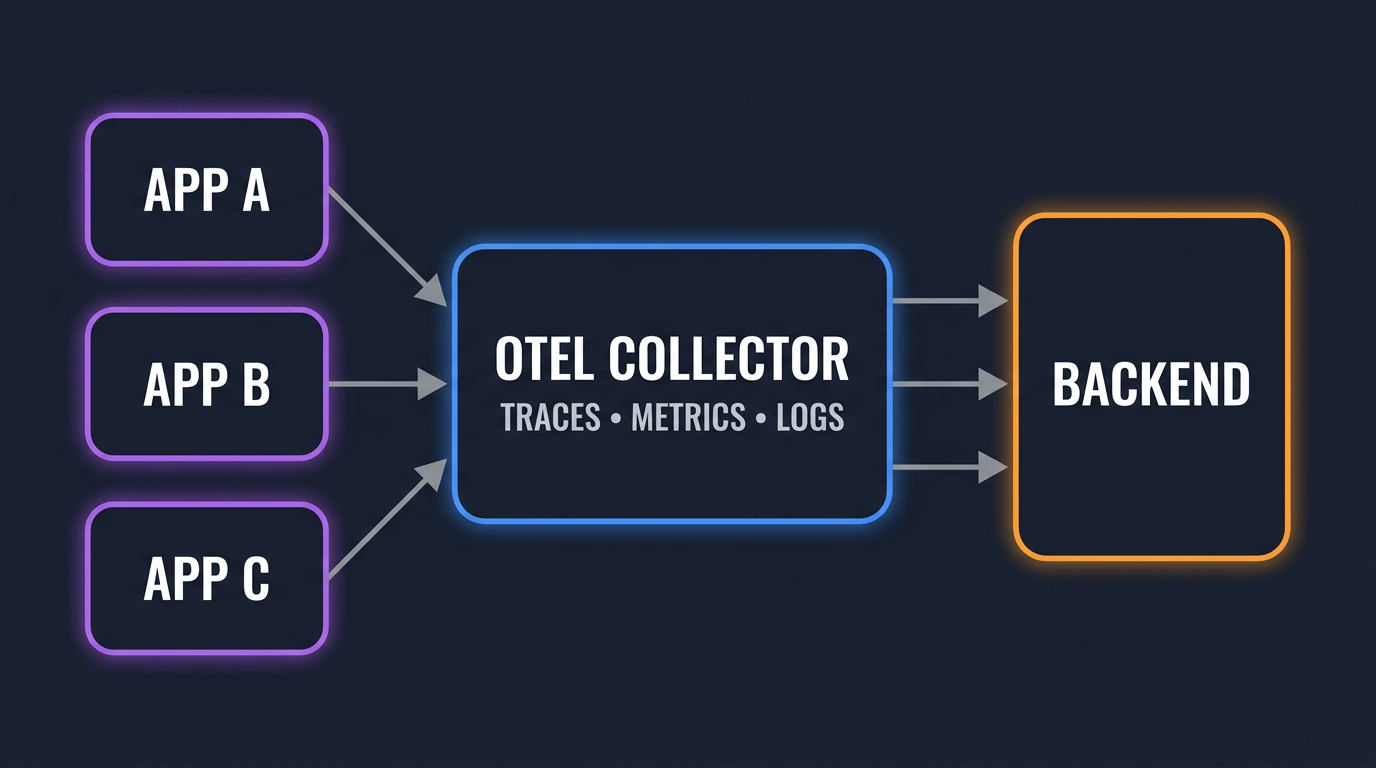
You do not need three pipelines. The OTel Collector accepts all three signals on a single OTLP receiver and routes them to one or more backends. A minimal config:
receivers:
  otlp:
    protocols:
      grpc:
        endpoint: 0.0.0.0:4317
      http:
        endpoint: 0.0.0.0:4318

processors:
  batch:
    timeout: 5s
  memory_limiter:
    check_interval: 1s
    limit_percentage: 75

exporters:
  otlphttp/openobserve:
    endpoint: https://api.openobserve.ai/api/<org>
    headers:
      Authorization: Basic <base64(user:token)>
      stream-name: default

service:
  pipelines:
    traces:
      receivers: [otlp]
      processors: [memory_limiter, batch]
      exporters: [otlphttp/openobserve]
    metrics:
      receivers: [otlp]
      processors: [memory_limiter, batch]
      exporters: [otlphttp/openobserve]
    logs:
      receivers: [otlp]
      processors: [memory_limiter, batch]
      exporters: [otlphttp/openobserve]
One receiver, three pipelines, one exporter. The application sends every signal to localhost:4317 and the Collector handles fan-out, batching, and back-pressure. For larger setups (tail sampling, attribute scrubbing, multi-backend export), the Collector Contrib guide covers the components you will end up adding.
The SDK setup is the easy part. These four failure modes account for most broken correlation in production.
OTel propagates trace context through Python contextvars, Node.js AsyncLocalStorage, and Go context.Context. Cross a boundary that does not preserve those (a Celery task, a Kafka consumer, a goroutine you forgot to pass ctx to) and the next span starts a brand new trace.
Fix: inject the traceparent header into the message body on the producer, extract it on the consumer:
from opentelemetry import trace
from opentelemetry.propagate import inject, extract

tracer = trace.get_tracer(__name__)

# Producer
headers = {}
inject(headers)
queue.publish(payload, headers=headers)

# Consumer
parent_ctx = extract(message.headers)
with tracer.start_as_current_span("process_message", context=parent_ctx):
    process(message)
Logs are usually unsampled. Traces are usually sampled aggressively (1 to 10 percent is common). The result: the majority of trace_id values in your logs point to traces that were never stored. Anyone who clicks the link sees an empty page.
Two ways out. The pragmatic one is to raise the head-based sampling rate on the services where correlation matters most, using parentbased_traceidratio (or parentbased_always_on for full capture) in the SDK. The thorough one is tail-based sampling in the Collector, which decides after the span finishes based on attributes like error status or latency. See Head-Based vs Tail-Based Sampling for how to weigh that tradeoff.
Fluent Bit, Vector, and Logstash configs from a few years ago often parse only the message field and drop everything else. If your logs reach the backend without trace_id, no amount of SDK setup will save the correlation.
Catch this early: search your log index for trace_id:* and confirm at least 50 percent of records inside known traced services have a value. If they do not, audit the shipper config.
span_id is unique per span. If you accidentally make it a metric label or an indexed log field on a high-QPS service, your label set explodes. Treat span_id as a free-text field. Treat trace_id as an indexed field but never as a metric label.
OpenObserve ingests OTLP for traces, logs, and metrics on the same endpoint and stores them in a single columnar backend, so the pivots described above work without any glue. The free tier on OpenObserve Cloud is enough to wire up a sample service, generate exemplars, and walk the alert-to-log path end to end.
Gorakhnath is a passionate developer advocate, working on bridging the gap between developers and the tools they use. He focuses on building communities and creating content that empowers developers to build better software.