Langfuse vs LangSmith vs OpenObserve: LLM Observability Compared (2026)




Ready to get started?
Try OpenObserve Cloud today for more efficient and performant observability.
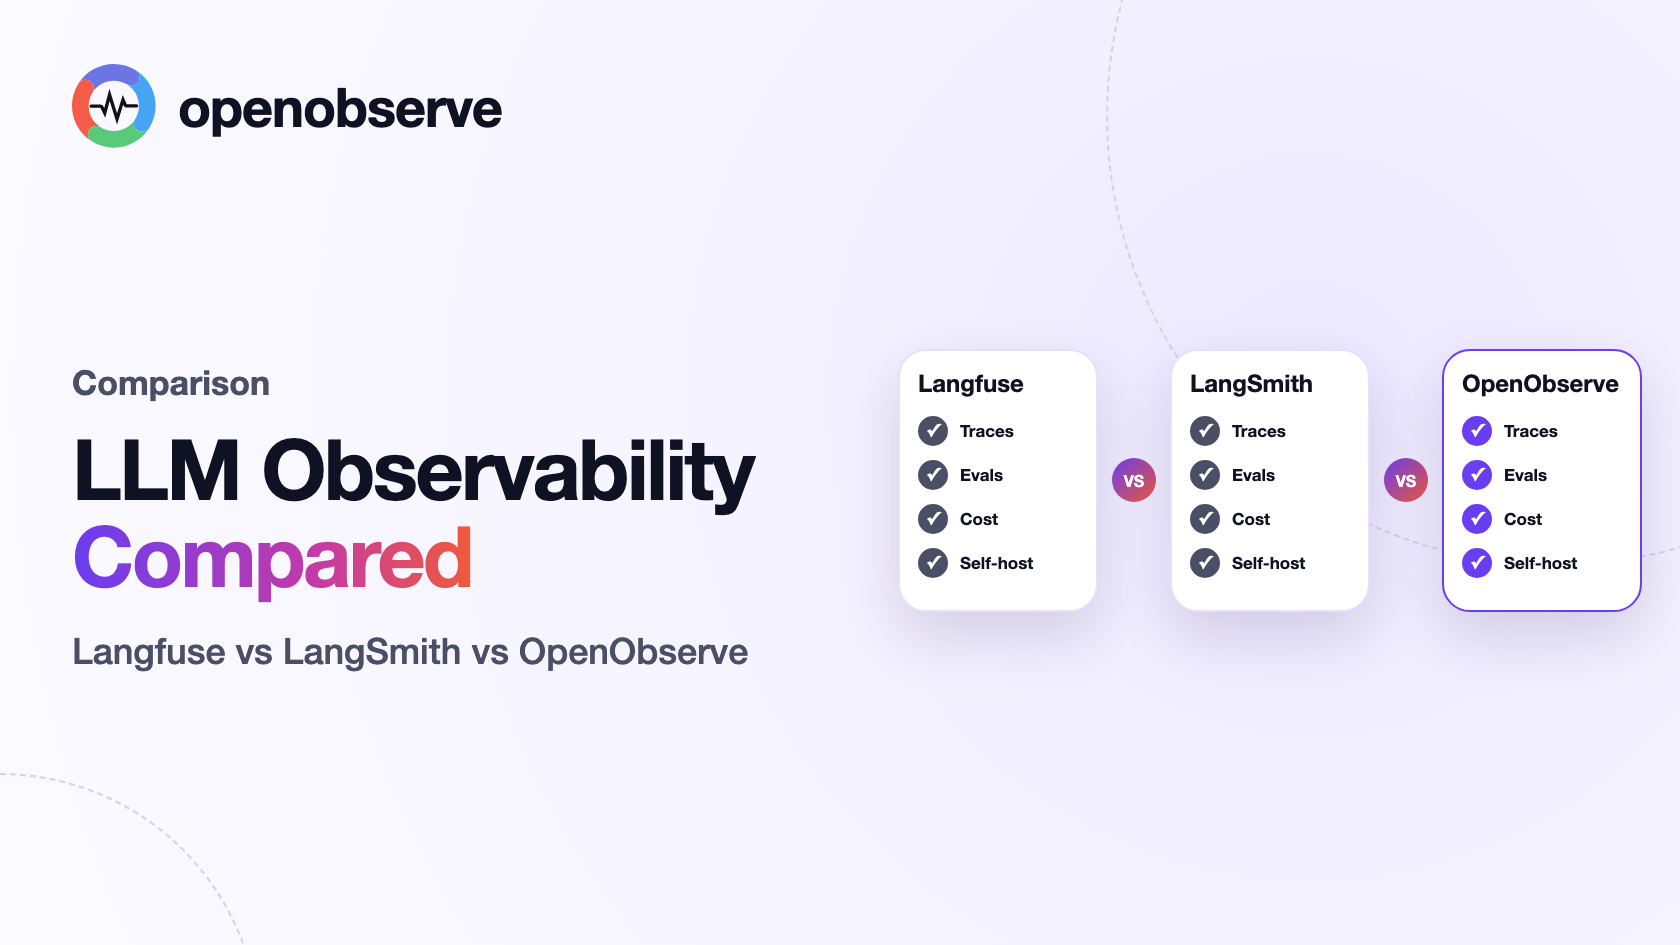
TL;DR: Langfuse vs LangSmith is a choice between two LLM engineering workbenches, and both share the same blind spot: they see your model calls and nothing else. The slow vector database, the throttled inference pod, and the retry storm at the gateway all live in a different tool, which is exactly where production incidents get solved. That is the case for a third option most comparison pages skip.
- Langfuse is the open source workbench: MIT core, OpenTelemetry based, framework agnostic, free self-hosting. Now owned by ClickHouse after the January 2026 acquisition.
- LangSmith is the managed workbench for LangChain and LangGraph shops: zero-config tracing, the deepest evaluation tooling, alerting, and agent deployment, all closed source with self-hosting locked to Enterprise.
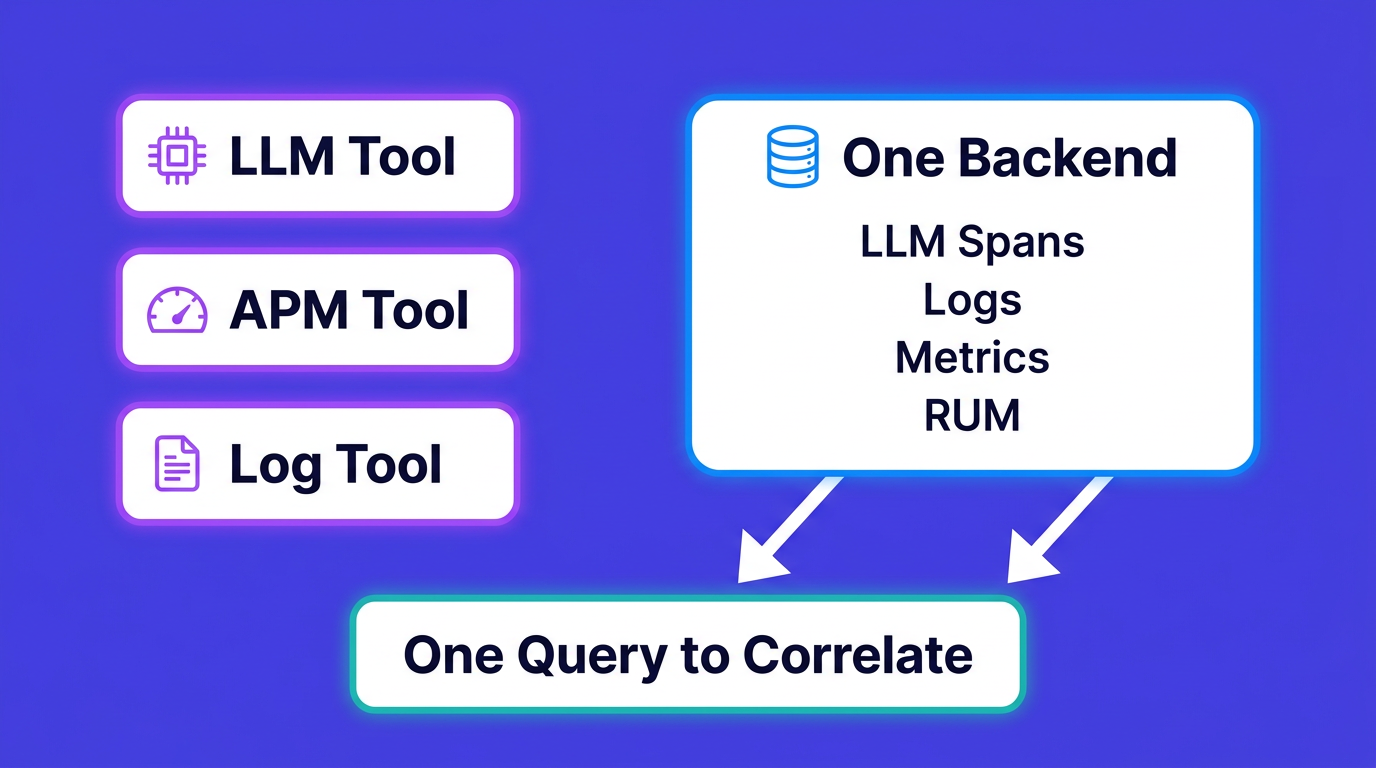
- OpenObserve gives you unified signal correlation. LLM spans land in the same backend as your logs, metrics, traces, and RUM, so "why was this answer slow" is one query against one store instead of a tab-switching exercise across two vendors.
- OpenObserve gives you predictable cost at scale. Pricing is per GB ingested, with no per-trace or per-unit tax, so the bill tracks the data you actually store rather than how many times your users hit the app.
- The denominators are incompatible (units vs base traces vs GB), so run the math on your own volume. In the scenario we work below, the same 500,000 requests per month land at roughly $241 on Langfuse, $2,567 on LangSmith, and $6 on OpenObserve.
Why this comparison looks different in 2026
Two announcements pushed a lot of teams back into evaluation mode this year.
In January 2026, ClickHouse announced a $400 million Series D and acquired Langfuse, the most widely deployed open source LLM observability platform. The core stays MIT licensed and self-hosting continues, but Langfuse is now part of a database company, and its March 2026 data model redesign leans harder into the ClickHouse backend it already ran on. For some buyers that reads as stability. For others it raises the same question every acquisition raises: whose roadmap wins when priorities conflict?
LangSmith moved too. In May 2026, LangChain announced SmithDB, a purpose-built storage engine for trace data, with claimed P50 trace load times of 92 milliseconds. This followed LangChain's $125 million raise at a $1.25 billion valuation in October 2025. LangSmith has also loosened its LangChain coupling, accepting OpenTelemetry traces from any framework.
So both point tools got faster, better funded, and more corporate in the span of a year. That is exactly the moment to step back and ask what you actually need from LLM observability, which is where the third option enters. If you want the wider field beyond these three, the top open source LLM observability tools comparison covers ten platforms, and Top 10 LLM Observability Tools in 2026 widens the lens further to commercial platforms like Datadog and Arize AI.
The three tools at a glance
| Langfuse | LangSmith | OpenObserve | |
|---|---|---|---|
| Category | LLM engineering platform | LLM engineering platform | Unified observability platform |
| Source model | Open source, MIT core | Closed source | Open source, AGPL-3.0 |
| Self-hosting | Free, fully supported | Enterprise plan only | Free, single binary |
| Framework coverage | Any, via OpenTelemetry | LangChain native, others via OpenTelemetry | Any, via OpenTelemetry |
| Pricing unit | Units (events) | Seats + base traces | GB ingested |
| Owned by | ClickHouse | LangChain | Independent |
The first two are purpose-built for the LLM development loop: prompts, traces, evaluations, datasets. OpenObserve comes at the problem from the other direction, treating LLM telemetry as one signal among the logs, metrics, and traces you already collect. If you are new to the category, what LLM observability actually covers is a better starting point than any vendor matchup.
Langfuse, the open source default
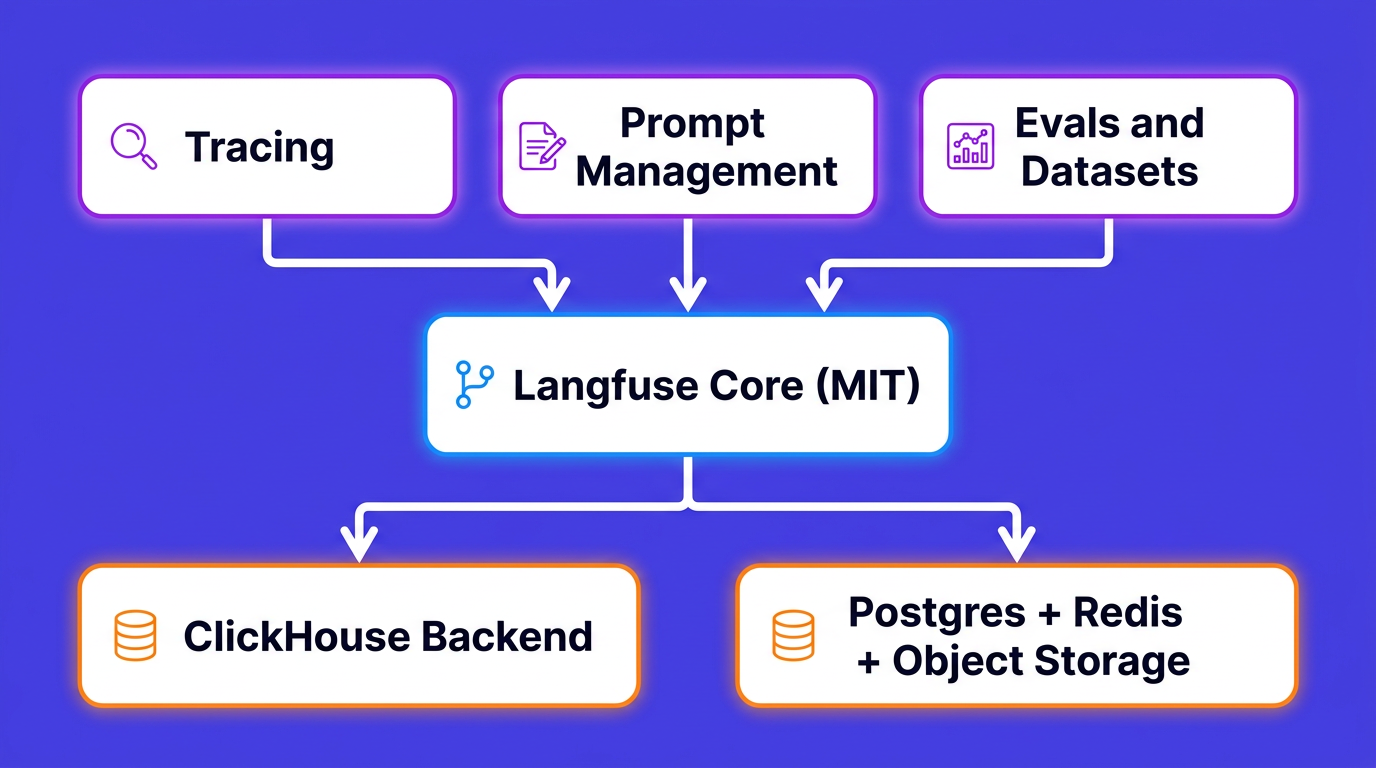
Langfuse launched in 2023 and became the tool most teams try first, for a simple reason: you can run it yourself, free, with no feature gate between cloud and self-hosted. The core covers end-to-end tracing of model calls, prompt management with versioning, evaluation (LLM-as-a-judge went fully MIT in June 2025, alongside human annotation and code-based checks), dataset experiments, and cost tracking.
Instrumentation is OpenTelemetry based, and the integration catalog spans more than 100 frameworks, model providers, and gateways, so a team running the OpenAI SDK plus a homegrown agent loop gets the same tracing as a LlamaIndex shop. Alerting, long a gap that competitors pointed at, arrived recently with Langfuse Monitors, still in beta as of mid 2026: threshold alerts on cost, scores, and latency, routed to Slack, webhooks, or GitHub Actions.
Where does it stop? Langfuse sees your LLM calls and nothing else. The database query that made your retrieval step slow, the Kubernetes node that throttled your inference pod, the frontend session where the user rage-refreshed: all of that lives in a different system. Self-hosting is also a real deployment, a multi-service stack with ClickHouse, Postgres, Redis, and object storage, so budget operational time accordingly. We compared the two-tool head-to-head in more depth in OpenObserve vs Langfuse, and if the acquisition has you shopping around, the Langfuse alternatives roundup ranks seven options.
LangSmith, the managed platform for LangChain shops
LangSmith is the closed source counterpart, and its pitch has widened from observability to what LangChain calls the full agent engineering lifecycle: tracing, production evals, and managed deployment for long-running agents.
The evaluation tooling is the strongest of the three. LangSmith ships more than 30 evaluator templates covering trajectory evaluation, safety checks, and multimodal outputs, plus automation rules that run evals on sampled production traffic. The Insights Agent clusters failures automatically, which turns "something is off in production" into a ranked list of failure modes without manual triage. Native alerting sends threshold notifications to Slack, email, or webhooks, and custom RBAC is available where Langfuse offers fixed roles.
For a team already on LangChain or LangGraph, setup is close to zero: set a few environment variables and traces flow. Since LangSmith now accepts OpenTelemetry traces, other stacks can use it too, though at that point you are doing the same instrumentation work any backend requires, and the convenience argument fades.
The trade-offs are structural. LangSmith is proprietary, self-hosting is an Enterprise-only add-on, and per-seat pricing stacks on top of per-trace pricing as your team grows. SmithDB is impressive engineering, but it is also a proprietary storage engine holding your telemetry. Teams weighing an exit have options; we ranked the credible ones in LangSmith alternatives.
OpenObserve, where LLM traces meet the rest of your stack
OpenObserve is an open source observability platform written in Rust that ingests logs, metrics, traces, real user monitoring, and LLM spans into one backend, queryable with SQL. LLM observability shipped as a first-class feature in early 2026, built directly on the OpenTelemetry GenAI semantic conventions: model, token counts, cost, and latency arrive as standard span attributes, with no proprietary SDK in your application code.
The argument for this approach is the debugging path. An LLM latency spike is rarely an LLM problem in isolation. It is a slow vector database, a saturated node, a retry storm at the gateway. When LLM spans live in the same store as infrastructure telemetry, that correlation is one query, in one interface, instead of a tab-switching exercise across two vendors. Deployment is a single binary against object storage, which matters if the multi-service Langfuse stack gave you pause.
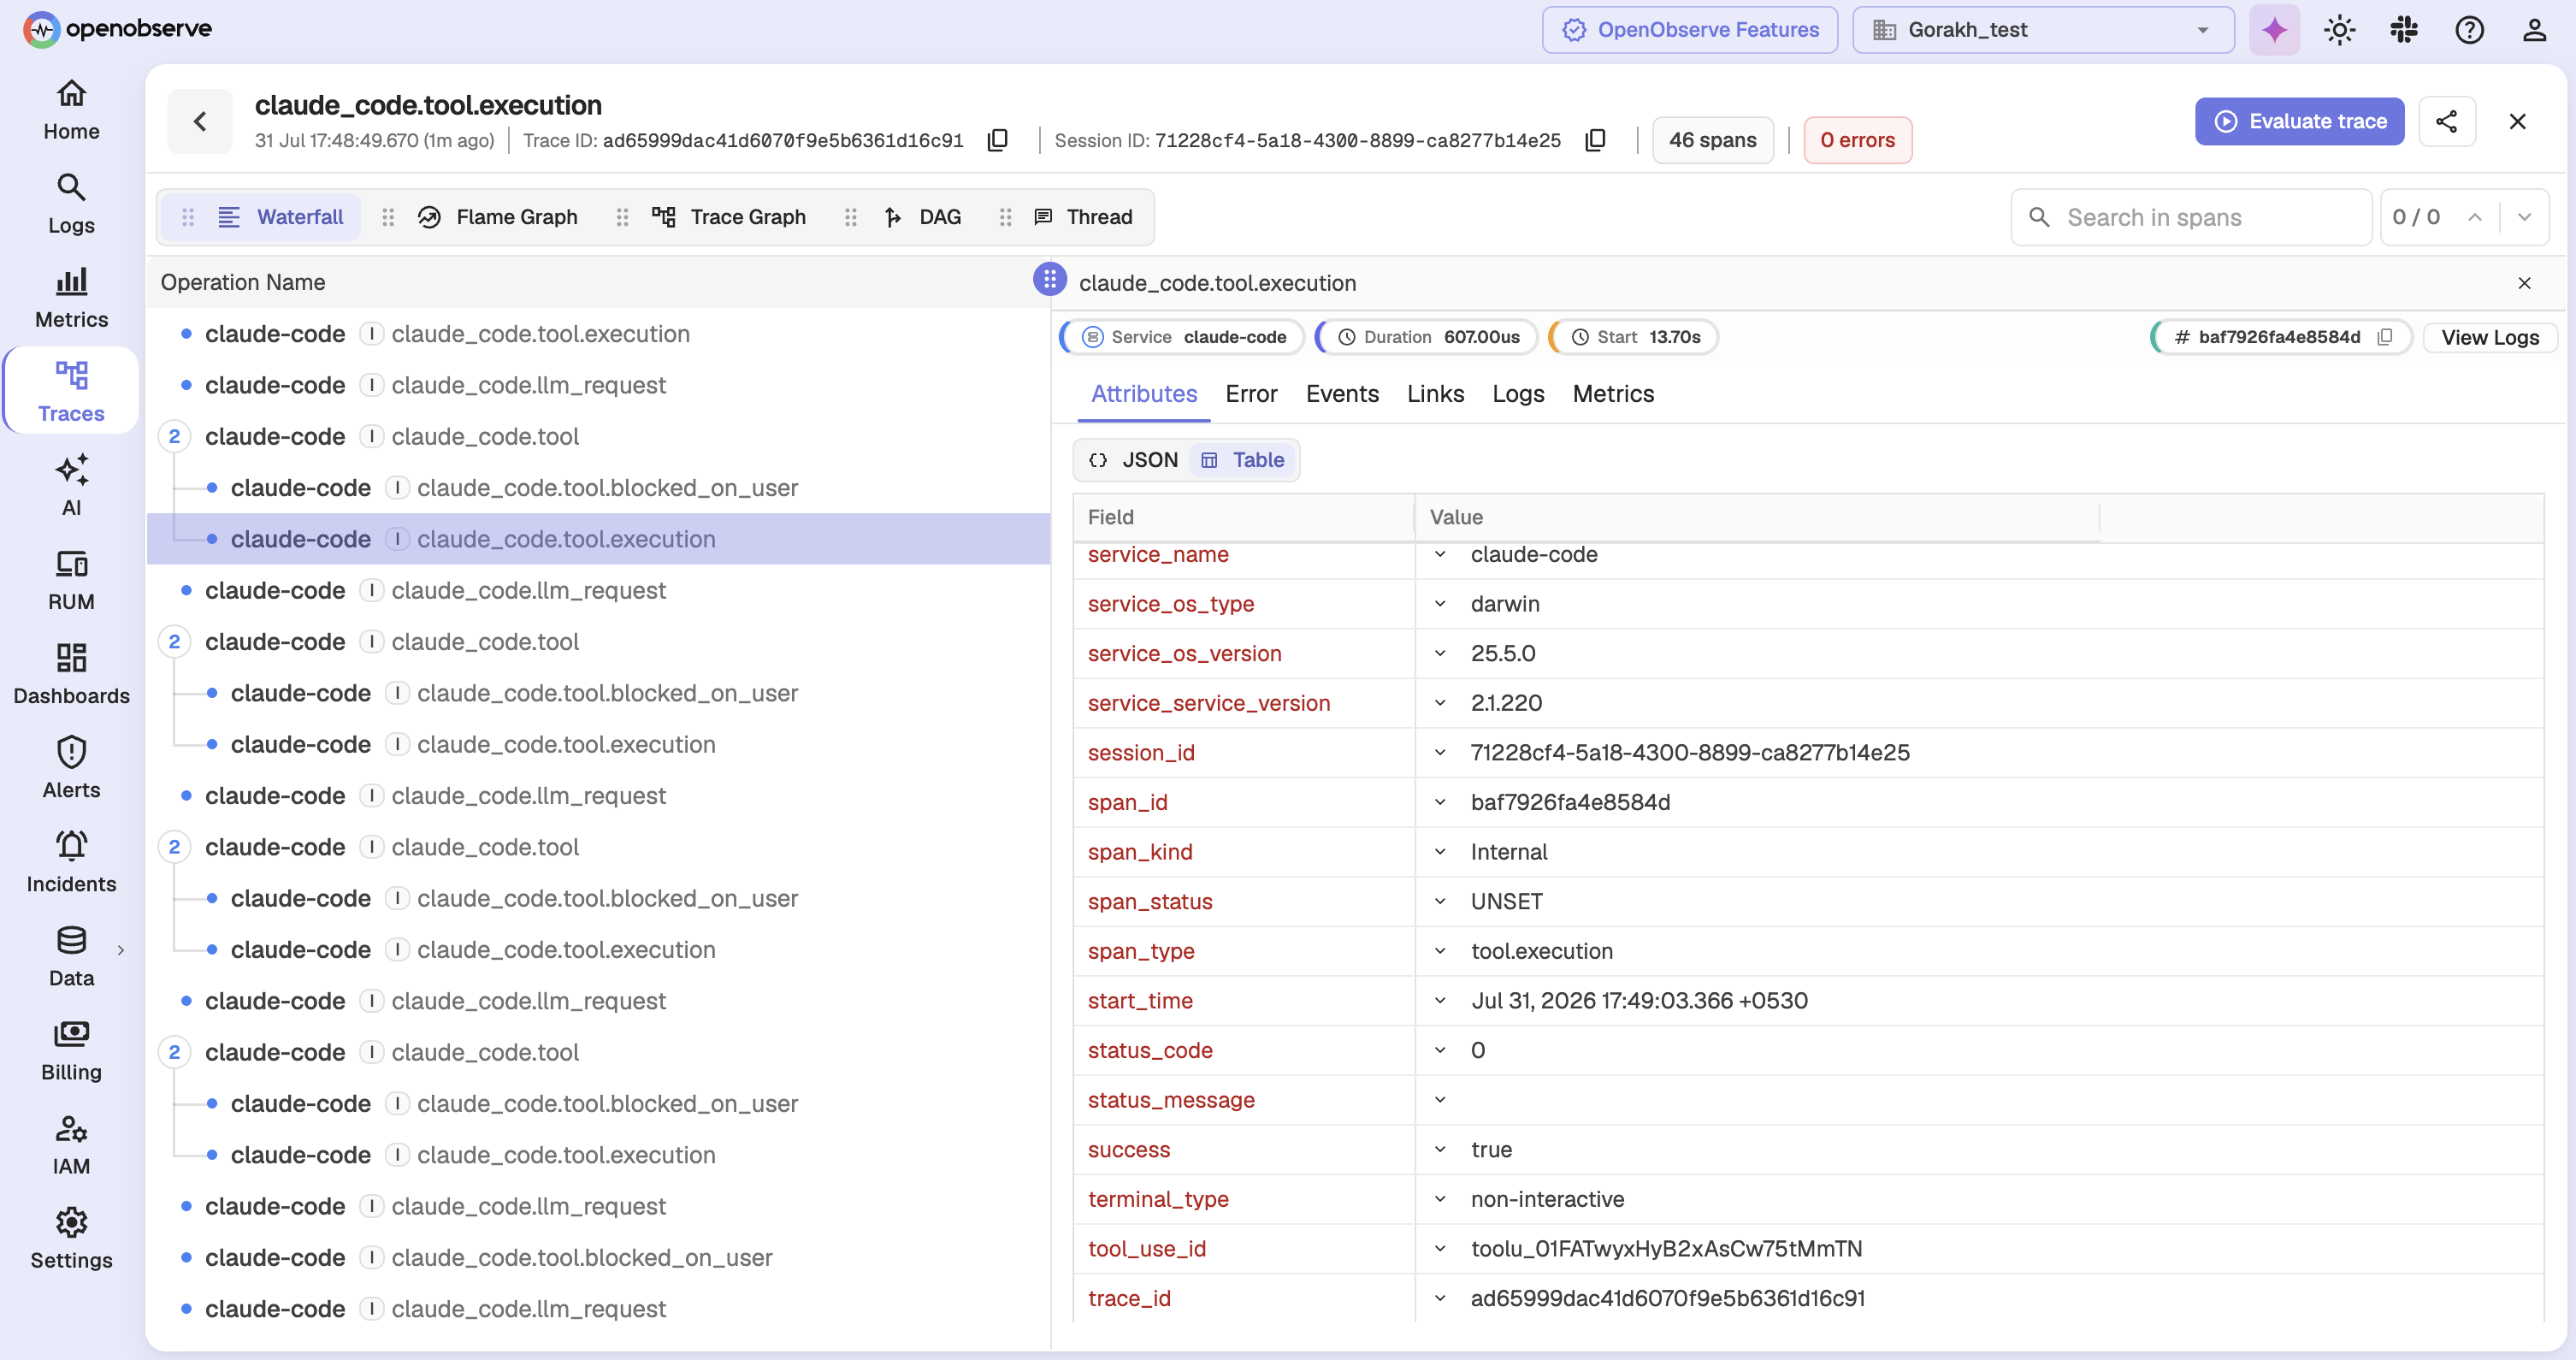
The trace above is a coding agent run captured as OpenTelemetry spans: each llm_request is a model call, each tool.execution is the work the agent did with the answer, and the waterfall makes the alternating shape of an agent loop obvious at a glance. The attributes panel is where the unified argument gets concrete. Every span carries a session ID and a trace ID, so the same identifiers that anchor this LLM trace also anchor the backend traces, the application logs, and the RUM session behind it. Correlating them is a query in one tool rather than an export between two.
The honest caveat: OpenObserve is an observability backend, and it does not try to be an LLM engineering workbench. There is no prompt playground, no evaluation dataset manager, no built-in LLM-as-a-judge pipeline. Teams that need those keep a point tool for the development loop and use OpenObserve as the system of record for production telemetry. Both patterns run on the same OpenTelemetry instrumentation, so this is a routing decision, not a rewrite.
Feature by feature
| Capability | Langfuse | LangSmith | OpenObserve |
|---|---|---|---|
| LLM call tracing | Yes, OpenTelemetry based | Yes, native for LangChain, OpenTelemetry for others | Yes, OpenTelemetry GenAI conventions |
| Prompt management | Yes, versioning and deployment | Yes, with A/B testing | No |
| Evaluations | LLM-as-a-judge, human, code-based | 30+ templates, Insights Agent clustering | No built-in evals |
| Production alerting | Langfuse Monitors, beta (Slack, webhooks) | Native (Slack, email, webhooks) | Full alerting engine (any signal) |
| Infra logs, metrics, RUM | No | No | Yes, same backend as LLM spans |
| Agent deployment | No | Yes, managed | No |
| Open source | MIT core | No | AGPL-3.0 |
| Free self-hosting | Yes, multi-service stack | No, Enterprise only | Yes, single binary |
| Custom RBAC | Fixed roles | Yes | Yes |
| Storage backend | ClickHouse | SmithDB (proprietary) | Parquet on object storage |
What each actually costs
The pricing pages are hard to compare on purpose. Langfuse bills units, where a unit is any ingested event: a trace, an observation inside it, or a score. LangSmith bills seats plus base traces, with per-trace overage that varies by retention. OpenObserve bills gigabytes ingested. Three different denominators, so the only honest comparison is a worked scenario.
Published list prices as of July 2026:
- Langfuse Cloud: free Hobby tier with 50,000 units per month, Core at $29 per month including 100,000 units, Pro at $199, Enterprise from $2,499, each including the same 100,000 units. Overage starts at $8 per 100,000 units and steps down at higher volume.
- LangSmith: free Developer tier with 5,000 base traces per month, Plus at $39 per seat per month including 10,000 base traces, then pay-as-you-go beyond that. Overage is metered in LangChain Storage Units at $1.00 per LSU, and a base trace costs 0.005 LSU, so $5 per 1,000 traces at 14 day retention. Upgrading a trace to 180 day extended retention adds 0.0025 LSU, another $2.50 per 1,000 (per the LangChain pricing page). Enterprise is custom.
- OpenObserve Cloud: $0.50 per GB ingested, with a 14 day free trial and no credit card required.
Now the scenario. Say your app handles 500,000 LLM requests per month, each producing one trace with an average of 5 observations (chain steps, retrievals, model calls), and each span averages 4 KB with prompt and completion payloads. Three engineers need access.
- Langfuse: 500,000 traces plus 2.5 million observations is 3 million units. On Core, graduated overage pricing puts that at roughly $241 per month: $29 for the plan, $8 per 100,000 units up to 1 million, then $7 per 100,000 after that. Seats do not add cost.
- LangSmith: three Plus seats are $117 per month, and the roughly 490,000 traces beyond the included 10,000 bill at 0.005 LSU each, which is $2,450. That is $2,567 per month at 14 day retention, and keeping those traces for 180 days adds $1,225 on top.
- OpenObserve: 3 million spans at 4 KB is about 12 GB ingested, which comes to roughly $6 per month, and that headroom is why teams also route infra telemetry into the same account.
The gap is not a rounding error, and it comes from the denominator rather than the discount. Langfuse and LangSmith both charge per unit of LLM activity, so the bill tracks request volume: double your traffic and you roughly double the invoice, before a single seat is added. OpenObserve charges for bytes stored, so the same traffic growth only costs what the extra payload actually weighs. Assumptions still move the numbers, of course. Fatter payloads move the OpenObserve figure, score-heavy eval pipelines inflate Langfuse units, and trimming LangSmith retention or sampling traffic pulls that $2,450 down. Treat the scenario as a template and run your own volumes; the LLM cost monitoring guide covers how to measure what you are actually emitting before you commit to a pricing model.
Which one fits your team
Constraint-first is the fastest way to decide.
All-in on LangChain or LangGraph, no self-hosting requirement. LangSmith. The zero-config tracing, eval templates, and Insights Agent are the strongest development loop of the three, and you pay for the convenience knowingly.
Data sovereignty or a hard self-hosting requirement. Langfuse for the LLM workbench, OpenObserve for the telemetry backend. Both self-host free; LangSmith is out at this constraint.
Production debugging across the whole system. OpenObserve. When the question is "why was this answer slow" and the cause could be retrieval, infrastructure, or the model, one backend holding all signals beats correlating across silos.
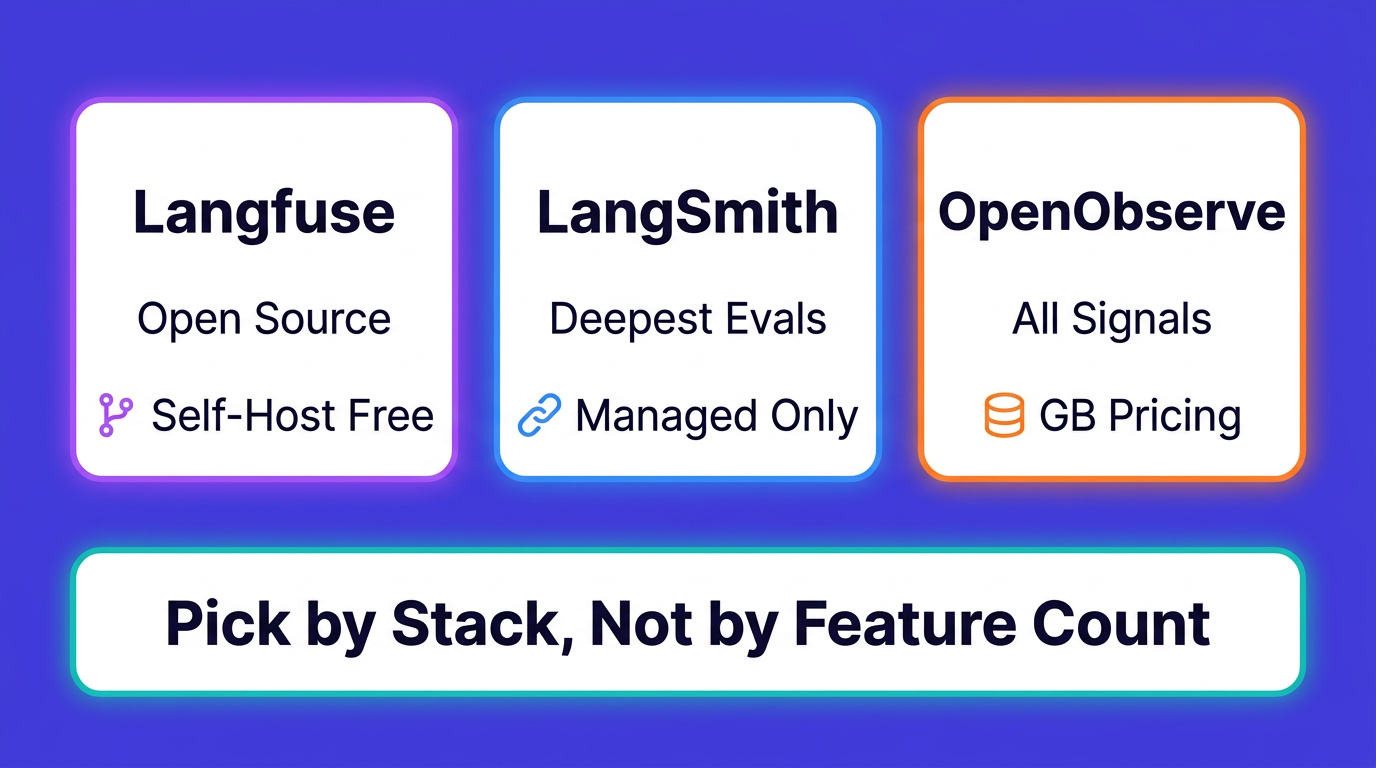
Heavy prompt iteration and evals, plus real production traffic. Use two tools deliberately: Langfuse or LangSmith for the development loop, OpenObserve as the production system of record. Because all three accept OpenTelemetry, you instrument once and route spans to both, and you can change the routing later without touching application code.
Try it with your own traces
The fastest way to test the unified approach is to point your existing OpenTelemetry GenAI instrumentation at OpenObserve Cloud and watch LLM spans land next to your logs and metrics. The 14 day trial is enough to trace a real workload, and there is nothing to deploy.
Frequently Asked Questions
About the Author
Gorakhnath Yadav


Gorakhnath is a passionate developer advocate, working on bridging the gap between developers and the tools they use. He focuses on building communities and creating content that empowers developers to build better software.
Follow OpenObserve on Google
Add OpenObserve as a preferred source to see more of our articles in Google Search and Top Stories.