Top 10 Open Source APM Tools in 2026: Complete Comparison Guide




Ready to get started?
Try OpenObserve Cloud today for more efficient and performant observability.
TL;DR
OpenObserve is the best open source APM tool in 2026 for teams that need unified application performance monitoring alongside logs and infrastructure metrics. It provides distributed tracing, error tracking, code-level performance analysis, and cross-signal correlation in a single self-hosted deployment with significantly lower storage costs than Elastic APM.
- Best unified open source APM: OpenObserve: logs, metrics, traces, and APM in one platform with no separate tool sprawl
- Best for storage cost savings: OpenObserve: columnar object storage compression dramatically reduces APM data storage costs versus Elastic APM
- Best OTel-native APM: OpenObserve: fully OpenTelemetry-native, accepts OTLP traces from any framework with no proprietary agents
- Best for Kubernetes APM: OpenObserve: high-cardinality service-level and pod-level APM metrics, Helm deployment in under 10 minutes
- Best for self-hosted data control: OpenObserve: deploy on-premises or in your own cloud with full data residency and compliance control
- Best for replacing Elastic APM: OpenObserve: drops the JVM-heavy Elasticsearch backend and uses S3-compatible object storage instead
For a broader comparison including commercial APM tools, see our Top 10 APM Tools in 2026 guide.
Open source APM tools eliminate licensing fees and give you full data control. The trade-off is operational ownership: you manage deployment, scaling, and upgrades. Here's what drives teams to evaluate them carefully:
- No licensing fees: pay for infrastructure and ops overhead, not per-host or per-GB charges to a vendor.
- Data sovereignty: keep telemetry on-premises or in your own cloud region (required for GDPR, HIPAA, and SOC 2 compliance).
- Instrument once with OpenTelemetry, then switch backends without touching application code.
- Customization: fork, extend, and modify to fit requirements commercial tools can't accommodate.
- Active projects like OpenObserve and Uptrace ship features faster than many commercial APM vendors.
Why Teams Are Choosing Open Source APM Tools
- Zero licensing costs: pay for infrastructure and ops overhead, not per-host or per-GB fees to a vendor.
- Self-hosting gives you full telemetry data ownership, which matters for GDPR, HIPAA, and audit requirements.
- No vendor lock-in: OTel-native tools let you switch backends without changing application instrumentation.
- You can audit the source code, verify security practices, and contribute fixes directly - not possible with proprietary APM.
- Community velocity: active projects like OpenObserve and Uptrace often ship features faster than commercial vendors.
What to Look for in an Open Source APM Tool
When evaluating open source APM tools, assess these critical dimensions:
| Criterion | Why It Matters | What to Evaluate | How to Test |
|---|---|---|---|
| Unified Observability | Reduces tool sprawl and context switching | Single platform for metrics, logs, traces; Correlated views | Run distributed transaction and trace across signals |
| OpenTelemetry Support | Ensures vendor neutrality and future flexibility | Native OTLP ingestion; Collector compatibility | Deploy OTel Collector and verify data flow |
| Storage Efficiency | Controls infrastructure costs at scale | Compression ratios; Storage backends; Retention policies | Benchmark storage growth with production data |
| Query Performance | Enables fast incident investigation | Query language (SQL, PromQL); Response times | Run complex queries on large datasets |
| Deployment Simplicity | Reduces operational overhead | Docker/Kubernetes support; Documentation quality | Deploy in test environment and measure time-to-value |
| Scalability | Handles growth without architecture changes | Horizontal scaling; High availability options | Load test with projected data volumes |
| Community Health | Indicates long-term viability | GitHub activity; Release frequency; Issue response times | Review commits, PRs, and community discussions |
| Alerting Capabilities | Enables proactive monitoring | Alert rules; Notification channels; Anomaly detection | Configure production-grade alerts |
| Visualization | Supports effective troubleshooting | Dashboard flexibility; Pre-built templates | Build dashboards for key use cases |
Top 10 Open Source APM Tools: Comparison & Use Cases
1. OpenObserve
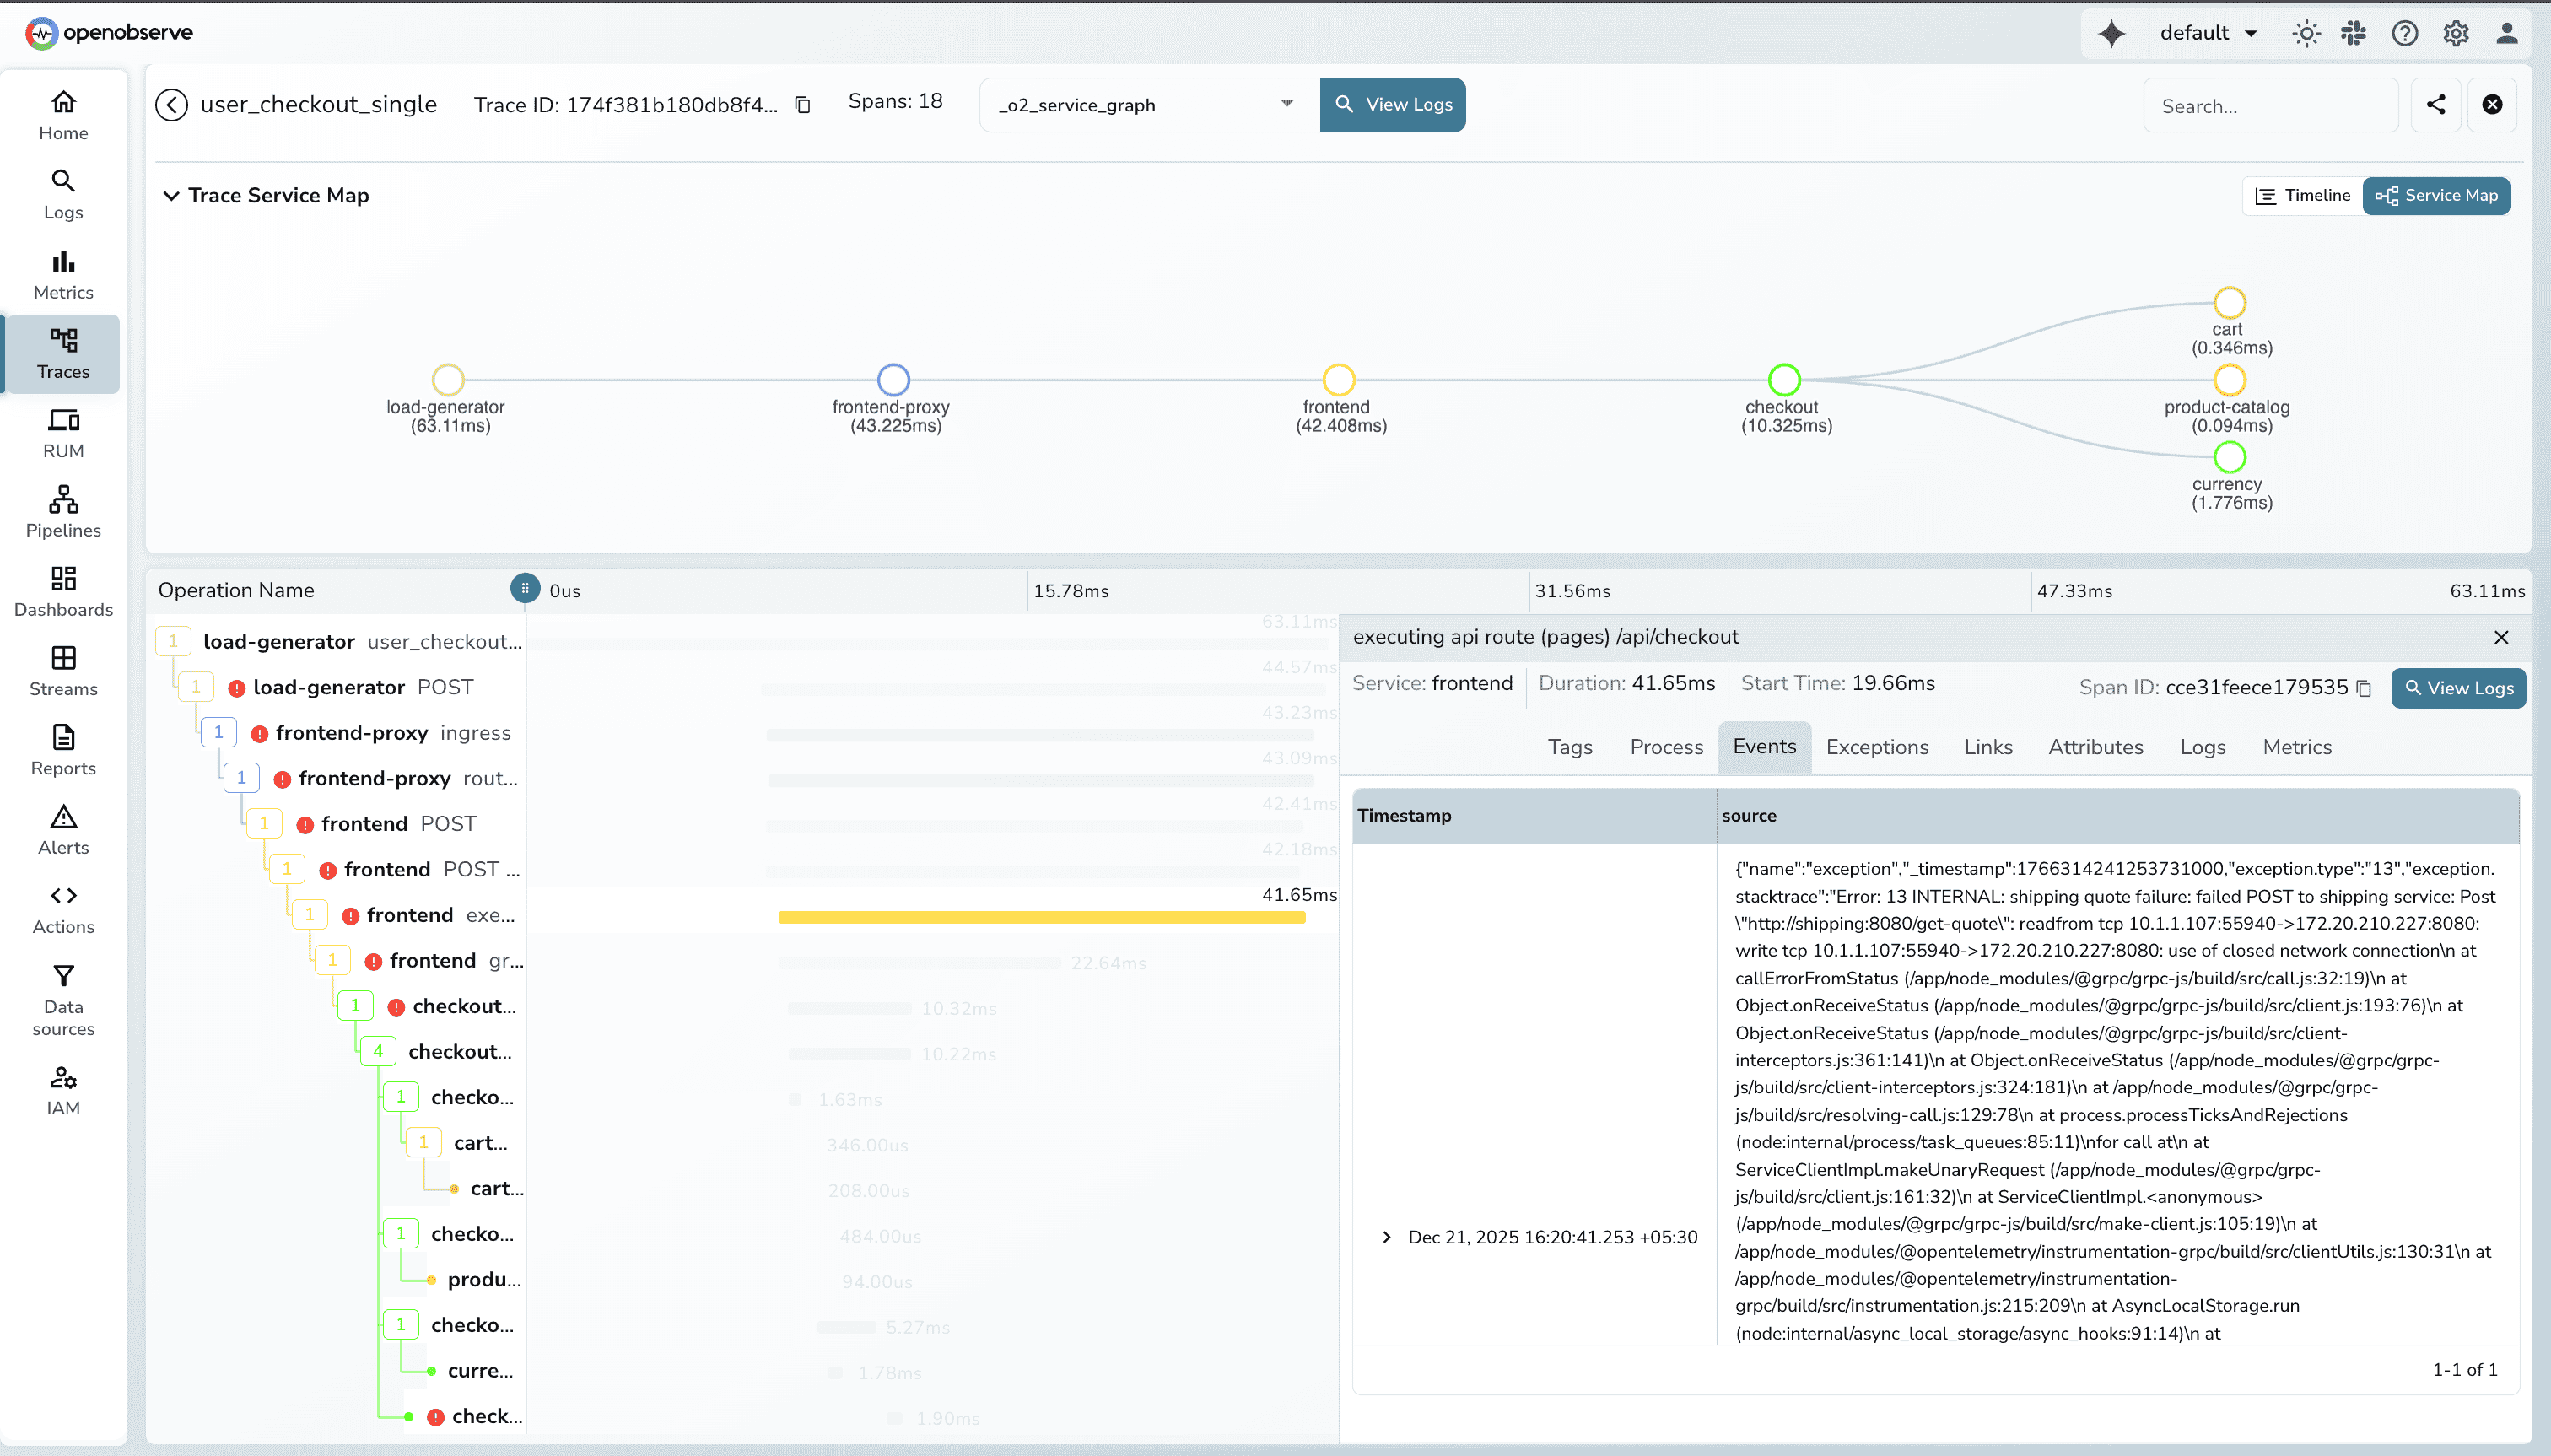
OpenObserve is the #1 open source APM and observability platform, delivering unified logs, metrics, traces, and APM with approximately 140x lower storage costs in typical log workloads compared to Elasticsearch-based stacks (actual results vary based on data entropy and cardinality). Built with Rust for exceptional performance, it provides a complete alternative to commercial APM tools without the complexity or cost.
OpenObserve Pros:
- Unified Observability Platform: Logs, metrics, traces, and APM in a single self-hosted solution
- Lower Storage Costs: Columnar compression delivers approximately 140x lower storage in typical log workloads versus Elasticsearch-based stacks (actual results vary), dramatically lowering infrastructure costs
- OpenTelemetry-Native: First-class OTLP support for vendor-neutral instrumentation
- SQL-Based Queries: Familiar query language instead of proprietary DSLs
- Built-in Dashboards & Alerting: No need for separate visualization tools
- Real User Monitoring (RUM): Frontend performance monitoring included
- Simple Deployment: Single binary or Docker/Kubernetes with minimal configuration
- Active Development: Frequent releases with rapid feature additions
OpenObserve Cons:
- Growing yet newer project compared to established tools like Prometheus or Jaeger
Integration / Mitigation:
- OpenTelemetry Collector provides seamless data ingestion from any source
- Compatible with Prometheus remote write for metrics migration
- Prebuilt dashboards accelerate adoption
- Active Slack community provides rapid support
Best For:
Teams seeking a unified, cost-effective open source APM solution that replaces multiple tools (ELK, Prometheus, Jaeger) with a single platform while maintaining full data ownership.
2. Grafana Stack (Prometheus + Loki + Tempo + Mimir)
Grafana Stack (also known as LGTM) combines best-in-class open source tools for metrics (Prometheus/Mimir), logs (Loki), and traces (Tempo) with Grafana's industry-leading visualization layer.

Grafana Stack Pros:
- Industry-Standard Components: Prometheus is the de facto standard for Kubernetes metrics
- Best-in-Class Dashboards: Grafana visualization capabilities are unmatched
- Massive Ecosystem: Thousands of exporters, plugins, and community dashboards
- Flexible Architecture: Mix and match components based on needs
- Strong Community: Large, active community with extensive documentation
- Cloud-Native Ready: Designed for Kubernetes and containerized environments
Grafana Stack Cons:
- Requires managing 4+ separate systems (Prometheus, Loki, Tempo, Mimir, Grafana)
- Operational complexity increases significantly at scale
- No unified query language across signals
- Higher infrastructure overhead compared to unified platforms
Integration / Mitigation:
- Grafana Cloud offers managed deployment for reduced operational burden
- Helm charts and operators simplify Kubernetes deployment
- Can adopt incrementally (start with Prometheus, add Loki later)
- OpenTelemetry Collector unifies data collection
Best For:
Teams with strong DevOps expertise who want maximum flexibility and are comfortable managing multiple systems. Ideal for organizations already invested in Prometheus.
3. Jaeger
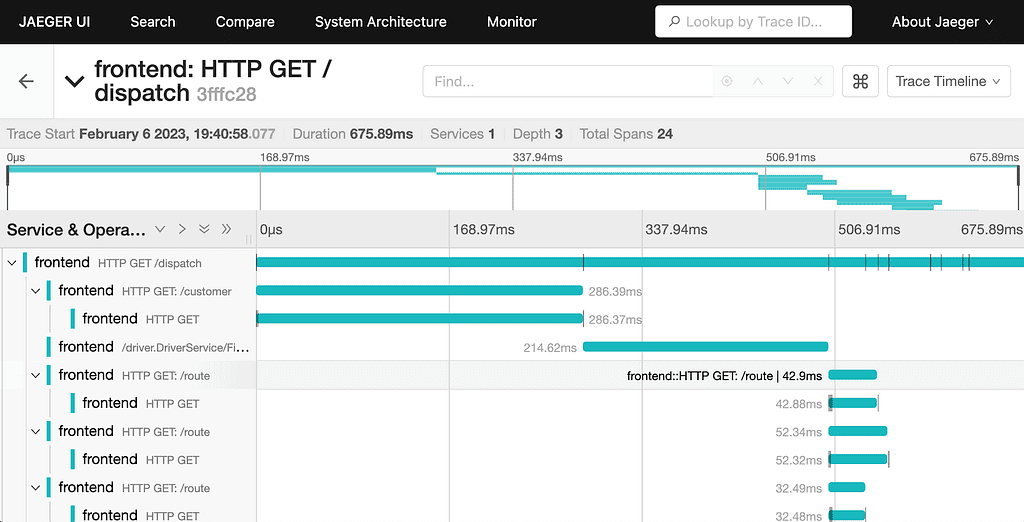
Jaeger is a CNCF-graduated distributed tracing system originally developed at Uber. It's one of the most widely adopted open source tracing solutions, providing end-to-end transaction monitoring for microservices.
Jaeger Pros:
- CNCF Graduated: Production-ready with strong governance and long-term support
- Mature & Battle-Tested: Used at scale by Uber, Red Hat, and thousands of organizations
- OpenTelemetry Compatible: Native support for OTLP ingestion
- Flexible Storage: Supports Cassandra, Elasticsearch, Kafka, and more
- Service Dependency Visualization: Automatic service topology mapping
- Adaptive Sampling: Intelligent sampling strategies for high-volume environments
Jaeger Cons:
- Tracing-only: requires separate tools for metrics and logs
- UI focused on trace exploration, limited dashboarding
- High-cardinality querying is constrained
- Operational complexity with separate collector, query, and storage components
Integration / Mitigation:
- Pairs well with Prometheus (metrics) and Loki (logs) for full observability
- OpenTelemetry Collector simplifies deployment
- Jaeger Operator automates Kubernetes deployment
- Can feed data to OpenObserve or Grafana for unified visualization
Best For:
Teams specifically focused on distributed tracing in microservices architectures who already have separate metrics and logging solutions in place.
4. Apache SkyWalking
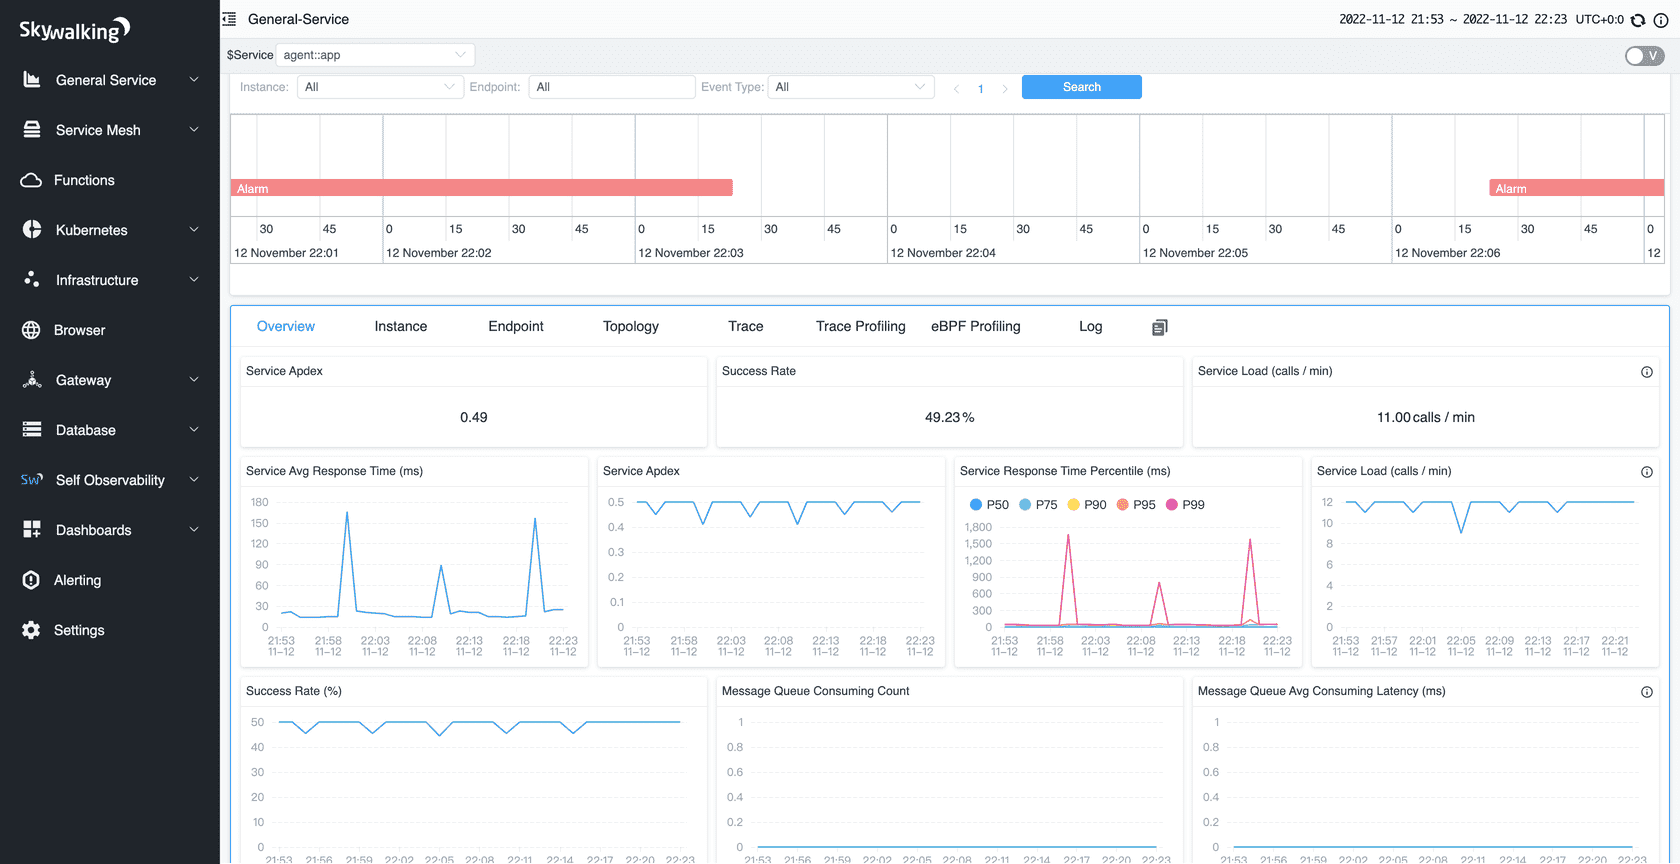
Apache SkyWalking is a full-stack APM platform designed for microservices, cloud-native, and container-based architectures. It provides automatic instrumentation, distributed tracing, metrics, and service topology visualization.
Apache SkyWalking Pros:
- Full-Stack APM: Traces, metrics, logs, and service mesh observability in one platform
- Automatic Instrumentation: Java, .NET, Node.js, Python agents with zero-code changes
- Service Topology: Automatic dependency mapping and visualization
- Low Overhead: ~3% performance impact with optimized agents
- Flexible Storage: Elasticsearch, MySQL, TiDB, BanyanDB backends
- Apache Foundation: Strong governance and enterprise adoption
Apache SkyWalking Cons:
- Primarily agent-based: less flexible than OpenTelemetry-native tools
- UI learning curve for non-Java teams
- Heavier resource requirements for full deployment
- Less active community than Prometheus/Grafana ecosystem
Integration / Mitigation:
- OpenTelemetry receiver enables hybrid instrumentation strategies
- Can integrate with Zipkin and Jaeger data sources
- Kubernetes operator simplifies deployment
- Works well for Java-heavy environments
Best For:
Teams running Java-based microservices who want comprehensive APM with automatic instrumentation and service topology visualization without manual configuration.
5. Elastic APM
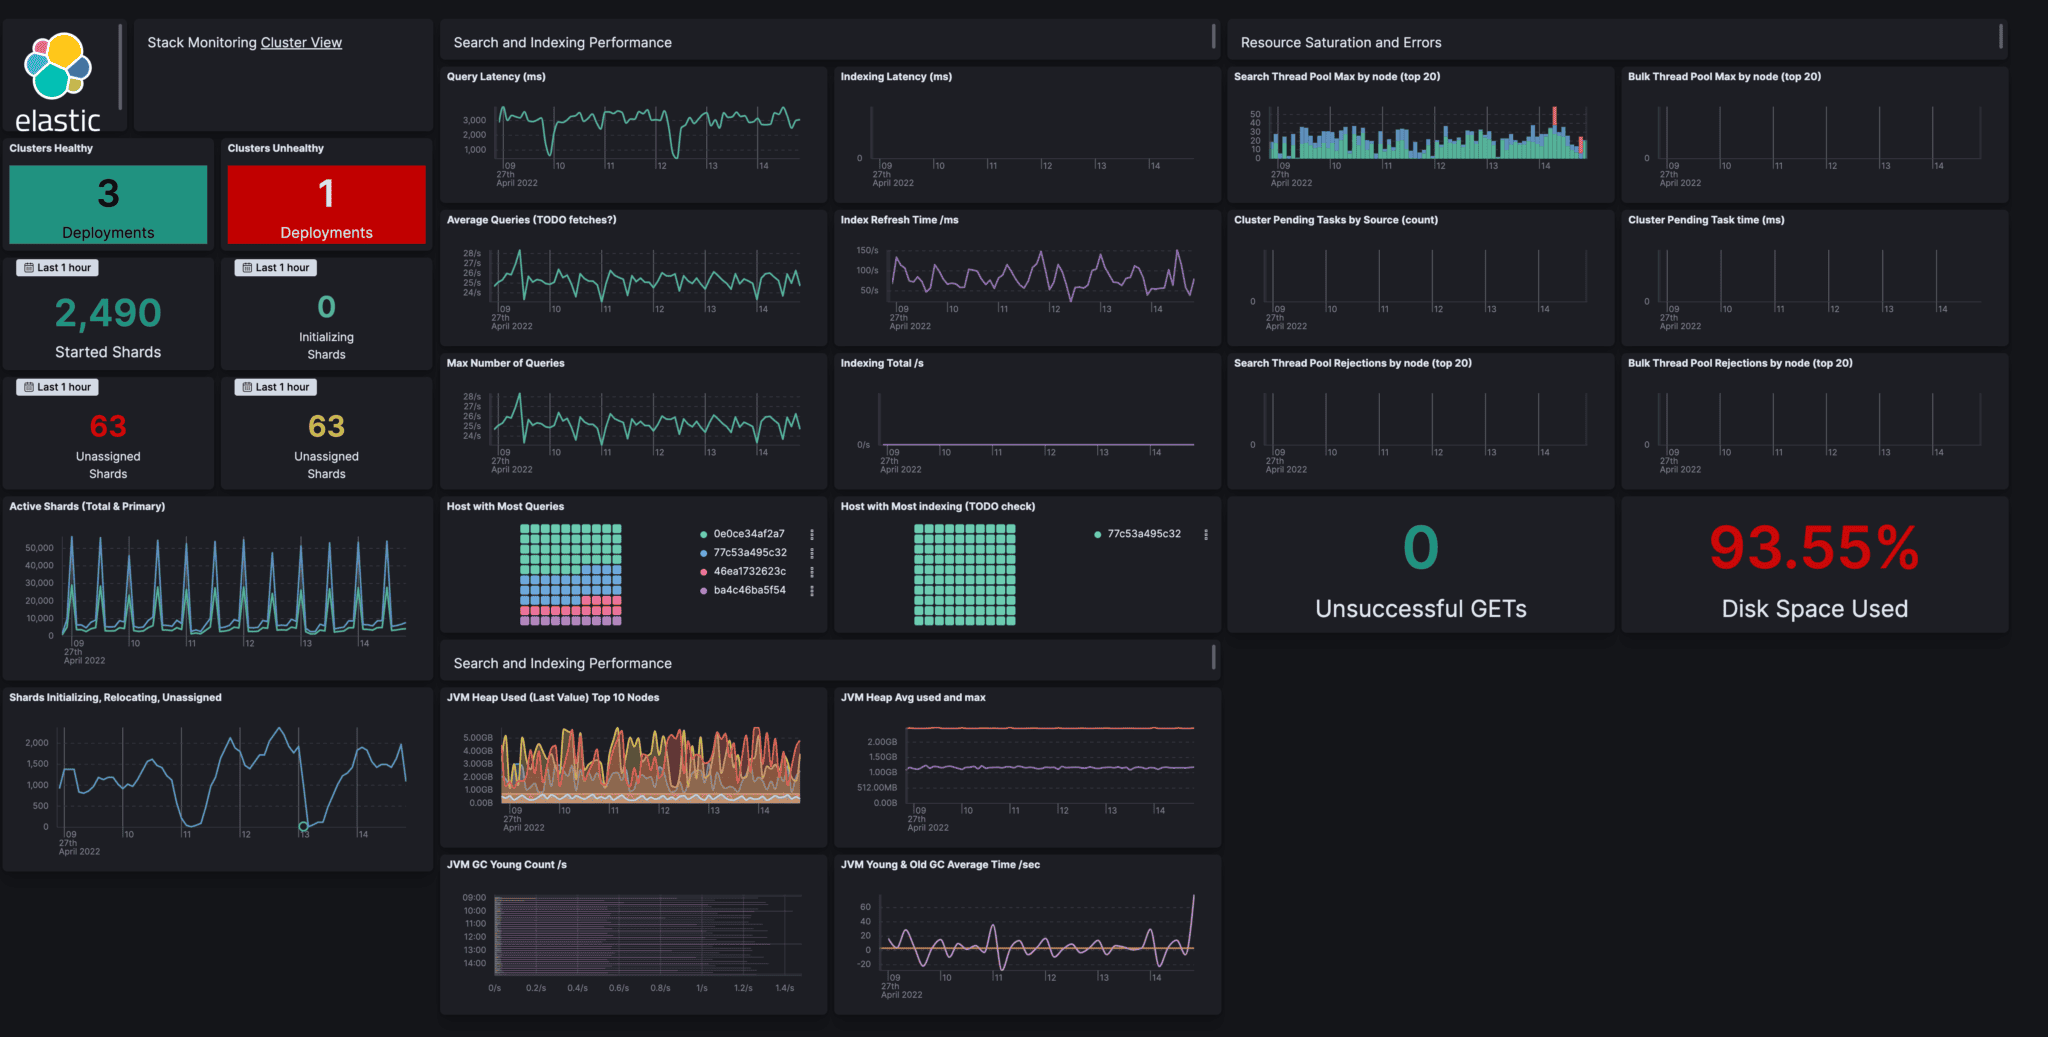
Elastic APM is part of the Elastic Observability suite, providing application performance monitoring tightly integrated with Elasticsearch and Kibana for unified log, metric, and trace analysis.
Elastic APM Pros:
- Powerful Search: Elasticsearch's full-text search capabilities for trace and log analysis
- Unified ELK Integration: Seamless correlation with logs and infrastructure metrics
- Rich Visualization: Kibana provides sophisticated dashboards and exploration
- OpenTelemetry Support: Native OTLP ingestion alongside Elastic agents
- Machine Learning: Anomaly detection and forecasting capabilities
- Mature Ecosystem: Large community and extensive documentation
Elastic APM Cons:
- Resource-intensive: Elasticsearch requires significant infrastructure
- Storage costs grow quickly at scale (dense indexing architecture)
- Complex cluster management and tuning required
- Steeper learning curve for full Elastic Stack
Integration / Mitigation:
- Elastic Cloud reduces operational burden with managed deployment
- Beats agents simplify data collection
- Can run alongside lighter tools for cost-sensitive workloads
- Fleet management centralizes agent configuration
Best For:
Organizations already invested in the Elastic Stack (ELK) who want APM capabilities integrated with existing log management and search infrastructure.
6. Zipkin
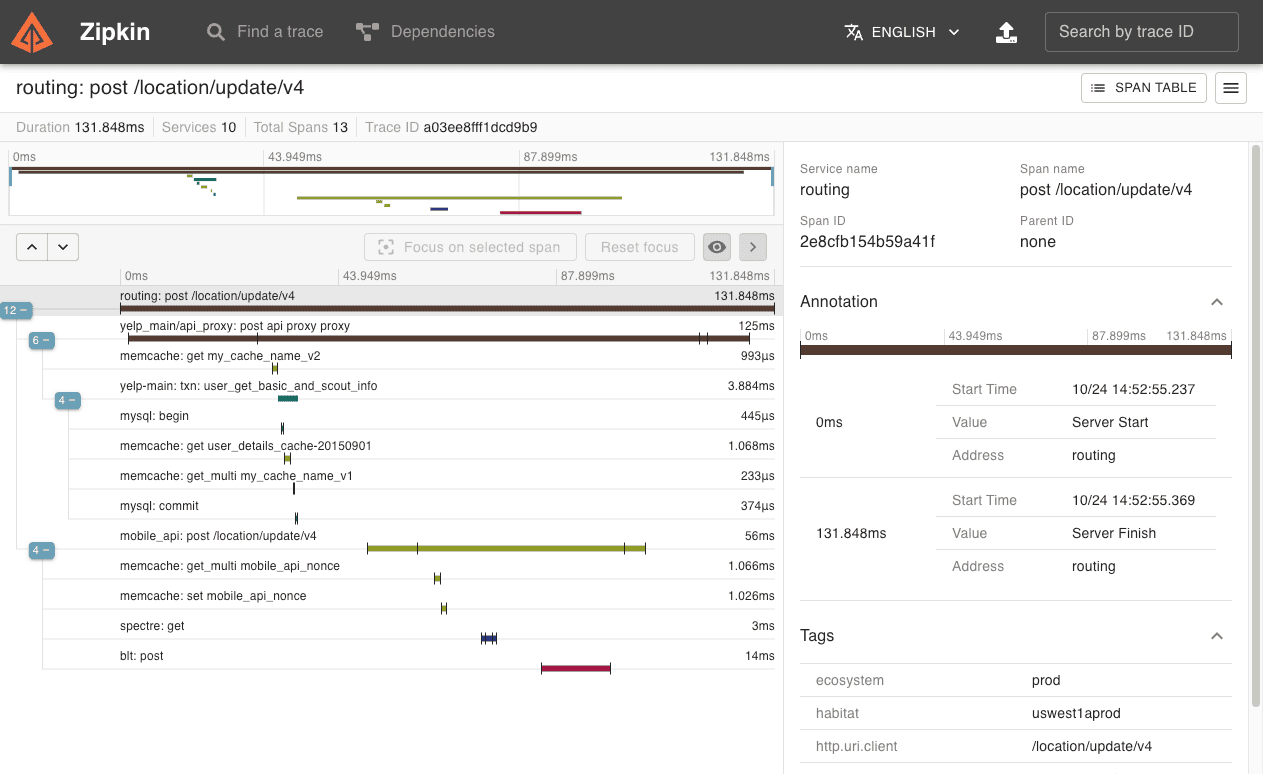
Zipkin is one of the original open source distributed tracing systems, developed by Twitter. Its intentionally simple design makes it easy to understand, deploy, and operate for teams new to distributed tracing.
Zipkin Pros:
- Simple & Lightweight: Easy to understand architecture and quick setup
- Wide Language Support: Client libraries for Java, JavaScript, Ruby, Go, and more
- Flexible Storage: In-memory, MySQL, Cassandra, Elasticsearch backends
- Educational Value: Excellent for learning distributed tracing concepts
- Low Resource Requirements: Runs efficiently on minimal infrastructure
- Stable & Mature: Years of production use with predictable behavior
Zipkin Cons:
- Limited to tracing: no metrics or log capabilities
- Basic UI with limited exploration features
- High-cardinality querying is constrained
- Feature development slower than newer alternatives
- Most production systems outgrow it quickly
Integration / Mitigation:
- OpenTelemetry Collector can export to Zipkin format
- Pairs with Prometheus and ELK for complete observability
- Good starting point before migrating to more capable tools
- Can feed data to Jaeger or other backends
Best For:
Teams new to distributed tracing who want a simple, lightweight solution for learning and small-scale deployments before adopting more comprehensive tools.
7. Prometheus
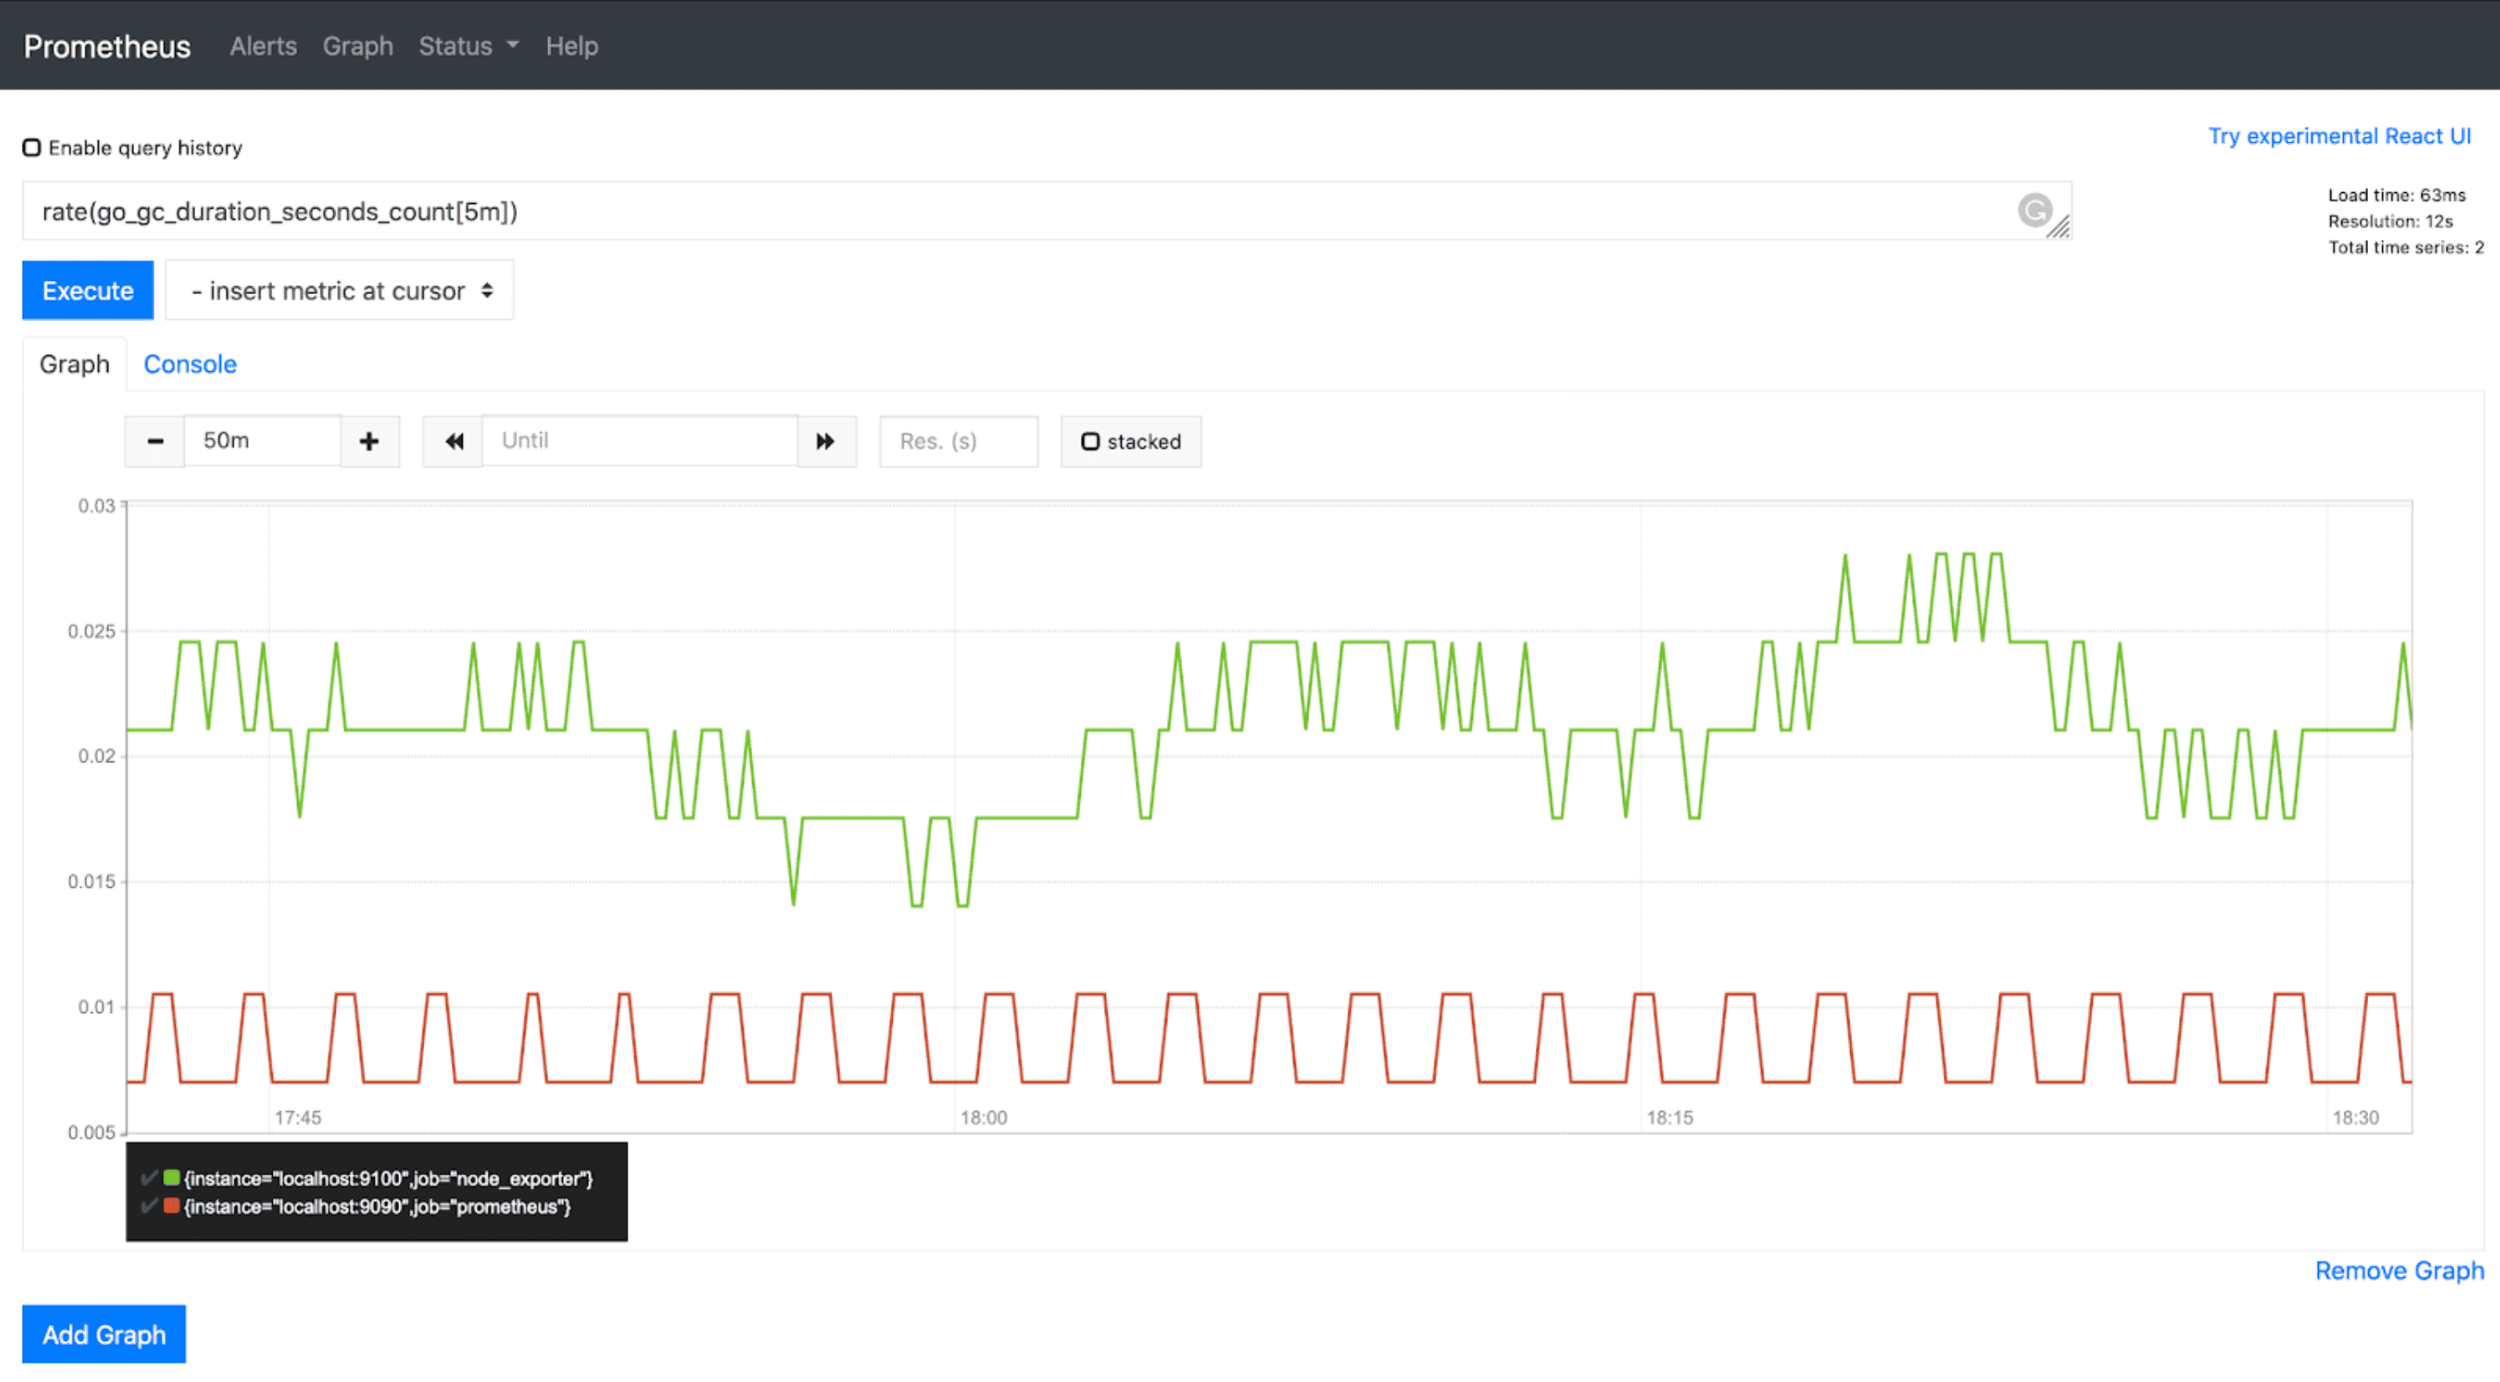
Prometheus is the CNCF-graduated monitoring system and time-series database that has become the industry standard for metrics collection, particularly in Kubernetes environments.
Prometheus Pros:
- Industry Standard: De facto choice for Kubernetes and cloud-native metrics
- Powerful Query Language: PromQL enables sophisticated metric analysis
- Pull-Based Architecture: Simplifies service discovery and configuration
- Robust Alerting: Alertmanager provides flexible notification routing
- Massive Ecosystem: Thousands of exporters for every conceivable data source
- Federation: Scale across multiple Prometheus instances
Prometheus Cons:
- Metrics-only: requires separate tools for logs and traces
- Local storage limitations for long-term retention
- No built-in high availability (requires external solutions)
- Pull model can be challenging for short-lived workloads
Integration / Mitigation:
- Remote write to Mimir, Thanos, or VictoriaMetrics for long-term storage
- OpenObserve accepts Prometheus remote write for unified observability
- Grafana provides visualization layer
- OpenTelemetry Collector can convert to Prometheus format
Best For:
Teams focused primarily on infrastructure and application metrics, especially in Kubernetes environments, who will integrate with separate logging and tracing solutions.
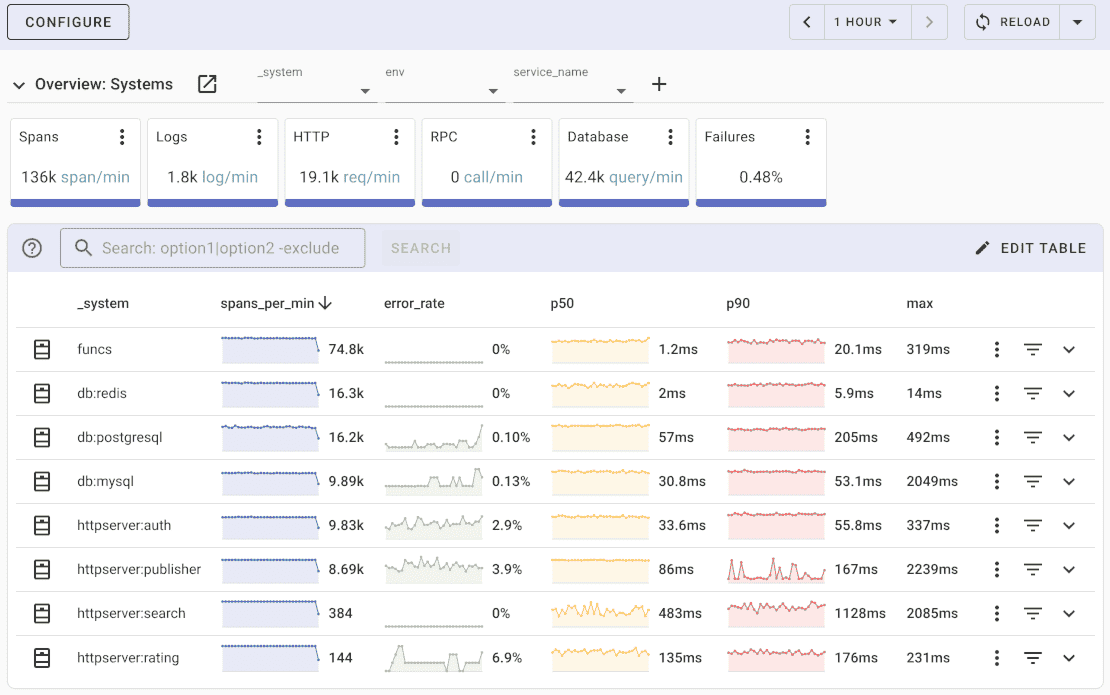
8. Uptrace
Uptrace is an OpenTelemetry-native APM tool built on ClickHouse, providing distributed tracing, metrics, and logs with a focus on performance and cost efficiency. If you're weighing ClickHouse itself as a foundation rather than through a packaged tool like Uptrace, see ClickHouse vs OpenObserve for Logs, Metrics & Traces for a direct comparison.
Uptrace Pros:
- OpenTelemetry-Native: Built from the ground up for OTLP
- ClickHouse Backend: Fast queries and efficient storage
- Unified Platform: Traces, metrics, and logs in one tool
- High-Cardinality Support: Handles complex attribute queries efficiently
- Simple Deployment: Docker and Kubernetes ready
- Self-Hosted or Cloud: Flexible deployment options
Uptrace Cons:
- Smaller community compared to Jaeger or Prometheus
- Less mature alerting capabilities
- Limited enterprise features in open source version
- Narrower integration ecosystem
Integration / Mitigation:
- OpenTelemetry Collector provides universal data collection
- ClickHouse expertise beneficial for optimization
- Docker Compose simplifies initial deployment
- Active development with regular releases
Best For:
Teams wanting an OpenTelemetry-native unified APM solution with efficient ClickHouse-based storage, particularly those comfortable with newer tools.
9. Pinpoint
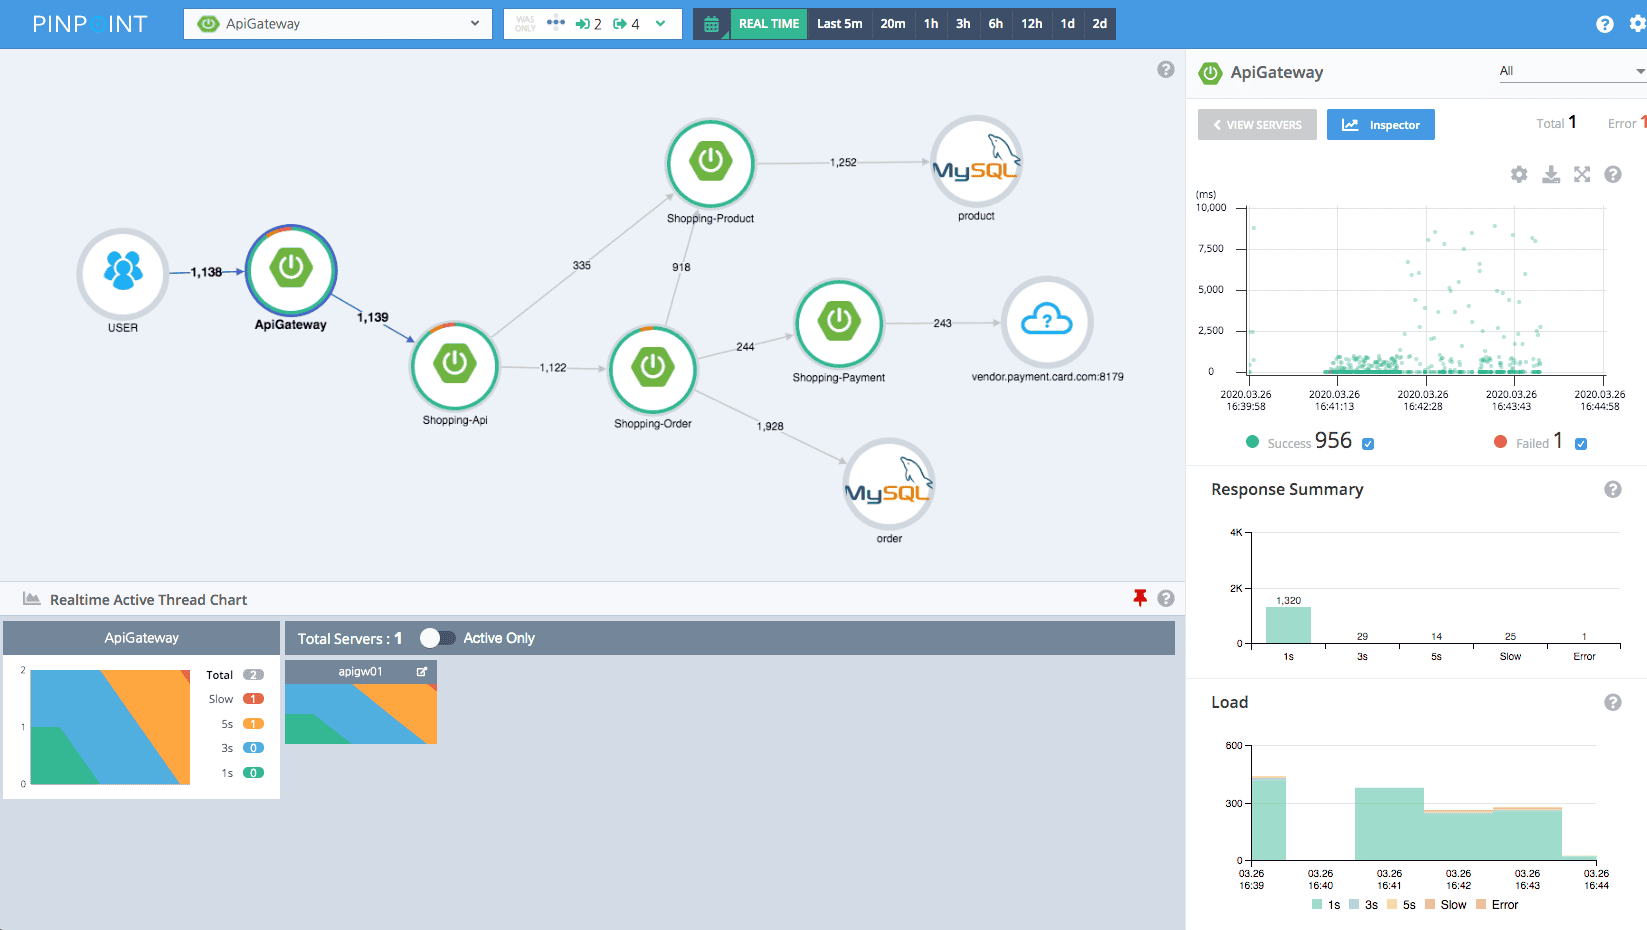
Pinpoint is an open source APM tool designed for large-scale distributed systems, with particular strength in Java and PHP application monitoring.
Pinpoint Pros:
- Deep Java APM: Bytecode instrumentation provides code-level visibility
- Low Overhead: ~3% performance impact with optimized agents
- Service Topology: Automatic dependency mapping and visualization
- Transaction Tracing: Detailed call trees and response time analysis
- No Code Changes: Agent-based instrumentation requires no application modifications
- HBase Backend: Designed for large-scale data storage
Pinpoint Cons:
- Primarily Java/PHP focused: limited support for other languages
- HBase dependency adds operational complexity
- Less active development than some alternatives
- UI can feel dated compared to modern tools
- Not OpenTelemetry-native
Integration / Mitigation:
- Best suited for Java-heavy enterprise environments
- Can complement other tools for non-Java services
- Docker deployment available for evaluation
- Active Korean community with English documentation
Best For:
Organizations running large-scale Java applications who need deep code-level APM with automatic instrumentation and can manage HBase infrastructure.
10. Coroot
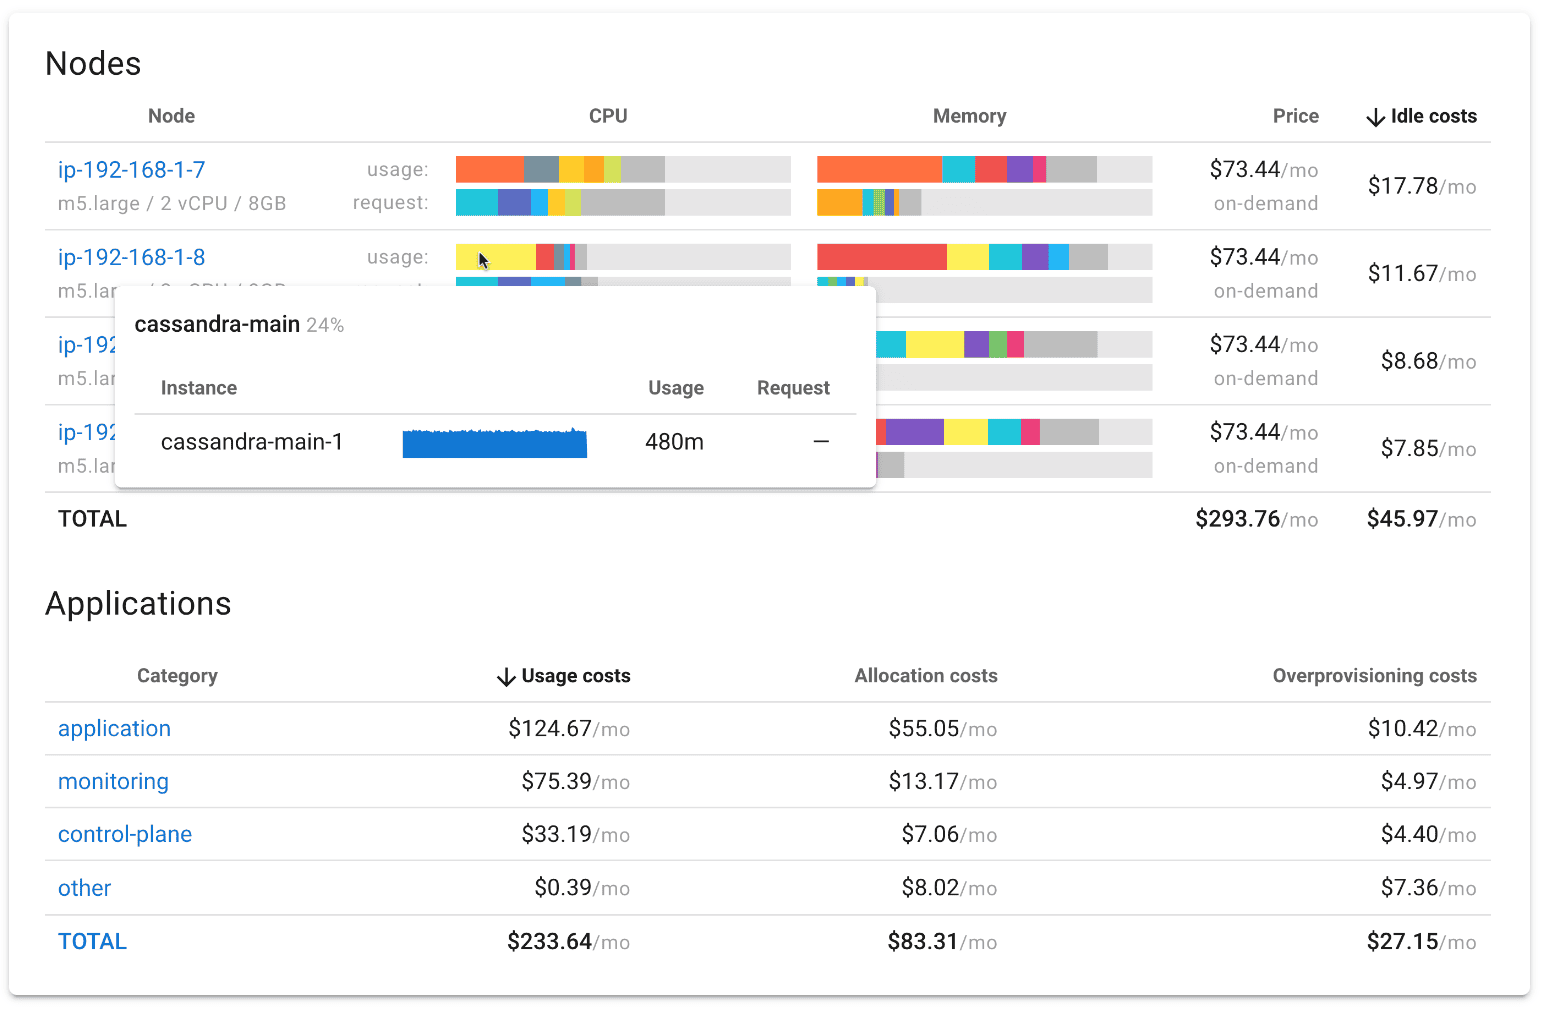
Coroot is an open source observability platform that combines metrics, logs, traces, and continuous profiling with AI-powered root cause analysis and automatic SLO monitoring.
Coroot Pros:
- AI-Powered RCA: Automatic root cause analysis reduces investigation time
- eBPF-Based: Low-overhead data collection without application changes
- Predefined Dashboards: Out-of-the-box monitoring for common scenarios
- SLO Monitoring: Built-in service level objective tracking
- Continuous Profiling: CPU and memory profiling included
- Simple Setup: Quick deployment with automatic discovery
Coroot Cons:
- Newer project with smaller community
- eBPF requires Linux kernel 4.16+
- Less flexible than fully customizable solutions
- Enterprise features in commercial version
Integration / Mitigation:
- OpenTelemetry support for custom instrumentation
- Prometheus integration for existing metrics
- Docker and Kubernetes deployment ready
- Active development with responsive maintainers
Best For:
Teams wanting quick time-to-value with automatic discovery, AI-assisted troubleshooting, and built-in SLO monitoring without extensive configuration.
Comparison Table: Top 10 Open Source APM Tools
| Tool | Metrics | Logs | Traces | APM | OpenTelemetry | Storage Backend | Best For |
|---|---|---|---|---|---|---|---|
| OpenObserve | ✅ | ✅ | ✅ | ✅ | ✅ Native | Object Storage (S3, etc.) | Unified observability with lowest storage costs |
| Grafana Stack | ✅ | ✅ | ✅ | ⚠️ | ✅ | Multiple (per component) | Maximum flexibility with modular architecture |
| Jaeger | ❌ | ❌ | ✅ | ⚠️ | ✅ Native | Cassandra, ES, Kafka | Dedicated distributed tracing |
| Apache SkyWalking | ✅ | ✅ | ✅ | ✅ | ✅ Receiver | ES, MySQL, BanyanDB | Java microservices with auto-instrumentation |
| Elastic APM | ✅ | ✅ | ✅ | ✅ | ✅ | Elasticsearch | ELK stack integration |
| Zipkin | ❌ | ❌ | ✅ | ❌ | ✅ Exporter | MySQL, Cassandra, ES | Simple, lightweight tracing |
| Prometheus | ✅ | ❌ | ❌ | ❌ | ✅ Exporter | Local TSDB | Kubernetes metrics standard |
| Uptrace | ✅ | ✅ | ✅ | ✅ | ✅ Native | ClickHouse | OTel-native unified APM |
| Pinpoint | ✅ | ❌ | ✅ | ✅ | ❌ | HBase | Large-scale Java APM |
| Coroot | ✅ | ✅ | ✅ | ✅ | ✅ | ClickHouse | AI-powered RCA with eBPF |
Open Source APM: Key Facts
- OpenObserve achieves up to 140x storage compression versus Elastic APM by using columnar Parquet format on object storage instead of Elasticsearch.
- Jaeger and Zipkin are tracing-only: no logs, no metrics. Correlating spans with system context requires additional tooling.
- Apache SkyWalking auto-instruments Java applications with no code changes, but requires HBase for production-scale deployments.
- Prometheus is the Kubernetes metrics standard but covers metrics only - logs and traces need separate tooling to complete the picture.
- Any OTel-native APM tool (OpenObserve, Uptrace, Jaeger) accepts traces from any OpenTelemetry SDK without proprietary agents.
- A single OpenObserve deployment on S3-compatible object storage can replace a commercial APM subscription at a fraction of the cost.
Try OpenObserve: Start with the open source download or sign up for OpenObserve Cloud
Related guides:
Frequently Asked Questions
About the Author
Simran Kumari

Passionate about observability, AI systems, and cloud-native tools. All in on DevOps and improving the developer experience.
Follow OpenObserve on Google
Add OpenObserve as a preferred source to see more of our articles in Google Search and Top Stories.