LLM Evals vs Observability: Why You Need Both




Ready to get started?
Try OpenObserve Cloud today for more efficient and performant observability.
TL;DR
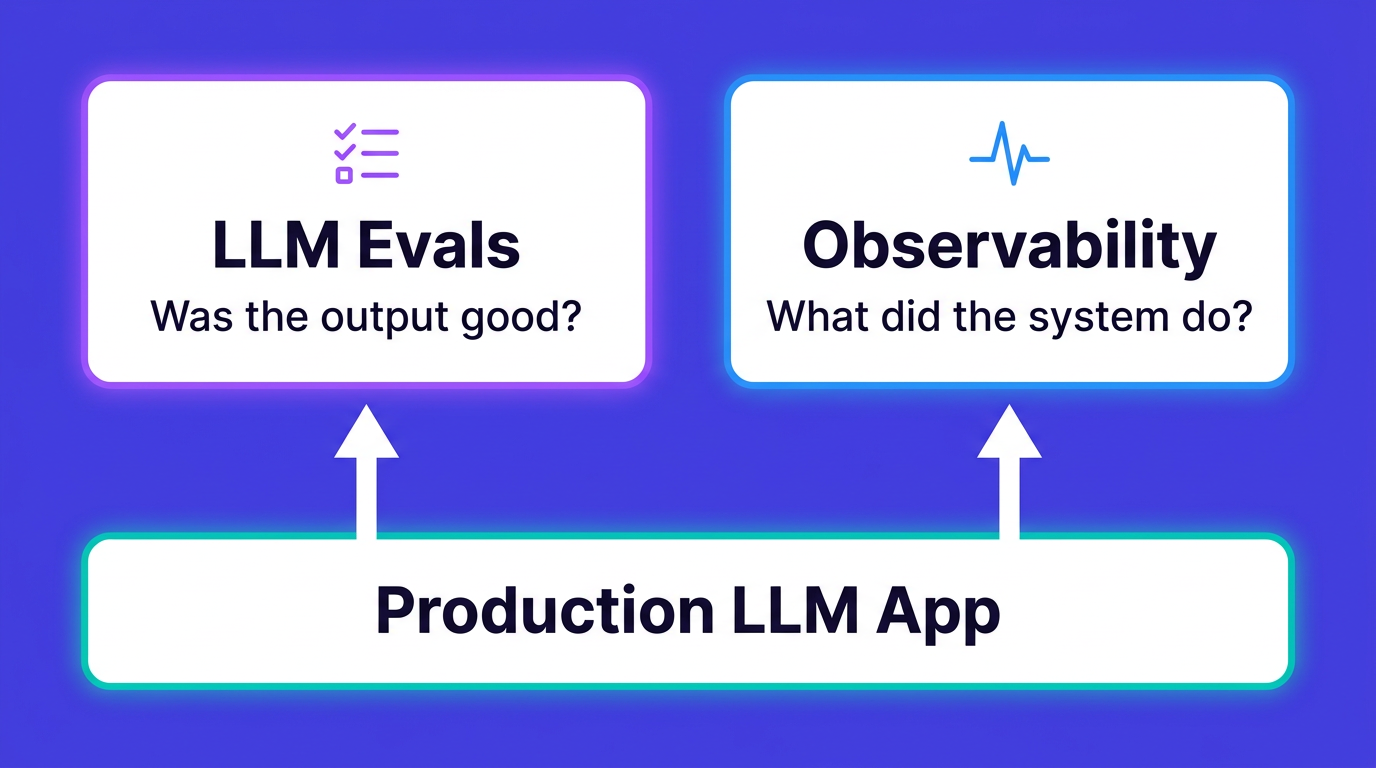
LLM evaluation and LLM observability get treated as the same discipline because the popular tools bundle them, but they answer different questions. Evals score output quality against criteria you define. Observability records what your system actually did in production. You need both, connected.
- Evals answer "was the output good." Scored on test datasets before release (offline) or on sampled live traffic (online)
- Observability answers "what did the system do." Traces, tokens, latency, cost, and errors from the running app
- Each fails alone: passing evals miss production drift; clean dashboards miss wrong answers that return HTTP 200
- The connection is the point: run LLM-as-a-judge on sampled production traces, store scores as telemetry, alert on quality like you alert on latency
- Failed production traces become new test cases, which is how the loop closes
What LLM evals actually measure
LLM evaluation is the practice of scoring a model or application's outputs against defined quality criteria. An eval takes an input, the system's response, sometimes a reference answer or retrieved context, and produces a score: correct or incorrect, grounded or hallucinated, a 1 to 5 rating on helpfulness. Run over a dataset, those scores tell you whether version B of your prompt is better than version A, or whether last week's model upgrade quietly broke your summarizer.
Two distinctions do most of the work in practice.
Model evals versus product evals. Benchmarks like MMLU score raw model capability. Almost nobody building an application needs to run those. Product evals score your system: your prompt, your retrieval pipeline, your tool calls, on inputs that look like your traffic. When people say "we need evals," they mean product evals.
Offline versus online evals. Offline evals run before release against a curated test set (often called a golden set) with known good answers. They work like regression tests: change a prompt, run the suite, compare scores. Online evals run against live production traffic, usually on a sample, usually without reference answers. Same scoring logic, different data source, and the difference matters more than most tool marketing admits.
The scoring method depends on the output. Deterministic checks (exact match, regex, JSON schema validation) work for structured outputs. Semantic similarity handles paraphrased answers. For open-ended outputs, most teams now use a model to do the scoring.
What is LLM-as-a-judge?
LLM-as-a-judge means prompting a language model with the input, the response, an optional reference, and a rubric, then asking it to score the response. It displaced classic NLP metrics like BLEU and ROUGE for one reason: those metrics measure token overlap with a reference text, and open-ended generation has no single reference. A support answer can be perfect while sharing almost no words with the golden answer.
Judges come with documented biases. They prefer longer responses, rate their own model family higher, and shift their verdict in pairwise comparisons based on the order the options appear in. The practical mitigations: use a rubric with concrete criteria rather than "rate this 1 to 10," calibrate the judge against a small human-labeled set before trusting it, and read score deltas over time rather than absolute values. Judge scores are noisy instruments that are still far better than no instrument.
What LLM observability covers
LLM observability is the telemetry side: capturing what your application did in production as traces, metrics, and logs. A single user interaction becomes a trace; each model call, retrieval, and tool invocation becomes a span carrying attributes like model name, token counts, latency, and cost. We covered the full scope in what LLM observability is and why APM misses LLM failures, so here is the short version.
Observability answers operational questions. Which requests are slow, and which span inside them is the bottleneck? What did we spend on tokens yesterday, per feature and per user? Which prompt version was live when this complaint came in? What did the model actually receive after prompt assembly? When an agent looped six times before answering, what did each iteration do? Monitoring AI agents in production is mostly this discipline applied to longer, messier traces.
The instrumentation layer is converging on the OpenTelemetry GenAI semantic conventions, which define standard span attributes (gen_ai.request.model, gen_ai.usage.input_tokens, and friends) so LLM telemetry works in any OpenTelemetry backend instead of one vendor's SDK. If you are instrumenting from scratch, start there; our guide to OpenTelemetry for LLMs walks through the details.
Notice what is missing from every question in this section: whether the answer was any good. Observability data contains no quality signal unless you put one there. That is the boundary.
Where do evals end and observability begin?
The confusion between the two is recent and mostly commercial. Langfuse and LangSmith are tracing-first platforms with eval features layered on; Braintrust and Confident AI are eval-first platforms that added tracing; Datadog's Agent Observability product (formerly LLM Observability) ships hallucination and prompt-injection evals inside an observability product. Every vendor now sells a blurry superset, which is convenient for them and confusing for anyone trying to reason about what they actually need. We compared how the point tools slice this in OpenObserve vs Langfuse.
Strip the marketing away and the boundary is clean:
| LLM evals | LLM observability | |
|---|---|---|
| Question answered | Was the output good? | What did the system do, and what did it cost? |
| When it runs | Before release (offline) and on sampled traffic (online) | Continuously, on every request |
| Data it needs | Inputs, outputs, rubrics, often reference answers | Traces, spans, tokens, latency, errors |
| Unit of work | A scored test case | A trace |
| Catches | Quality regressions, hallucinations, rubric violations | Latency spikes, cost anomalies, failures, loops |
| Fails to catch | Anything about traffic you did not sample or test | Anything about correctness |
| Analogy | Test suite plus code review | APM plus logging |
The analogy in the last row is the useful mental model. Nobody argues about whether you need tests or APM for a normal service. You need both because they catch disjoint failure classes. The only reason the question even comes up for LLM apps is that the tooling grew up tangled.
What each one misses on its own
Both halves have a characteristic blind spot, and each one's blind spot is the other one's job.
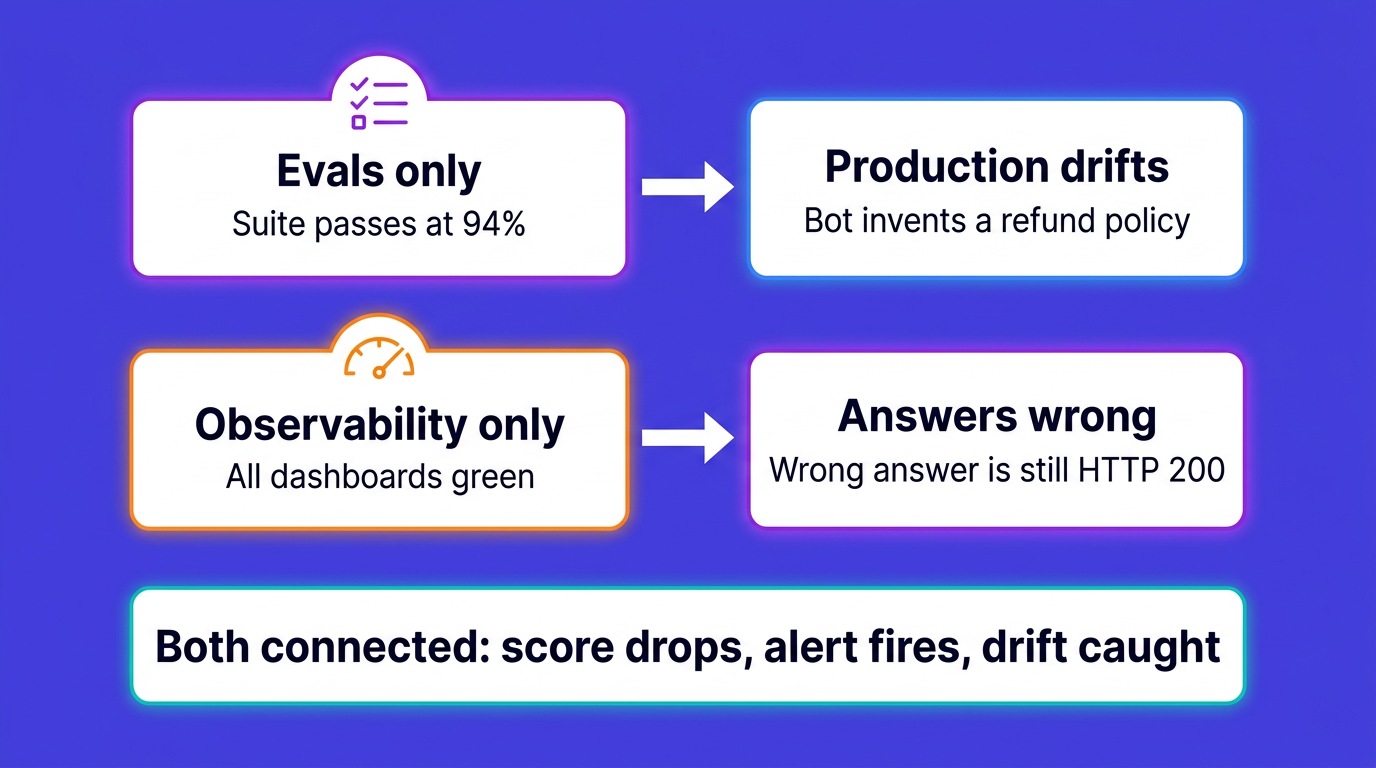
Evals without observability. Your offline suite passes at 94 percent, and production is quietly degrading. Your model provider updated the underlying model behind the same API name, and its tone shifted enough to tank your formatting instructions. Or your retrieval index went stale, so the model grounds its answers in outdated documents: every individual component works, the eval set (built six months ago) still passes, and real users get wrong answers about your current pricing. Offline evals score the traffic you predicted, and production is where the traffic you did not predict lives. Without tracing, you also have no way to debug a bad score: you know the answer was wrong, and nothing about which retrieval, prompt version, or tool call made it wrong.
Observability without evals. Every dashboard is green. Latency p95 is 1.8 seconds, error rate is 0.2 percent, token spend is on budget. Meanwhile your support bot has been confidently inventing a refund policy for three days, and the first signal you get is a customer escalation, because a hallucinated answer is an HTTP 200 like any other. Infrastructure signals cannot distinguish a correct answer from a fluent wrong one; the best practices for LLM monitoring all converge on this point. Cost tracking has the same gap in reverse: token spend monitoring tells you a request cost 40,000 tokens, and only a quality signal tells you whether that expensive agent run produced anything useful.
Running evals on production traffic
This is where the two disciplines physically meet, and it is the part most "evals vs observability" articles skip. The pattern is simple to state: sample production traces, score them asynchronously, and store the scores next to the traces they describe.
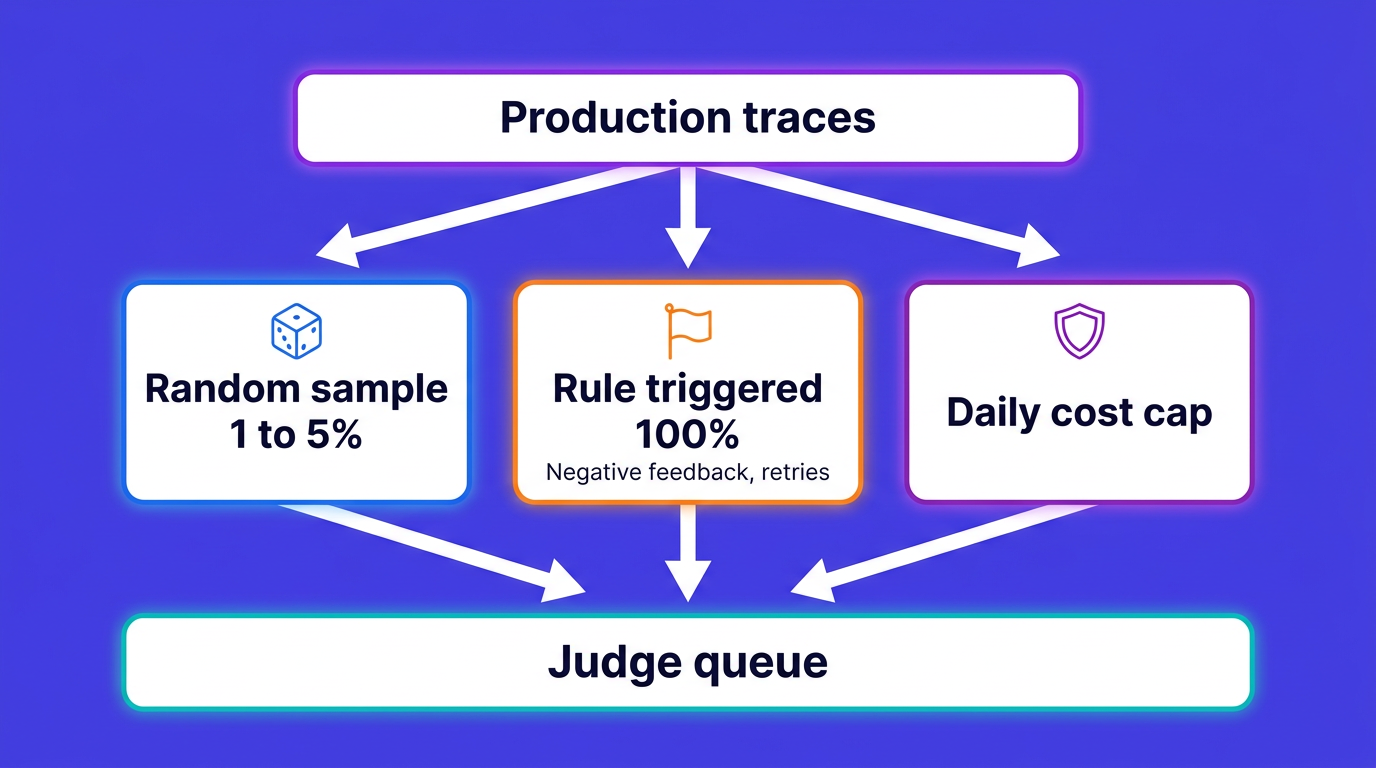
Sampling, because scoring everything is a waste. A judge call costs real tokens. Score 100 percent of a high-traffic app and your evaluation bill can rival your inference bill, for no statistical benefit; quality trends are visible at low sample rates. A sane starting policy has three parts:
- A random baseline sample, 1 to 5 percent of traces, for unbiased trend lines
- Rule-triggered sampling at 100 percent for high-signal slices: traces with negative user feedback, retries, unusually long outputs, or new prompt versions
- A cost cap, so a traffic spike cannot multiply your judge spend
The arithmetic stays manageable. At 100,000 requests a day, a 2 percent sample is 2,000 judge calls. At roughly 1,500 tokens per call (context plus response plus rubric), that is about 3 million judge tokens a day. Priced with a small judge model, that lands in single-digit dollars a day; check it against your provider's current per-million-token rates rather than any number in a blog post. The lever that matters is judge model size: use a small, fast model for continuous scoring, and reserve a frontier model for the calibration set.
Asynchronous, because the request path is sacred. An inline judge adds a full model call to user-facing latency. Unless you are building a guardrail that must block bad output before the user sees it (a different problem, with different latency budgets), score out of band: a worker reads recent traces from the observability backend, judges them, and writes scores back. Minutes of delay is fine for a quality trend line.
Scores stored as telemetry, because that closes the loop. This is the step that turns two tools into one system. A judge score written back as a metric or log stream, keyed by trace ID, becomes queryable and alertable exactly like latency. "Alert when mean groundedness over the last hour drops below 4.2" is the quality equivalent of a p95 alert, and it works in any backend that can alert on a stream.
On OpenObserve Enterprise this whole loop is a built-in feature (the eval jobs, scorers, and score configs shown later in this post); the worker below is what that pipeline does under the hood, and what you run yourself on the open source edition or any other backend. A minimal version of the whole pattern:
import random
import time

import requests

O2_BASE = "https://api.openobserve.ai/api/your_org_slug"
AUTH = ("you@example.com", "your_token")

 # 1. Pull the last 15 minutes of LLM spans ("default" is the traces stream)
now_us = int(time.time() * 1_000_000)
body = {
    "query": {
        "sql": "SELECT trace_id, gen_ai_input_messages, gen_ai_output_messages "
               "FROM default "
               "WHERE gen_ai_operation_name = 'chat'",
        "start_time": now_us - 15 * 60 * 1_000_000,
        "end_time": now_us,
        "size": 1000,
    }
}
hits = requests.post(f"{O2_BASE}/_search?type=traces",
                     json=body, auth=AUTH).json()["hits"]

 # 2. Sample, then score each trace with a small judge model (any provider)
scores = [{
    "trace_id": t["trace_id"],
    "groundedness": judge_groundedness(t),   # your judge call, returns 1-5
    "judge_model": "your-small-judge-model",
    "rubric_version": "v3",
} for t in random.sample(hits, min(50, len(hits)))]

 # 3. Write scores back as their own stream, joinable on trace_id
requests.post(f"{O2_BASE}/llm_eval_scores/_json", json=scores, auth=AUTH)
Fifty lines of glue in production versions, and it converts "we have traces" plus "we have a judge prompt" into a quality signal on live traffic.
One prerequisite trips up almost everyone: message content capture is opt-in. By default, OpenTelemetry GenAI instrumentation records token counts, model names, and latency, but not the prompt and response text; a real ingested span carries gen_ai_usage_input_tokens and gen_ai_request_model with no message content anywhere. The judge needs the text, so enable content capture in your instrumentation (the OTEL_INSTRUMENTATION_GENAI_CAPTURE_MESSAGE_CONTENT environment variable in most GenAI instrumentation libraries) to get the gen_ai.input.messages and gen_ai.output.messages attributes onto the span. OpenObserve flattens those into gen_ai_input_messages and gen_ai_output_messages columns at ingest, which is what the worker above selects. Content is opt-in for a reason: prompts can carry customer data and PII, so decide on redaction and retention before you flip it on.
A reference architecture that does both
Putting the pieces in one diagram, the loop has five stages and stays vendor-neutral: every arrow is OpenTelemetry or a plain HTTP API.
- Instrument the app with OpenTelemetry GenAI conventions, via manual spans or a library like OpenLLMetry, and export traces over OTLP
- Store traces in an observability backend alongside your logs, metrics, and infrastructure traces, so an LLM latency spike can be correlated with the GPU node it ran on
- Score sampled traces asynchronously with the eval worker pattern above; offline, keep running your golden-set suite in CI on every prompt or model change
- Feed back: eval scores land as a stream in the same backend, dashboards plot quality next to latency and cost, and alerts fire on quality regressions
- Curate: traces that scored badly or got negative user feedback are exported into the offline golden set, so next quarter's regression suite contains this quarter's real failures
Stage 5 is the one teams skip and the one that compounds. Your test set stops being a guess about production and starts being a record of it. A prompt change that would reintroduce March's hallucination bug now fails CI in April.
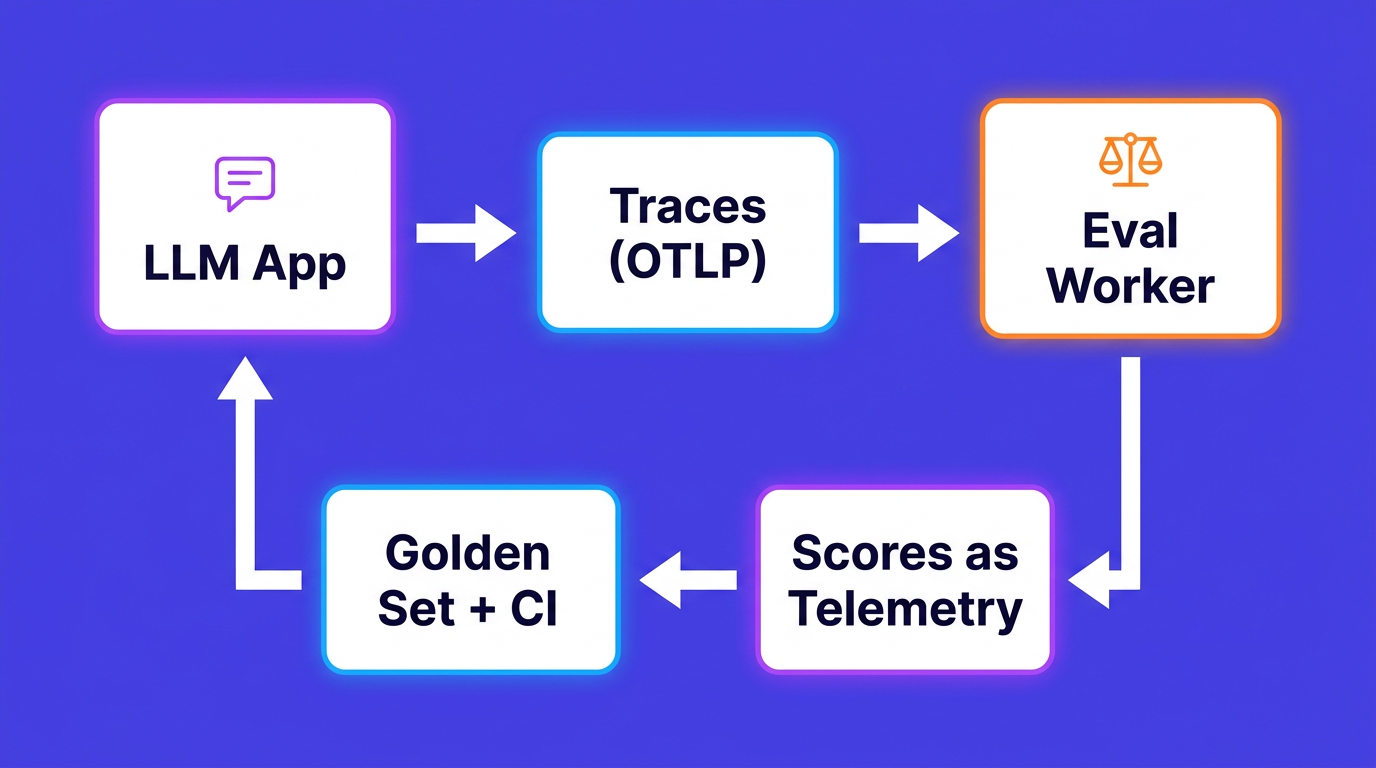
Tooling maps onto the architecture rather than replacing it. An eval library (DeepEval, Ragas, Evidently, or a hand-rolled judge prompt) owns stage 3's scoring logic. The observability backend owns stages 2 and 4. Point tools like Langfuse and LangSmith bundle both stages for LLM traffic only, which works until you want quality metrics next to the rest of your production telemetry; the tool roundup covers who does which half honestly.
How OpenObserve does both LLM evaluation and observability
OpenObserve is an open source (AGPL-3.0) observability platform that covers the architecture's observability half natively: it ingests OpenTelemetry GenAI traces over OTLP next to your logs, metrics, and other traces, and any eval score you write to a stream becomes dashboardable and alertable with SQL. The AI section of the UI reads those gen_ai spans directly:
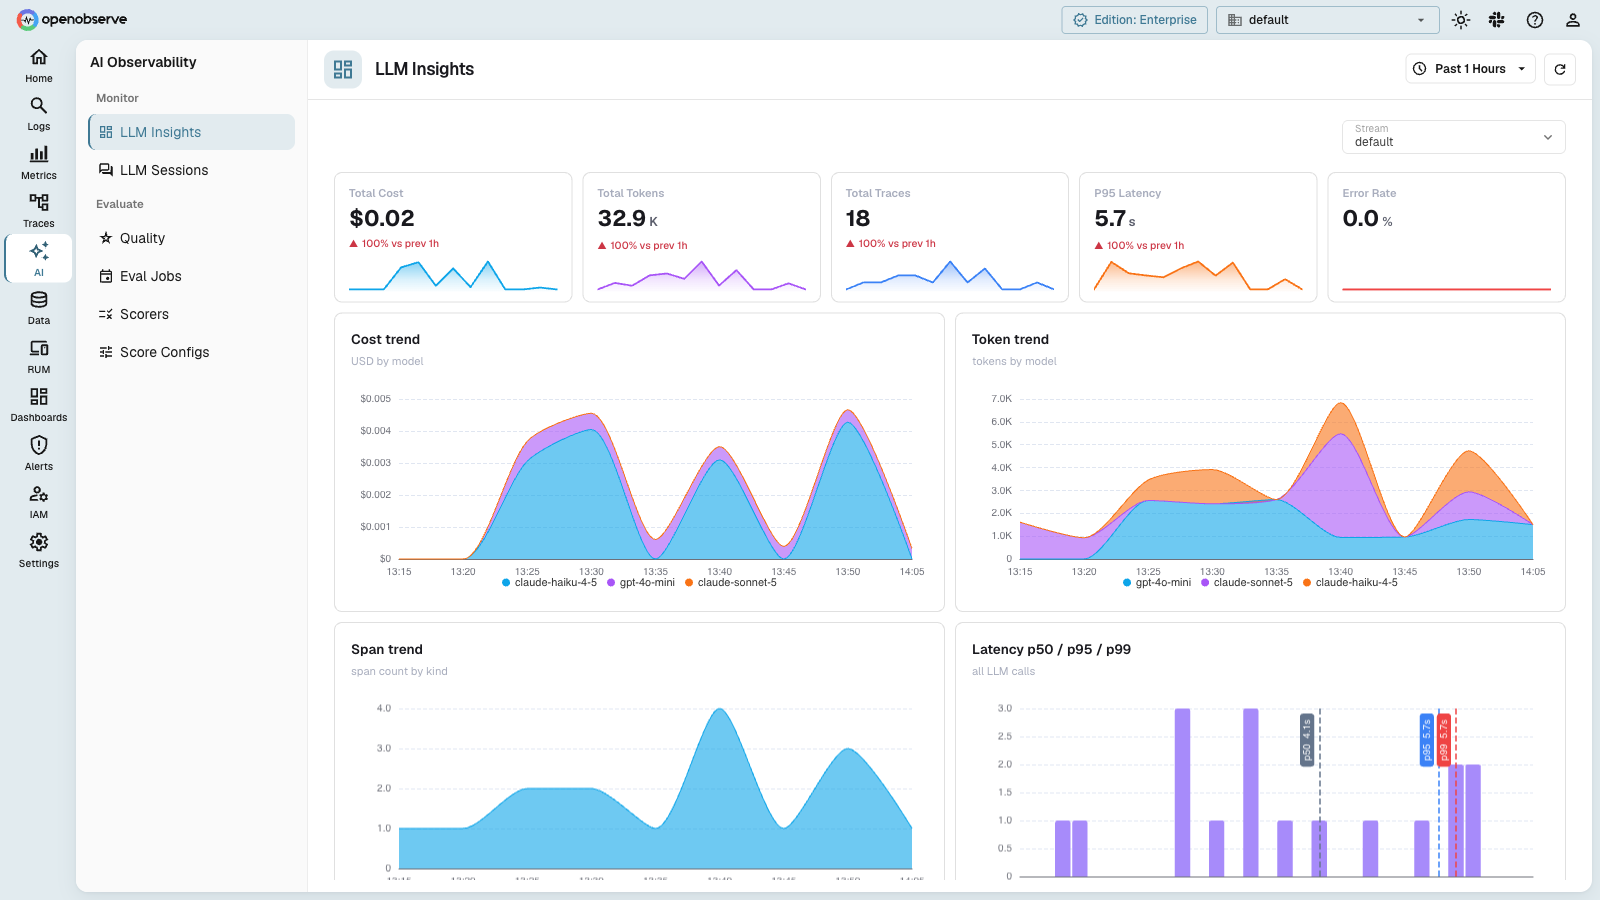 The LLM Insights dashboard, built from the same gen_ai spans the eval worker samples: total cost, tokens, traces, p95 latency, and error rate up top, with cost, token, and latency trends broken down by model underneath.
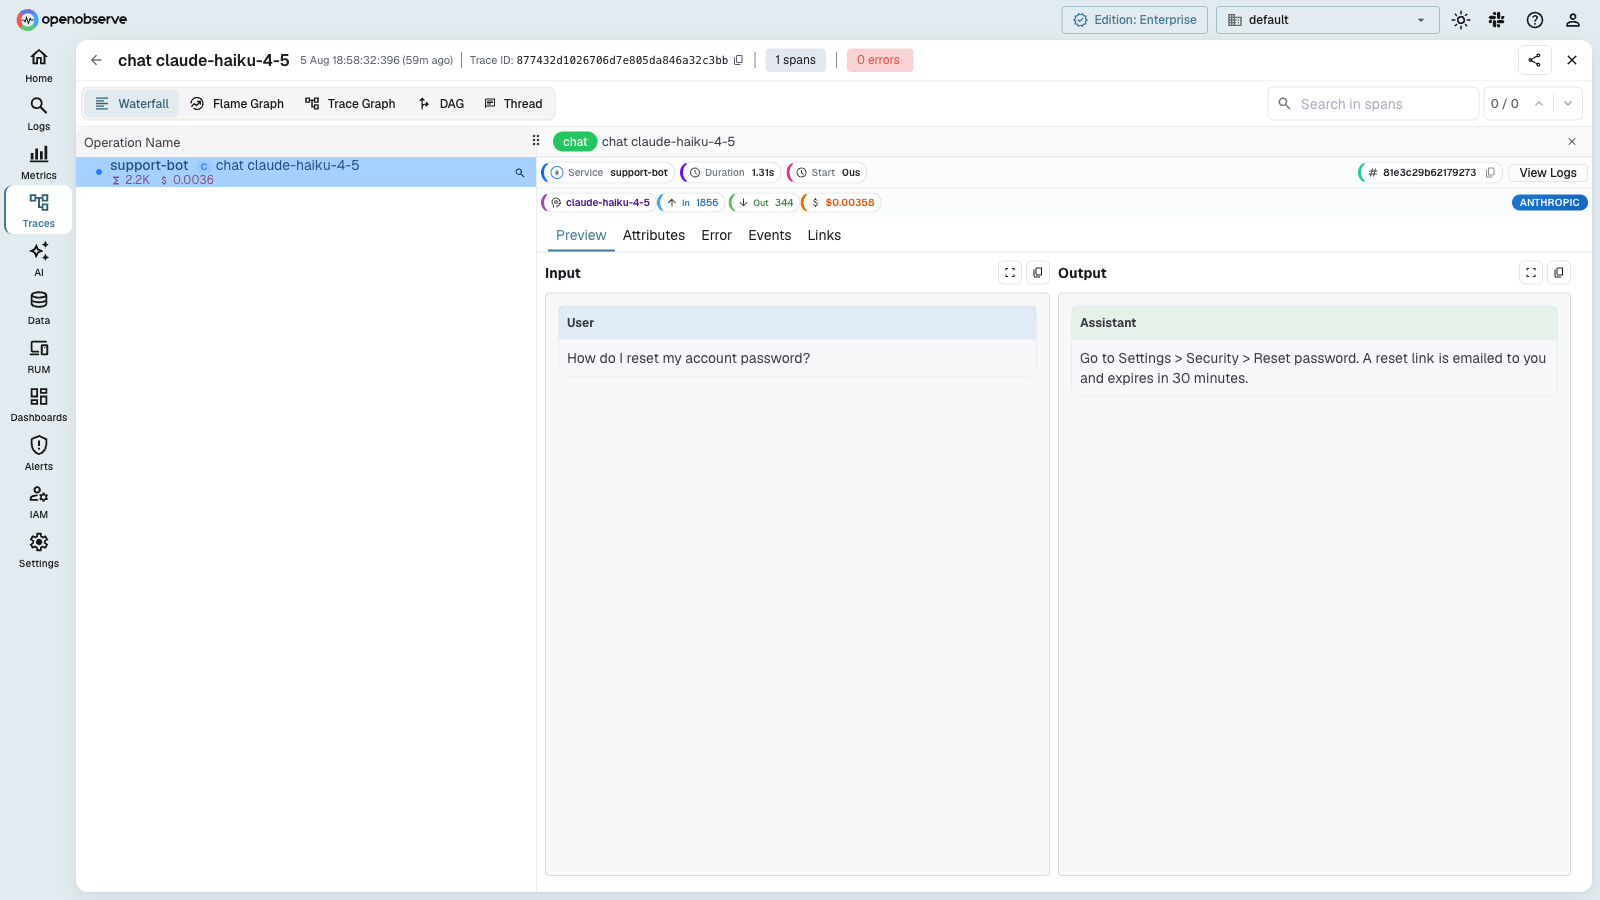 A single chat span in the trace view. The Preview tab renders
 gen_ai_input_messages and gen_ai_output_messages as a conversation, with the model, token counts, and per-call cost on the span header. This is the trace a bad judge score links back to when you debug it.
On the enterprise tier it also covers the connection itself. Online Evaluations runs scorers against incoming LLM traces automatically: a score config defines the shape of a score and its healthy threshold, a scorer holds the judge prompt and model, and an eval job binds scorers to a stream with a sampling policy. Scores land in a dedicated stream, queryable and alertable like anything else you ingest.
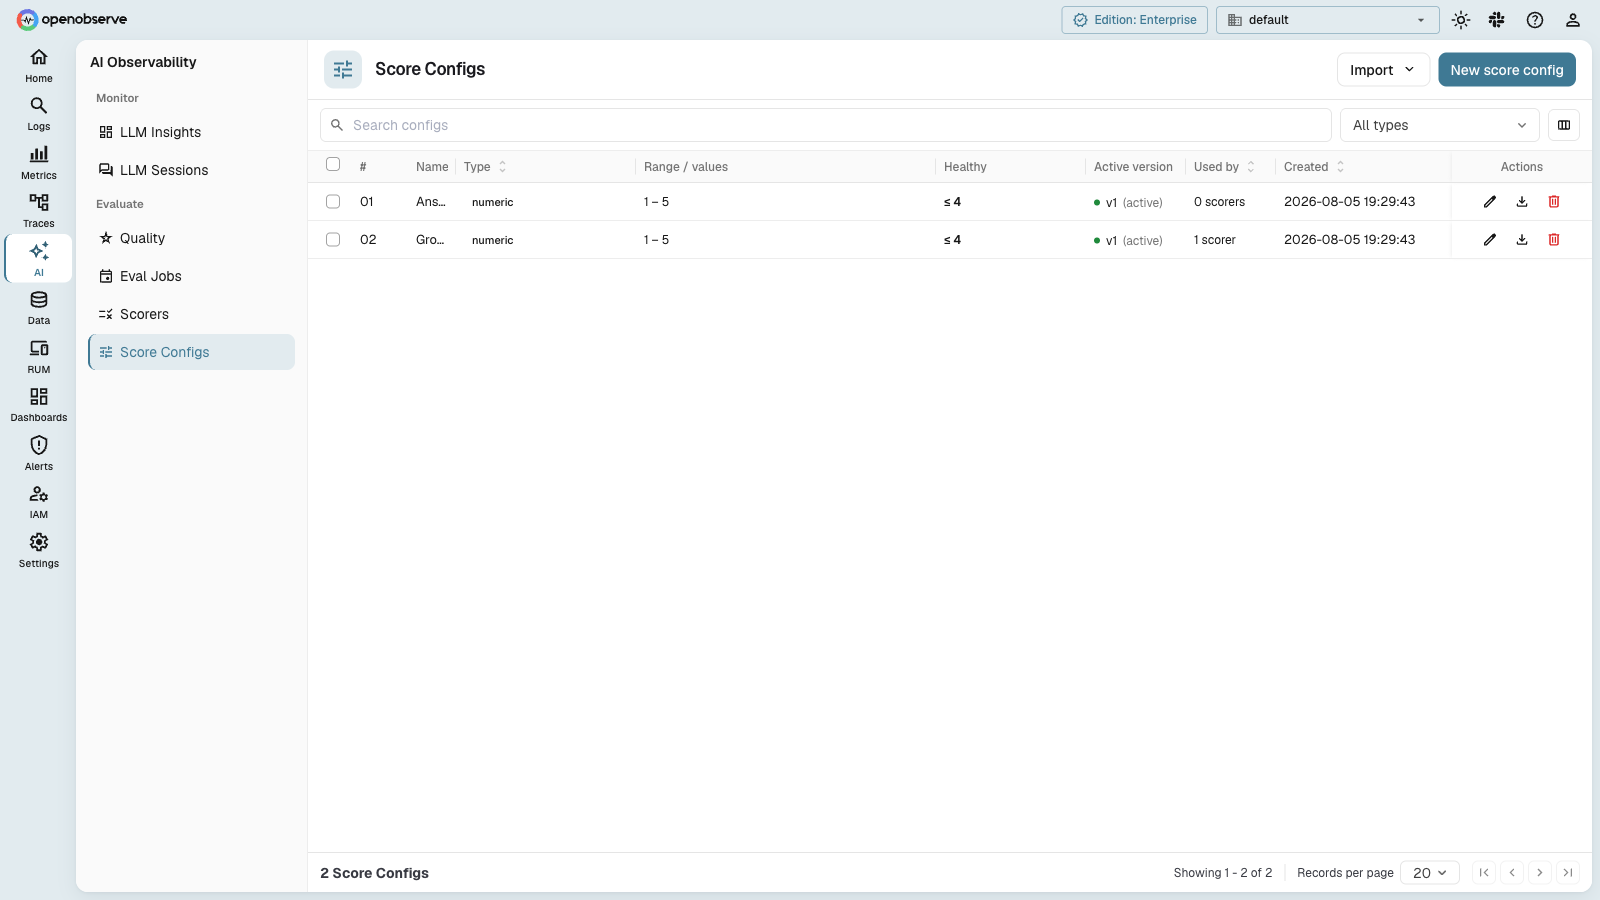 Score configs define what a score looks like before anything computes it: numeric on a 1 to 5 range here, with a healthy threshold and explicit versioning, so a rubric change becomes a new version instead of silent drift.
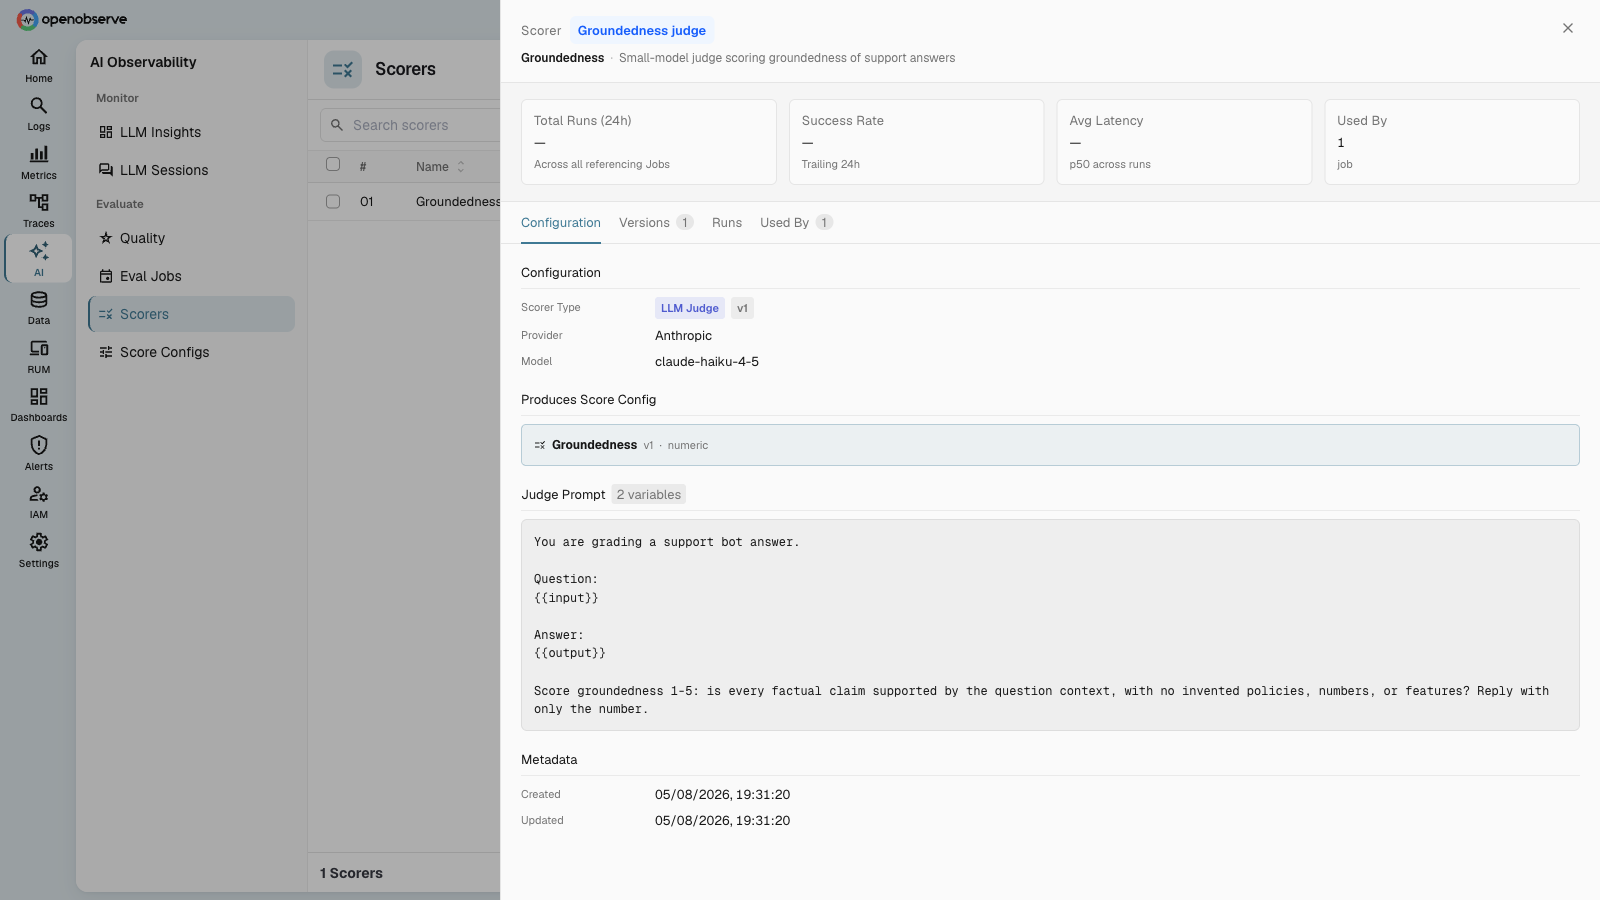 An LLM-as-a-judge scorer: the judge prompt with its {{input}} and {{output}} variables, the provider and judge model it runs on, and the score config it produces. This is the managed version of the judge_groundedness call in the worker snippet above.
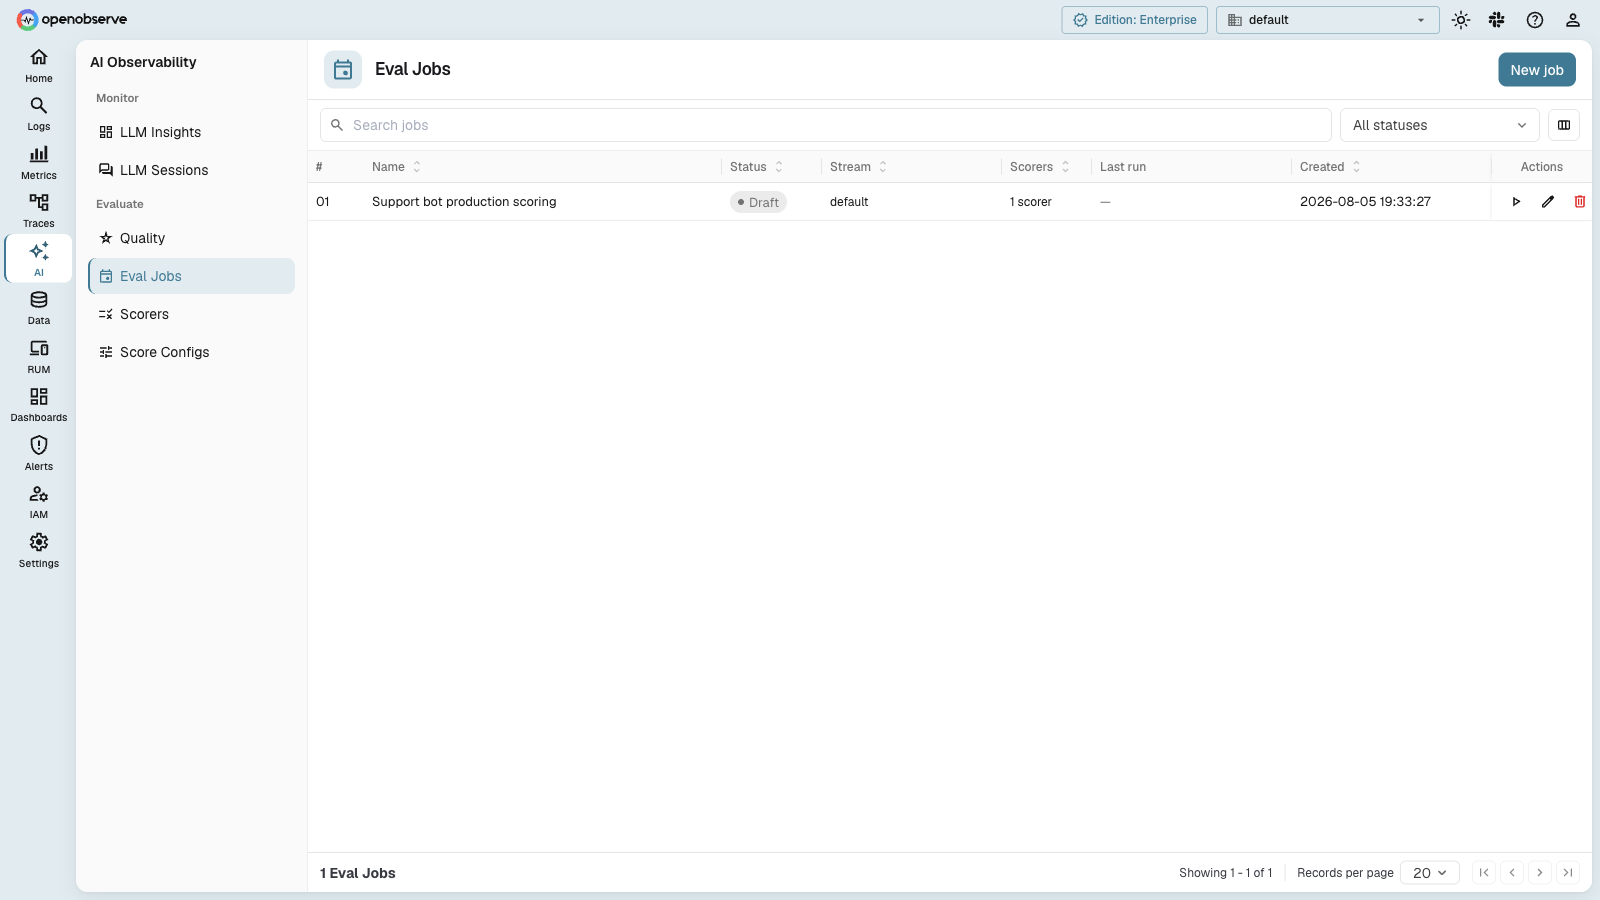 An eval job ties the pieces together: which stream to watch, which scorers to run, and how much to sample. Activating it creates a system-managed pipeline that does what the worker snippet does, continuously and without your own scheduler.
It does not do offline experimentation, prompt playgrounds, or dataset management; pair it with an eval library for those, and let the scores land back in the same place as everything else.
Put a quality signal on your production traffic
If your LLM traces are already flowing (or could be, with an afternoon of OpenTelemetry setup), the eval loop in this post is a weekend project on top of them. OpenObserve Cloud ingests OTLP traces out of the box, and the 14 day free trial needs no credit card, so you can ship gen_ai spans today, add a sampled judge worker tomorrow, and put a groundedness chart next to your latency chart by Monday.
Frequently Asked Questions
About the Author
Gorakhnath Yadav


Gorakhnath is a passionate developer advocate, working on bridging the gap between developers and the tools they use. He focuses on building communities and creating content that empowers developers to build better software.
Follow OpenObserve on Google
Add OpenObserve as a preferred source to see more of our articles in Google Search and Top Stories.