OpenObserve vs SigNoz: Which Open Source Observability Platform Should You Choose? (2026)




Ready to get started?
Try OpenObserve Cloud today for more efficient and performant observability.
TL;DR
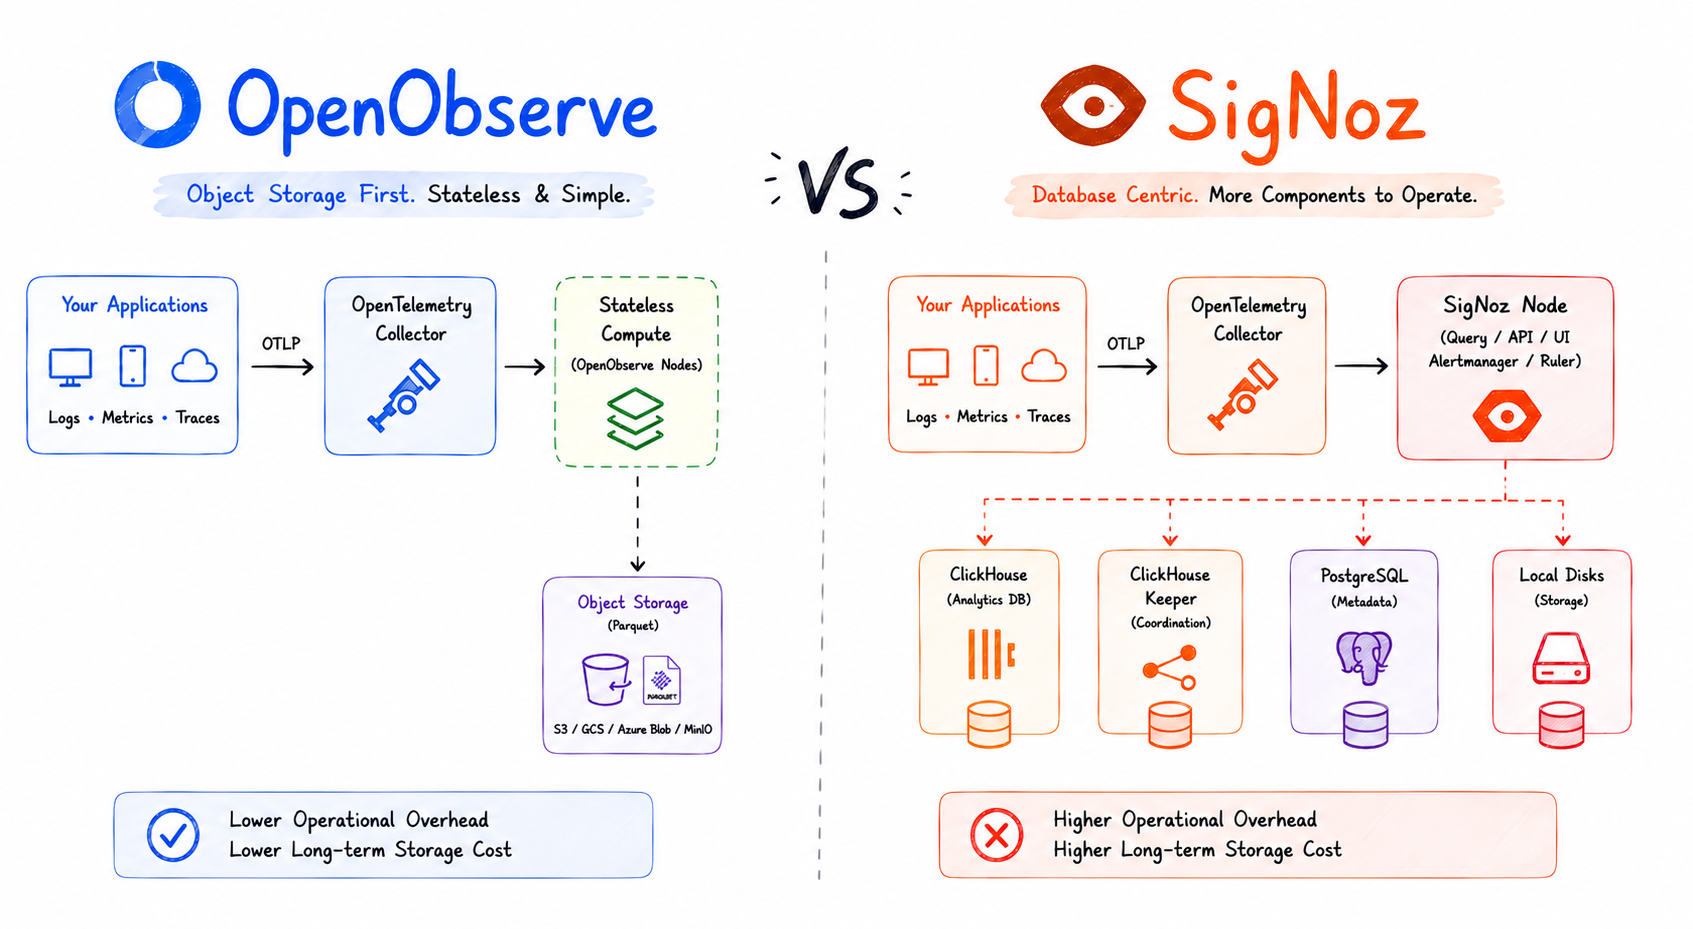
OpenObserve vs SigNoz comes down to one architectural choice: where your telemetry lives. Both are open-source, OpenTelemetry-native platforms covering logs, metrics, traces, dashboards, and alerts. SigNoz stores everything in ClickHouse on disk; OpenObserve stores everything as compressed Parquet on object storage (S3, GCS, Azure Blob, MinIO) with stateless compute, and that one decision drives most of the differences below.
- Self-hosting: OpenObserve is a single binary, no database to run. SigNoz means operating a ClickHouse cluster (plus ClickHouse Keeper for coordination and PostgreSQL for metadata), including known ClickHouse pain points at observability's ingest volume: merge pressure from streaming inserts, slow async mutations for deletes, and compute and storage scaling together instead of independently.
- Retention cost: object storage runs at commodity rates, so months of history doesn't mean provisioning more disk the way it can on ClickHouse.
- Query speed: OpenObserve's engine is in the same family as ClickHouse's, vectorized columnar execution (Apache Arrow and DataFusion) over Parquet, with hot data cached in memory and on local disk, so object storage doesn't mean slow queries.
- Query language: standard SQL (usable across logs, metrics, and traces alike) plus PromQL on OpenObserve; a query builder, ClickHouse SQL, and PromQL on SigNoz.
- RUM: OpenObserve ships session replay built in; SigNoz covers Web Vitals only.
- Fair to SigNoz: it's open source (MIT) and OTel-native, same as OpenObserve (AGPL-3.0); it also supports PromQL for metrics and ships a native Log Pipelines UI for logs, and a team already fluent in ClickHouse SQL will be productive with it.
The rest of this guide backs each point with numbers: architecture, pricing, self-hosting overhead, RUM, query language, licensing, and migration.
OpenObserve vs SigNoz at a Glance
| OpenObserve | SigNoz | |
|---|---|---|
| Category | Open-source, OpenTelemetry-native observability platform | Open-source, OpenTelemetry-native observability platform |
| Storage backend | Object storage: Parquet on S3, GCS, Azure Blob, MinIO | ClickHouse on block storage / disks |
| Deployment footprint | Single binary or single container; stateless HA via Helm | Multi-service stack: ClickHouse, ClickHouse Keeper, PostgreSQL, OTel Collector, SigNoz app |
| Proven scale | 4+ PB/day for a single customer; 1+ PB/day on a single cluster | 10 TB+/day cited on SigNoz's enterprise page |
| Query experience | Click-through explorers and Tableau-style drag-and-drop dashboards; standard SQL (logs, metrics, traces) + PromQL underneath | Form-based query builder; ClickHouse SQL (logs/traces) + PromQL (metrics) underneath |
| Dashboards | Drag-and-drop builder; 19 prebuilt chart types + custom chart type (200+ visualizations via Apache ECharts) | Form-based builder; 7 panel types |
| RUM / session replay | Built-in, with session replay | Web Vitals only, no session replay |
| License | AGPL-3.0 (core, no usage caps) | MIT (Community Edition, no usage caps) |
| Cloud pricing | No monthly minimum; flat $0.50/GB ingested, $0.01/GB queried | $49/mo minimum (usage credit), then retention-tiered: $0.30/GB (15 days), $0.40/GB (30 days), $0.60/GB (90 days) for logs & traces + $0.10/million metric samples |
| Default cloud retention | 30 days on logs/traces/RUM, extendable at $0.02/GB per 30 days; 15 months on metrics; BYOB on Enterprise for unlimited retention | 15 days on logs/traces by default; longer retention raises the per-GB ingest rate |
| Self-hosted enterprise tier | Free up to 50 GB/day (SSO, RBAC, redaction) | Enterprise features gated to paid tiers |
If you're evaluating a broader field of tools rather than a head-to-head, open-source APM tools and top open-source observability tools cover more of the OpenTelemetry-native landscape SigNoz and OpenObserve both sit in.
What Is SigNoz?
SigNoz is an open-source, OpenTelemetry-native observability platform that unifies logs, metrics, and distributed traces (APM) in a single interface, built as a self-hostable alternative to Datadog and New Relic. It's built on two core technologies: OpenTelemetry for collection and instrumentation, and ClickHouse as the storage and query engine underneath everything, logs, traces, and metrics alike.
SigNoz's strengths are real: a polished APM experience with service maps and flame graphs, an approachable query builder for common questions, and the option to drop into raw ClickHouse SQL when the builder isn't enough. SigNoz Community Edition is MIT-licensed and self-hostable with no data caps; SigNoz Cloud is the managed offering.
What Is OpenObserve?
OpenObserve is an open-source observability platform built in Rust that ingests logs, metrics, traces, real user monitoring (RUM), and LLM telemetry into a single backend, all OpenTelemetry-native over OTLP. The architectural bet OpenObserve makes is different from SigNoz's: instead of a database cluster, telemetry is written as compressed Parquet files directly to object storage, S3, GCS, Azure Blob, or self-hosted MinIO, with compute nodes that are stateless and scale independently of storage.
That single design decision is what separates almost every other comparison point in this guide: operational overhead, long-term retention cost, and scaling model all trace back to "object storage versus a database cluster."
OpenObserve vs SigNoz: Architecture (Object Storage vs ClickHouse)
This is the one difference that actually matters most for how each platform behaves in production.
SigNoz runs on ClickHouse. ClickHouse is a genuinely fast columnar database, and it's a defensible choice for high-cardinality trace and log queries; that speed is real and not marketing. So is OpenObserve's, and the query performance section below takes that on directly; the comparison in this section is about what operating ClickHouse costs you, not whether it's fast. Because it's still a database with a specific set of operational characteristics that observability workloads tend to hit hardest:
- Merge pressure from streaming inserts. ClickHouse's MergeTree engine writes data in parts and merges them in the background. Observability pipelines insert continuously, in small batches, from OTel collectors, which is close to the worst-case insert pattern for MergeTree. Under-batched or high-frequency inserts can pile up parts faster than the background merges clear them, and ClickHouse will start rejecting inserts with a "too many parts" error until the backlog clears. Avoiding this means deliberately tuning collector batching and merge settings, not something that happens by default.
- Async mutations for updates and deletes.
ALTER TABLE ... DELETEandUPDATEin ClickHouse are mutations: they run as background jobs that rewrite affected parts, not an immediate in-place write. A routine operation elsewhere, a GDPR deletion request, redacting a field you shipped by mistake, backfilling a corrected value, is comparatively slow and resource-intensive on ClickHouse, and can compete with your regular query and merge load while it runs. - Compute and storage scale together. In a standard self-hosted ClickHouse deployment, a node holds both the data and the query engine that reads it. Need more retention but the same query throughput, or more query concurrency but no extra data? Either way you're adding nodes to the same cluster, because the two dimensions aren't separated. Open-source ClickHouse can be configured to tier cold data to S3, but MergeTree still operates through local-disk semantics: S3-backed parts are slow to read, and background merges keep rewriting data as object storage API calls, so it works as an archive tier, not as a primary store. ClickHouse's real compute-storage separation, SharedMergeTree, is proprietary and exclusive to ClickHouse Cloud, which a self-hosted SigNoz deployment cannot use.
None of this makes ClickHouse a bad database, it's a fast one, purpose-built for analytical queries. It does mean self-hosted SigNoz means someone on your team is, in practice, a ClickHouse operator: watching part counts, tuning merges, sizing disks, and planning shard growth, with ClickHouse Keeper for cluster coordination on top. If you're weighing ClickHouse itself as an observability backend rather than through SigNoz specifically, OpenObserve vs ClickHouse covers that trade-off directly, and The Real Cost of Self-Hosting Observability on ClickHouse breaks down what building the rest of an observability platform on top of it actually costs.
OpenObserve runs on object storage. There's no database to operate. Ingested data is compressed into Parquet files and written straight to your object storage bucket; a lightweight metadata layer indexes what's there. Compute nodes that handle ingestion and queries are stateless: you add or remove them without rebalancing anything, because they don't hold the data, the bucket does. Retention is a matter of how much you're willing to keep in object storage, which is priced at commodity rates (roughly $0.023/GB on S3-class storage) rather than provisioned database disk. On OpenObserve Cloud's Enterprise plan, Bring Your Own Bucket (BYOB) lets you point at an S3 or Azure Blob bucket you own and control directly, so retention stays effectively unlimited without renegotiating a storage budget the way SigNoz's disk-bound retention eventually requires.
The practical result: a SigNoz cluster that's been running for a year has an operational history, disks that have been resized, maybe a shard rebalance or two. An OpenObserve deployment a year in looks the same as it did on day one, because the storage layer was never something you managed.
OpenObserve vs SigNoz: Query Performance
The natural objection to everything above: ClickHouse is famous for query speed, and "data on object storage" usually reads as slow, Athena-style scans. If OpenObserve's economics came at the cost of interactive queries, the architecture trade would be a real one. It doesn't, because OpenObserve's query engine belongs to the same architectural family as ClickHouse's: a Rust engine built on Apache Arrow and DataFusion, running vectorized, columnar execution over Parquet, the same fundamental design that makes ClickHouse fast in the first place.
Object storage latency is a cold-path detail, not a per-query tax. Compute nodes cache hot data in memory and on local disk, so recent data, which is what the overwhelming majority of observability queries touch, is served at local speed without a round trip to the bucket. Before anything is fetched at all, time-based partition pruning, bloom filters, and inverted indexes narrow the scan to the files that can actually contain matches. Deep historical queries do reach into object storage, and those fan out across stateless compute nodes in parallel, which is also the one dimension you can scale independently here: add query nodes for concurrency without adding storage, something a standard ClickHouse cluster can't separate.
The two engines are peers in design. The real difference between these platforms isn't query engine class, it's where the data lives, what retention costs, and who operates the storage layer. "Object storage" and "fast queries" stopped being opposites once the engine was designed around caching and pruning from day one: OpenObserve runs this engine in production at petabyte scale, and there's published benchmarking at 1.1 TB scale against Elasticsearch. We have also run the ClickHouse-specific head-to-head ourselves, on one billion log records with matched queries and full-text indexes on both sides, with the harness published so it can be rerun. For the version of that test that matters most, your own workload, dual-ship a few days of production traffic and measure query latency directly, an experiment both platforms make cheap.
Scale is where each project's own marketing anchor is revealing. SigNoz's enterprise page cites a proven track record of 10 TB+ of ingestion per day, and its internal observability setup runs at roughly 24 TB/day across six regions. OpenObserve's largest single customer ingests more than 4 PB per day across a handful of clusters, with individual clusters sustaining over 1 PB/day. None of this says ClickHouse can't reach petabyte scale; companies like Uber and Cloudflare operate multi-petabyte ClickHouse fleets, with dedicated platform teams whose job is exactly that. Which is the point: at petabyte scale, ClickHouse operation is a specialized engineering discipline, while object storage makes the same scale a storage bill.
OpenObserve vs SigNoz: Feature Comparison
Both platforms cover the same core observability surface. The differences show up in how deep each goes and what ships built in.
| Feature | SigNoz | OpenObserve |
|---|---|---|
| Logs, metrics, traces, dashboards, alerts | ✅ | ✅ |
| OpenTelemetry native (OTLP) | ✅ | ✅ |
| Distributed tracing / APM with service maps | ✅ | ✅ |
| Data pipelines | Native Log Pipelines UI (parse/enrich); logs only, real-time only | Visual pipeline builder across logs, metrics, and traces: real-time VRL + scheduled/batch (SQL/PromQL), multi-destination routing |
| Real User Monitoring (RUM) | Web Vitals only | Built-in, with session replay and error tracking |
| Query language | Query builder, ClickHouse SQL, and PromQL (metrics) | Standard SQL across logs, metrics, and traces + PromQL |
| Storage engine | ClickHouse | Parquet on object storage |
| Deployment model | Multi-service stack | Single binary or single container; stateless HA |
| IAM & SSO | ✅ | ✅ SAML, OIDC, LDAP, RBAC |
| Open source | ✅ (MIT, Community Edition) | ✅ (AGPL-3.0) |
Two rows are worth expanding on.
Pipelines. SigNoz ships a native Log Pipelines UI, regex, Grok, and JSON parsing, field masking, configured in-product and pushed to its collector, not just hand-edited OTel config. It's a genuine feature, but it's scoped to logs and runs at ingest time only; metrics and traces still fall back to manual OpenTelemetry Collector processor configuration outside the SigNoz UI. OpenObserve builds VRL-powered pipelines into the product across all three signals, logs, metrics, and traces, using the same visual builder, and adds a mode SigNoz doesn't have: scheduled/batch pipelines that run a SQL or PromQL query on a cron instead of only reacting to data as it arrives, plus multi-destination routing to fan the same stream out to different downstream targets. Parsing, enrichment, redaction, backfills, and routing all happen in one place, for every signal, without a second configuration surface to maintain.
RUM and session replay. SigNoz's frontend monitoring covers Core Web Vitals via OpenTelemetry, which tells you a page was slow but not what the user was doing when it happened. OpenObserve's RUM module includes full session replay and error tracking, so a frontend investigation can go from "this page's LCP regressed" to watching the actual session, the same signal covered in RUM frustration signals.
OpenObserve vs SigNoz: Pricing Compared
Most teams evaluating these two platforms plan to self-host, so this section starts with the costs self-hosters actually pay. Cloud pricing follows for teams comparing the managed offerings.
Self-Hosted TCO: Where the Money Actually Goes
Neither platform charges a license fee for its core. SigNoz Community Edition is free with no data caps; you pay for the ClickHouse cluster's compute, disk, and network. OpenObserve is free under AGPL, and its self-hosted enterprise edition is free up to 50 GB/day of ingestion including SSO, RBAC, and sensitive data redaction, features that are usually paywalled entirely on other open-core platforms. So the real comparison is infrastructure, and the architecture decides its shape.
A back-of-the-envelope at 1 TB/day of raw telemetry, assuming roughly 10x columnar compression (both platforms compress well) and 30-day retention, at AWS list prices:
- Storage. SigNoz with 2 ClickHouse replicas: ~100 GB/day stored × 30 days × 2 replicas = 6 TB of block storage, call it 8 TB provisioned with operating headroom, at gp3's $0.08/GB-month that's about $640/month. OpenObserve: the same ~3 TB once, in S3 at $0.023/GB-month, about $70/month, with no replica multiplier because S3 is internally redundant.
- Replication traffic. ClickHouse replicas in different AZs pay ~$0.02/GB on replicated part data: roughly $60/month here, scaling linearly with ingest, forever. OpenObserve: $0; in-region transfer between compute and S3 is free.
- Compute. ClickHouse nodes are stateful, so they're sized ahead of demand and run on on-demand instances, since state on spot capacity is a gamble, plus three Keeper nodes and PostgreSQL alongside. OpenObserve's stateless nodes autoscale and are spot-eligible, and spot instances typically run 60-90% below on-demand price.
- Changing your mind. Stretch retention to 90 days: OpenObserve's bucket grows to ~9 TB, about $210/month. The ClickHouse cluster needs ~18 TB provisioned across replicas, about $1,440/month, and possibly additional nodes to carry it.
- People. The line that dwarfs all of the above: someone has to run the stateful system. The day-2 operations covered in the self-hosting section below are a job description on the SigNoz side; on the OpenObserve side they're a Helm chart and a bucket policy.
These are list-price estimates, not benchmarks. Your compression ratio, query load, and instance choices move every number, but the structure doesn't move: replica multipliers, metered replication, and provisioned-ahead disk are properties of the architecture, not of any particular deployment.
Cloud Pricing
SigNoz Cloud (Teams plan) has a $49/month minimum, which buys a usage credit. Once it's used up, logs and traces bill at a rate set by your retention tier: $0.30/GB at the default 15 days, $0.40/GB at 30 days, and $0.60/GB at 90 days, with further tiers above that. Longer retention reprices every GB you ingest, not just the older data. Metrics bill at $0.10 per million samples.
OpenObserve Cloud has no monthly minimum: you start at $0 and pay only for usage, a flat $0.50/GB ingested plus $0.01/GB queried, 30-day default retention on logs, traces, and RUM ($0.02/GB per additional 30-day period), 15-month metrics retention included, and a 14-day free trial with no credit card.
Stated fairly: at short retention SigNoz is cheaper per GB ($0.30 at 15 days, $0.40 at 30 days, versus OpenObserve's flat $0.50). But per-GB rates aren't the whole bill. At low volume the minimum dominates: a team ingesting 20 GB/month pays $49 on SigNoz and about $10 on OpenObserve, since there's no floor. And on retention, the lines cross around 60 days. At 90-day retention OpenObserve costs about $0.54/GB ($0.50 plus two $0.02 extensions) against SigNoz's $0.60/GB, and every tier beyond that widens the gap, because OpenObserve extends retention at near raw object-storage rates while SigNoz reprices all ingest. BYOB on the Enterprise plan removes the retention ceiling entirely, with storage billed by your cloud provider rather than your observability vendor, which makes OpenObserve much cheaper for anything past 60 days.
Is SigNoz Really Open Source?
Yes, with the open-core caveat that applies to most companies in this category. SigNoz Community Edition is MIT-licensed, open source, and self-hostable with no license fee and no data caps. Some advanced features live in SigNoz Cloud or an enterprise tier rather than the open-source core, which is a normal open-core pattern, not a criticism unique to SigNoz.
OpenObserve's core is open source too, under AGPL-3.0, and like SigNoz Community Edition it has no data caps. On the licenses themselves: MIT and AGPL-3.0 are both OSI-approved open source licenses, so neither platform is "more open source" than the other. The difference is that AGPL's copyleft requires anyone offering a modified hosted version to publish their changes, which keeps the product open rather than making it less so; MIT permits closed-source forks.
The distinction worth knowing: OpenObserve's self-hosted enterprise features (SSO, RBAC, sensitive data redaction) are free up to 50 GB/day of ingestion before a paid tier kicks in, which is a wider free enterprise allowance than most comparable open-core platforms offer, SigNoz included. That 50 GB/day applies only to the enterprise edition; the open-source core is uncapped.
OpenObserve vs SigNoz: Which Is Easier to Self-Host?
If you're planning to self-host, this is usually the deciding factor.
Self-hosted SigNoz is a coordinated set of services, even at the single-node level: ClickHouse for storage, ClickHouse Keeper for coordination, PostgreSQL for metadata, the bundled SigNoz application (frontend, API server, ruler, and alertmanager in one binary), and an OpenTelemetry Collector for ingestion. Each has its own health checks, upgrade path, and failure mode. Scaling to HA means turning on ClickHouse's replicated configuration and adding Keeper nodes for quorum, so sharding, replica management, disk sizing, and rebalancing become your responsibility as data grows. Replication also multiplies storage: every replica holds a full copy of its shard, so an HA setup with 2 replicas doubles your provisioned disk, and 3 replicas triples it. And it meters the network: replicas placed in different availability zones, which is what makes the HA real, pay inter-AZ transfer (about $0.02/GB effective on AWS) on the compressed part data replicated between them, a billed line that scales linearly with ingest for as long as the cluster lives; the self-hosted TCO breakdown in the pricing section above puts numbers on it. OpenObserve pays neither cost: durability comes from object storage itself, S3, GCS, and Azure Blob handle multi-AZ redundancy internally at the same per-GB price, and in-region transfer between compute and the bucket is free.
Self-hosted OpenObserve ships as a single binary you can run with one command, or a single container. There is no external database: OpenObserve embeds its own storage engine and writes to local disk or your own object storage bucket directly. Scaling to an HA cluster via Helm on Kubernetes separates compute from storage, so you add or remove stateless nodes without touching a schema or rebalancing a shard.
Day-2 Operations: Stateful vs Stateless
The stateful/stateless split shows up hardest after deployment, in the operations nobody demos.
- Node failure. A stateless OpenObserve pod dies and Kubernetes schedules a replacement; there is nothing to recover, because the node held nothing. A ClickHouse data node dies and recovery is a process: the replacement replica resyncs its shard over the network, redundancy stays degraded until it finishes, and if the shard had no second replica, the data is gone.
- Upgrades. Upgrading stateless compute is a rolling deployment, and rolling back means deploying the previous image. Upgrading a stateful ClickHouse cluster means managing version compatibility across replicas mid-upgrade, keeping Keeper compatible, and a rollback story that can involve on-disk data formats, not just binaries.
- Backups and disaster recovery. With ClickHouse, backups are a project: tooling, schedules, off-site copies, restore drills. With OpenObserve, the bucket is the durable store, and provider-side durability, versioning, and cross-region replication are checkbox features of S3, GCS, and Azure Blob, not systems you build and test yourself.
- Elasticity. Stateless pods autoscale behind a Kubernetes HPA and run safely on spot or preemptible instances, since losing one costs nothing but a rescheduled pod. A StatefulSet with persistent volumes does neither comfortably: disks don't shrink, scaling down means moving data first, and putting state on spot capacity is a gamble.
None of this is ClickHouse doing something wrong; it's what running any stateful distributed system entails, and teams with dedicated platform muscle do it every day. The difference is that OpenObserve's design hands the stateful part to your object storage provider, so the system you operate is the easy kind.
For a small team, that's the difference between "install and run" and "stand up and operate a distributed database." And that's not a figure of speech; this is the entire OpenObserve install, ready to copy:
OpenObserve vs SigNoz: Query Language
Neither platform makes you write queries for everyday work. SigNoz ships a form-based query builder (rebuilt as v5 in 2025) with autocompleted filters, aggregation dropdowns, and multi-query formulas, with raw ClickHouse SQL as the escape hatch for logs and traces and PromQL for metrics. OpenObserve's explorers are click-through too: the logs and traces views surface every field in a sidebar, and clicking a field or value builds the filter for you, no query text involved.
Dashboards are where the two visual experiences diverge. OpenObserve's dashboard builder is drag-and-drop in the style of Tableau: drag fields onto the x-axis, y-axis, or breakdown and the panel assembles itself, across 19 prebuilt chart types, plus a custom chart type that opens up more than 200 visualizations through Apache ECharts when the prebuilt set isn't enough. SigNoz's dashboards offer 7 panel types (timeseries, bar, histogram, pie, table, list, and number), and panels are configured through the same form-based builder as its explorers, filling in filter, aggregation, and group-by fields rather than dragging fields onto a canvas.
The languages underneath differ more than the builders. When you outgrow the visual layer in SigNoz, you land in ClickHouse SQL, its own dialect with its own functions and table layout to learn, and it applies to logs and traces only, not metrics. OpenObserve's escape hatch is standard SQL, working the same way against logs, metrics, and traces alike, plus PromQL for Prometheus compatibility. And writing it is assisted: the query editor is Monaco, the same editor that powers VS Code, with autocomplete for field names, field values, and SQL functions as you type. If your team already writes SQL and knows PromQL from Prometheus or Grafana, there's nothing new to learn, and anything you build stays portable instead of being tied to a proprietary builder or dialect.
Migrating From SigNoz to OpenObserve
Because both platforms are OpenTelemetry-native, migrating is mostly a configuration change, not a re-instrumentation project.
- Repoint your OpenTelemetry Collector. Your applications are already instrumented with OTel. Add an OTLP exporter for OpenObserve to your existing Collector config and dual-ship to both platforms while you validate that traces, logs, and metrics match.
- Rebuild dashboards and alerts. Recreate your key SigNoz dashboards using standard SQL and PromQL in OpenObserve, and port alert rules over. Any ingest-time processing built on OTel Collector processors becomes an OpenObserve VRL pipeline.
- Cut over and retire the ClickHouse stack. Once OpenObserve's numbers match what SigNoz reported, shift traffic fully, then decommission ClickHouse, ClickHouse Keeper, PostgreSQL, and the rest of the SigNoz services. Long-term history moves to object storage instead of disks you have to keep provisioning.
There's no proprietary agent to rip out on either side, which is the advantage of both platforms committing to OpenTelemetry rather than a custom collection format.
OpenObserve vs SigNoz: Which Should You Choose?
Choose SigNoz if
Your team already runs ClickHouse (or wants to) and is comfortable operating it, you value a purpose-built query builder plus the option to write raw ClickHouse SQL for APM-style analysis, and a multi-service deployment isn't a concern because you already have the platform expertise on staff.
Choose OpenObserve if
You want a single binary with no external database to operate, object-storage economics so extending retention doesn't mean provisioning more disk, standard SQL and PromQL instead of a platform-specific query dialect, and built-in RUM with session replay rather than Web Vitals alone. For teams that want observability without taking on a database operations project, OpenObserve is the more direct path.
Both, if you're still deciding
Both are open source and OpenTelemetry-native, so there's little switching cost to try either against a real workload: point the same OTel Collector at both, ingest a few days of production traffic, and compare query latency, storage growth, and how much operational attention each one needs before you commit. That side-by-side is the fastest way to answer "OpenObserve vs SigNoz" for your specific stack instead of a generic one.
Try OpenObserve Cloud
If object storage economics and a single binary sound better than operating a ClickHouse cluster, the fastest way to see the difference is to send your own telemetry to both and compare. Start a free OpenObserve Cloud trial with no credit card, or self-host the single binary under AGPL. The self-hosted path is the same one command from earlier:
Point your existing OpenTelemetry Collector at it and your logs, metrics, and traces are queryable in minutes.
- Try OpenObserve Cloud: 14-day free trial, no credit card required
- See the full SigNoz alternative comparison: feature matrix, migration steps, and pricing calculator
- Read open-source APM tools: where SigNoz and OpenObserve sit in the wider OTel-native landscape
- Also evaluating other tools? See how OpenObserve compares to Grafana, ClickHouse, and Elasticsearch
Frequently Asked Questions
About the Author
Simran Kumari

Passionate about observability, AI systems, and cloud-native tools. All in on DevOps and improving the developer experience.
Follow OpenObserve on Google
Add OpenObserve as a preferred source to see more of our articles in Google Search and Top Stories.












