Getting Started with OpenObserve
OpenObserve vs Langfuse in 2026: unified infra+LLM observability vs a dedicated LLM platform. Feature matrix, pricing, and when to use each (or both).
Compare the best log visualization tools in 2026: OpenObserve, Kibana, Grafana Loki, Datadog, and Splunk. Covers AI-assisted analysis, dashboard quality, and cost.
A practical guide to the best distributed tracing tools in 2026: OpenObserve, Jaeger, Grafana Tempo, Zipkin, and Honeycomb. Covers OTel compatibility, high-cardinality support, and deployment trade-offs.
Discover the best Elasticsearch alternatives in 2026. Compare OpenObserve, OpenSearch, ClickHouse, Grafana Loki, and Solr on cost, search performance, and deployment options.
A comprehensive comparison of open source LLM observability tools in 2026: OpenObserve, Langfuse, Helicone, and Arize Phoenix. Covers prompt tracing, cost tracking, evaluation frameworks, and unified infrastructure monitoring.
A practical comparison of the top log management tools in 2026: OpenObserve, Splunk, Datadog, Grafana Loki, and Elastic. Covers collection, indexing, retention, and cost for modern DevOps and SRE teams.
A practical guide to the top 10 microservices monitoring tools in 2026: OpenObserve, Grafana LGTM, Datadog, Dynatrace, and Prometheus. Covers unified telemetry, cardinality handling, and cost trade-offs.
Discover the best Splunk alternatives in 2026. Compare open-source and enterprise tools for log management, SIEM, and observability. Find cost-effective solutions with our comprehensive guide.
A practical guide to 15 essential SRE tools in 2026: OpenObserve, Datadog, PagerDuty, Prometheus, Jaeger, and LitmusChaos. Covers unified observability, alerting, incident management, SLO tracking, and chaos engineering.
Compare the best Lightstep alternatives following the March 2026 EOL. Covers OpenObserve, Jaeger, Grafana Tempo, Honeycomb, and Datadog APM with OpenTelemetry migration guides, cost comparisons, and high-cardinality tracing analysis.
A comprehensive comparison of the top 10 observability platforms in 2026 highlighting their strengths, trade-offs, and use-cases.
Explore the top observability tools and platforms in 2026. Compare features, use cases, and alternatives to Datadog for logs, metrics, and traces in this complete guide.
Top 10 open source monitoring tools explained. Learn what they are, why they matter, and how to choose to get the most from your observability strategy.
Compare the top 10 AIOps platforms in 2026 — features, pricing, and use cases for autonomous operations, alert correlation, root cause analysis, and intelligent incident response.
Compare the best Datadog alternatives in 2026 with real cost data, technical analysis, and migration guides. OpenObserve delivers 60-90% cost savings with unified observability for logs, metrics, and traces.
Looking for a Dynatrace alternative? Whether you're frustrated by DDU pricing complexity, vendor lock-in, or the steep learning curve, this guide covers the 10 best Dynatrace alternatives in 2026 from open-source platforms to enterprise SaaS tools.
Discover the top open-source Grafana alternatives in 2026. Compare features like dashboards, alerting, metrics, logs, traces, scalability, and ease of use for modern DevOps teams.
Compare the top 10 Kubernetes monitoring tools in 2026, including OpenObserve, Prometheus, Datadog, and more. Features, cost, and use cases for DevOps and SRE teams.
Explore top New Relic alternatives that offer better pricing, open-source flexibility, and full-stack observability for modern DevOps and SRE teams.
A comprehensive comparison of the best log analysis tools in 2026, covering search, pattern detection, anomaly detection, and pipeline capabilities for engineering and SRE teams.
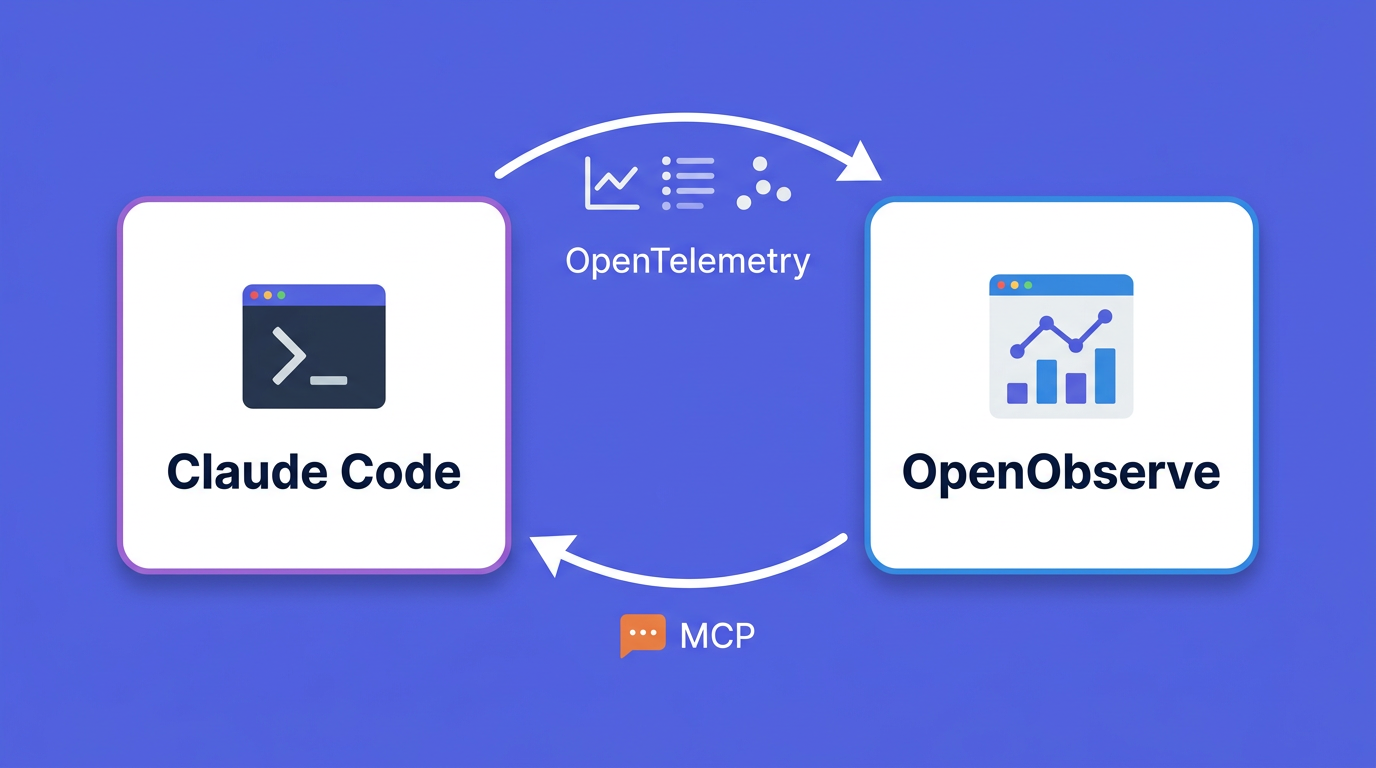
Instrument Claude Code with OpenTelemetry, ship usage and cost data to OpenObserve, then query it back from Claude Code via the OpenObserve MCP server.