Top 10 Microservices Monitoring Tools in 2026

Simran Kumari
Updated July 07, 2026
18 min read
Don’t forget to share!
What Nobody Tells You About Running AI in Production
Try OpenObserve Cloud today for more efficient and performant observability.
OpenObserve is the best microservices monitoring tool in 2026 for teams that need unified logs, metrics, and traces without paying per-host fees. It handles high-cardinality Kubernetes labels natively, deploys via a single Helm chart, and lets every engineer on your team write queries in SQL or PromQL without learning a new syntax.
Running microservices without solid monitoring is like flying without instruments. You might be fine for a while, but the first time something goes wrong across three services simultaneously, you will spend hours in the dark. I have seen teams lose entire afternoons to an incident that turned out to be a slow database query two hops away from the service throwing errors.
The tools in this list represent the realistic options engineering teams are actually running in 2026, from fully open source setups to enterprise SaaS platforms. They are not all equivalent, and I will be direct about where each one falls short. The right choice depends on your team size, your existing stack, and frankly, your budget tolerance.
A few things this list does not do: it does not include tools that only monitor one signal in isolation (pure APM tools, for example), and it is not a paid ranking. OpenObserve is at the top because it genuinely covers the widest ground for the most teams at the lowest operational cost. The rest of the list is ordered roughly by how commonly I see them in real production setups. If you are also evaluating tools for adjacent use cases, see our roundups on Top 10 Observability Platforms, Top 10 APM Tools, Top 10 Kubernetes Monitoring Tools, and Top 10 Log Monitoring Tools.
Before the list, here is what actually matters when you are evaluating these tools for a distributed services environment.
Unified telemetry. If your logs live in one place, your metrics in another, and your traces in a third, you are going to context-switch constantly during incidents. The tools that correlate all three signals in a single query interface save the most time when it matters.
Query language access matters more than it sounds. A tool that lets any engineer write a query to investigate an incident is more useful than one where only the observability specialist can extract meaningful answers.
Cardinality handling is often what separates tools that look good in demos from tools that hold up at scale. High-cardinality labels (per-endpoint, per-user, per-region) are exactly what you need during debugging, and they are exactly what breaks naive time-series databases.
Cost at scale is worth modeling before you commit. Several tools on this list look affordable at low ingest volumes and become very expensive once you hit production traffic.
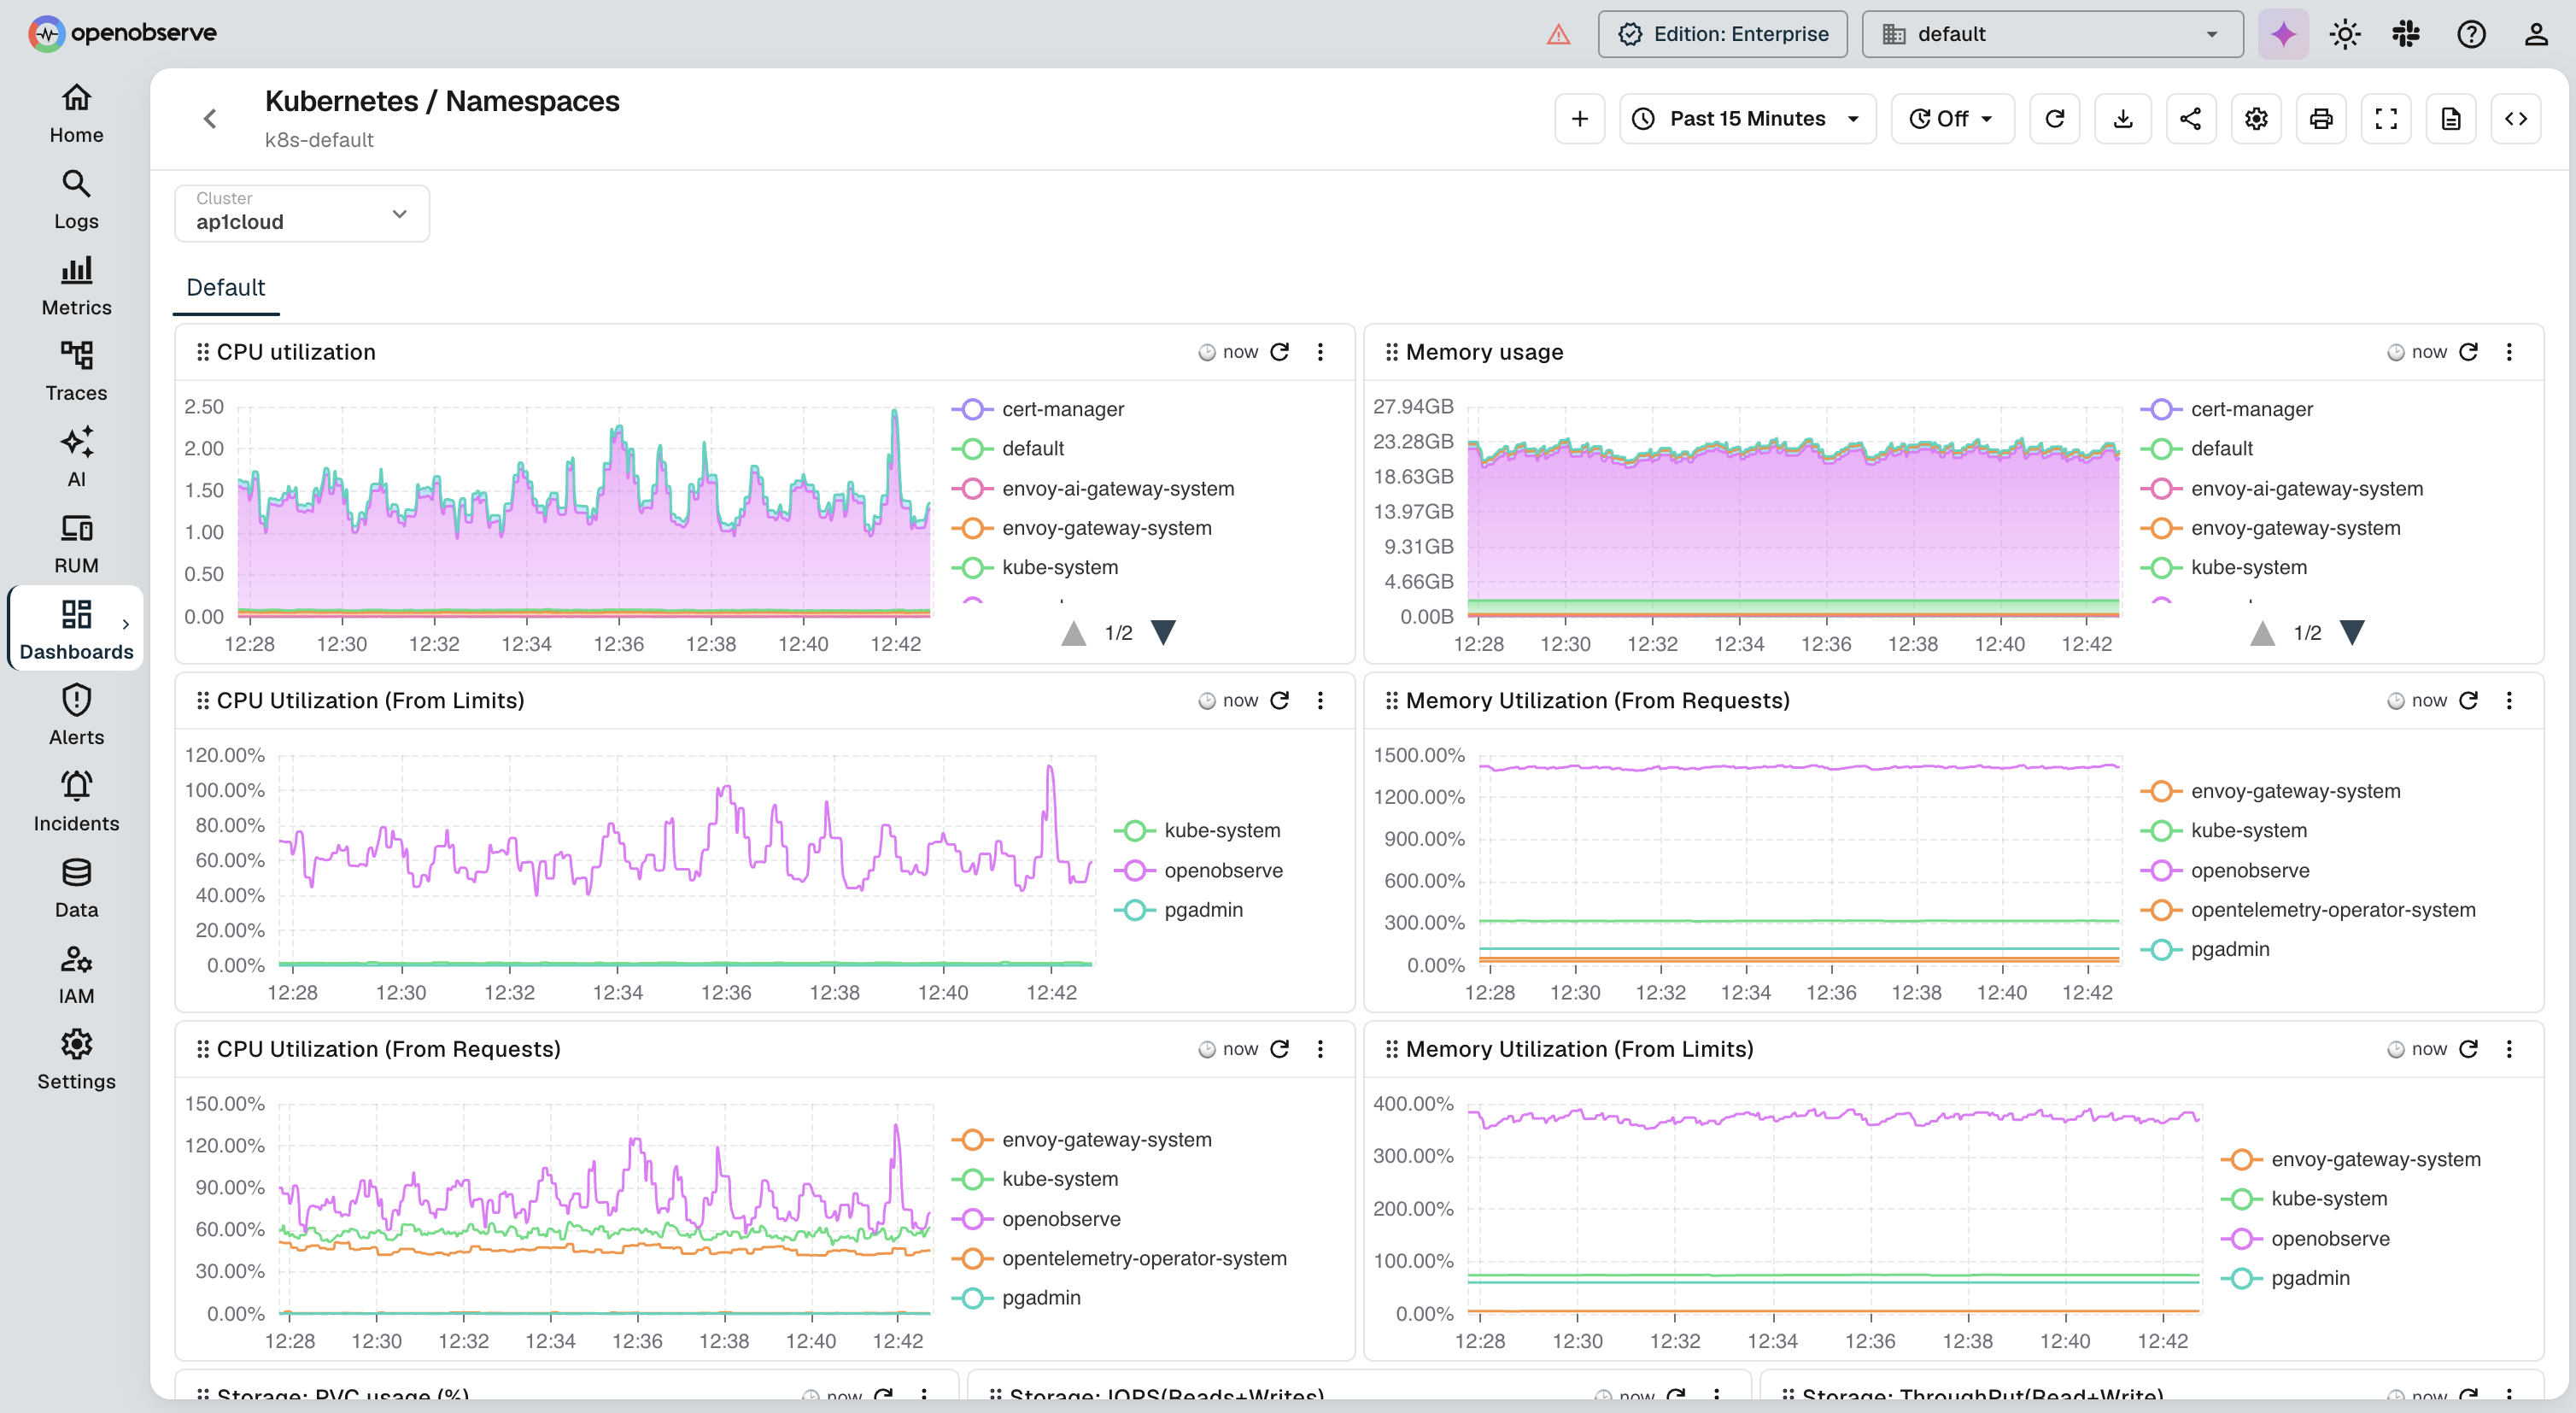
If you want logs, metrics, and traces in one place without paying per-GB ingestion fees, OpenObserve is where to start. It is open source, runs on Kubernetes with a Helm chart in under ten minutes, and accepts OpenTelemetry data natively, so your instrumentation work is not wasted if you ever switch backends.
The approximately 140x lower storage costs in typical log workloads versus Elasticsearch-based stacks is the number that gets attention, and it holds up in practice (actual results vary based on data entropy and cardinality). Teams migrating from ELK report storage cost reductions in the 70-90% range. That is not a rounding error; it is the difference between log retention being expensive and being a non-issue.
The query interface supports both SQL and PromQL. SQL for log analysis means your entire engineering team can write queries on day one, not just the person who memorized LogQL syntax. PromQL compatibility means existing Prometheus dashboards and alert rules port over without translation.
Want to see the storage savings firsthand? Try OpenObserve Cloud free: 50 GB/day ingest, no credit card required.
Best for: teams wanting a unified open source platform, Kubernetes-native environments, organizations migrating away from ELK or Datadog with cost as the primary driver.
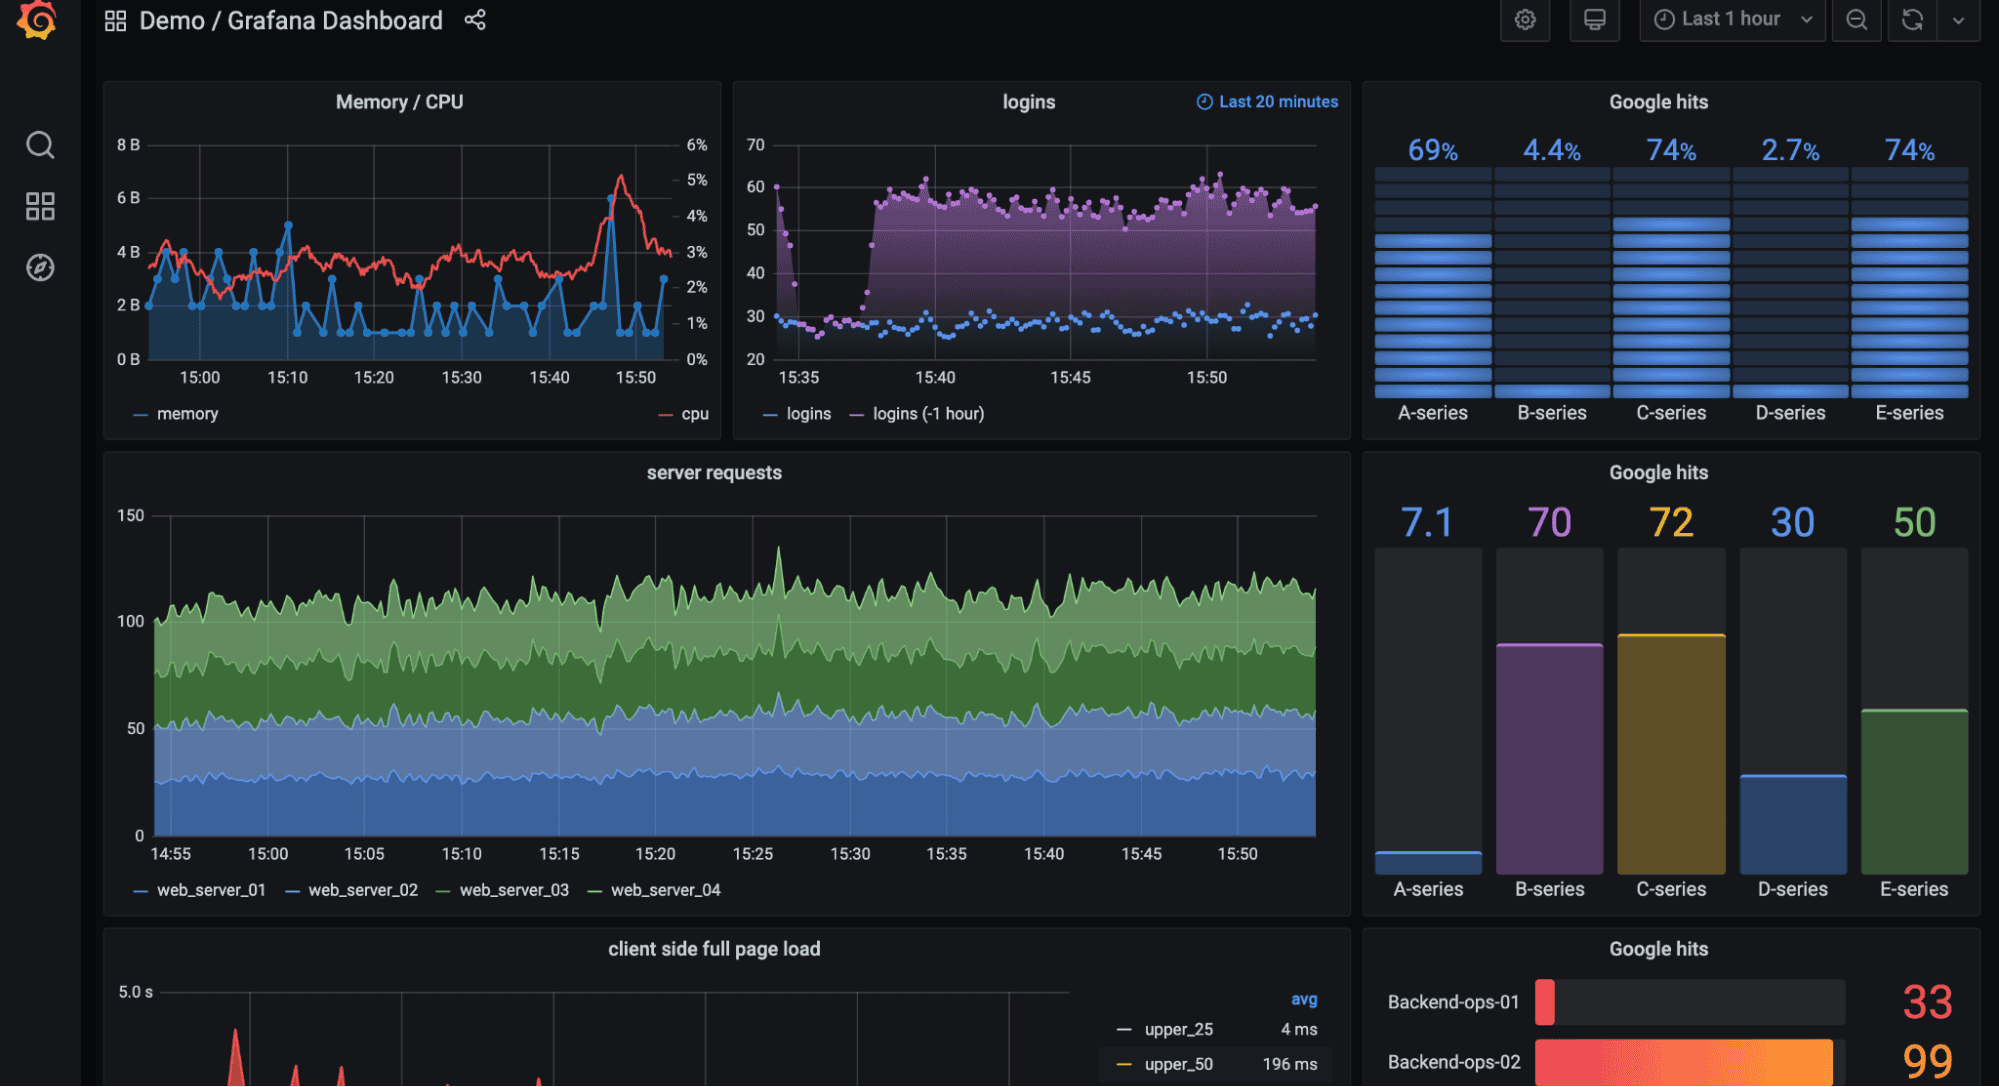
The Grafana LGTM stack is the open source path to full-stack observability if you want to own all the components. Loki handles log aggregation, Tempo handles distributed tracing, Mimir handles long-term metrics storage at scale, and Grafana ties everything together in one UI. The practical benefit is that you can jump between a metrics spike, the logs from that time window, and the traces for the affected requests without leaving the same interface.
Each component is well-designed for its specific job. Loki indexes labels rather than log content, which keeps storage costs manageable compared to Elasticsearch. Paytm Insider reported saving 75% of their logging and monitoring costs after migrating to Loki. Tempo stores trace data in object storage (S3, GCS, etc.) which keeps costs predictable even at high trace volumes.
Best for: teams with existing Prometheus and Grafana investment who want to extend incrementally, organizations with dedicated platform engineers comfortable managing multiple systems. Not locked into Grafana? See our Top 10 Grafana Alternatives guide.
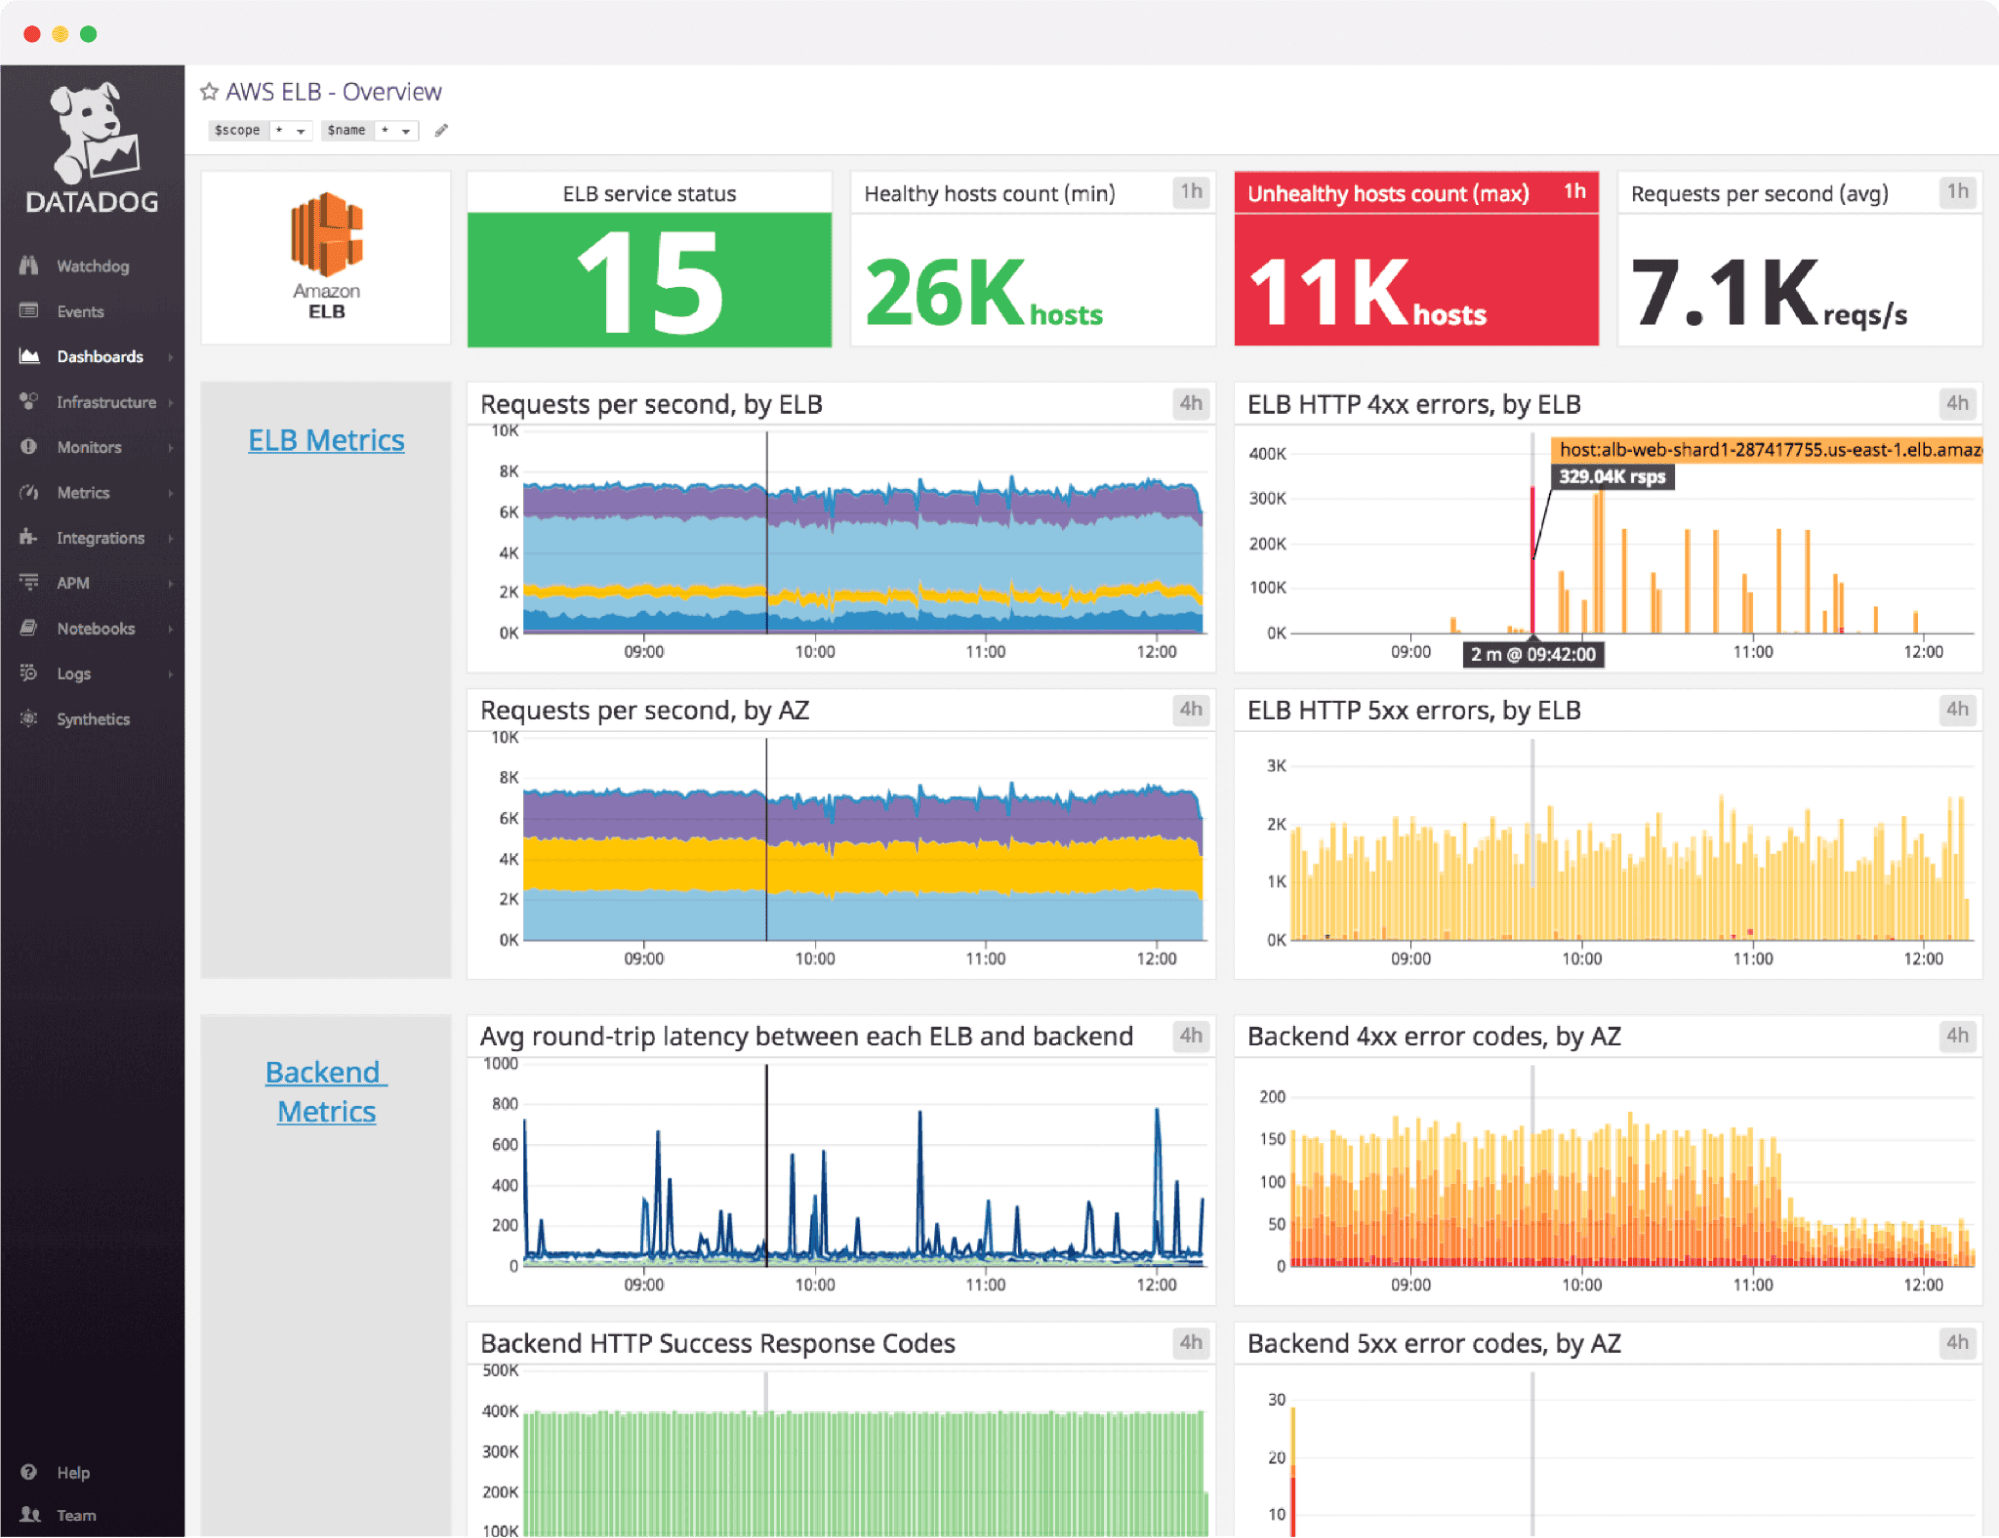
Datadog is the most fully-featured SaaS observability platform available right now. The agent auto-discovers services, the integrations number over 900, and the product has expanded into security monitoring, synthetic testing, real user monitoring, and more. For teams that want one vendor to cover the entire observability surface, Datadog is the obvious SaaS choice.
Best for: enterprise teams with observability budgets, organizations that need broad vendor-managed integrations, teams that value support SLAs. Evaluating other options? See our Top 10 Datadog Alternatives guide.
Dynatrace takes a fundamentally different approach from most tools on this list. Its OneAgent does full auto-instrumentation, discovering your services, dependencies, and topology automatically without requiring manual OpenTelemetry setup. The Davis AI engine runs continuous anomaly detection across your environment and attempts to surface root causes before you have to go looking for them.
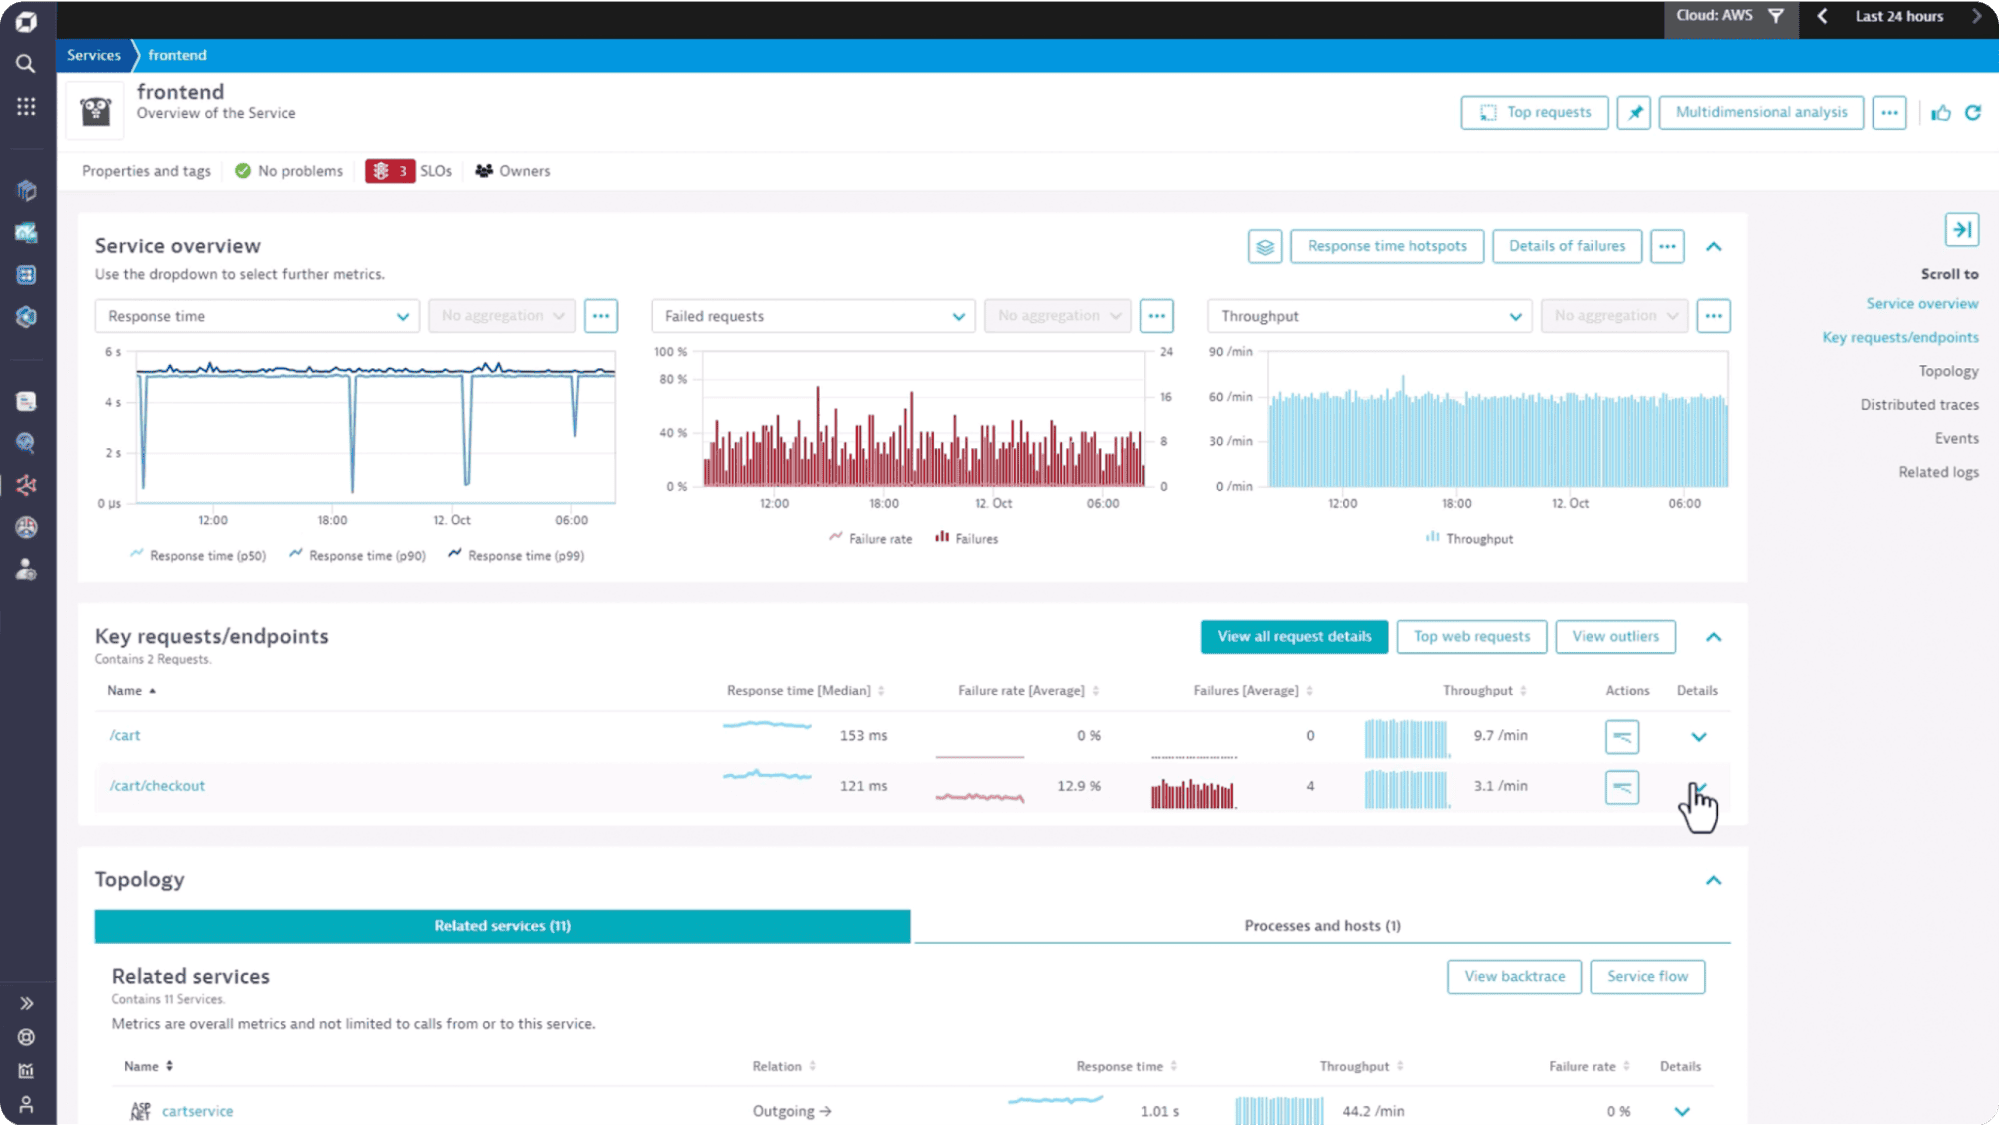
Best for: large enterprises with complex hybrid environments, regulated industries needing on-premise deployment, teams that want automated instrumentation and are willing to pay for it. See also our Top 10 Dynatrace Alternatives guide.
New Relic has gone through significant pricing changes in recent years and now offers a consumption-based model with a generous free tier (100 GB/month free data ingest). For smaller teams, this makes it an accessible entry point into full-stack SaaS observability.
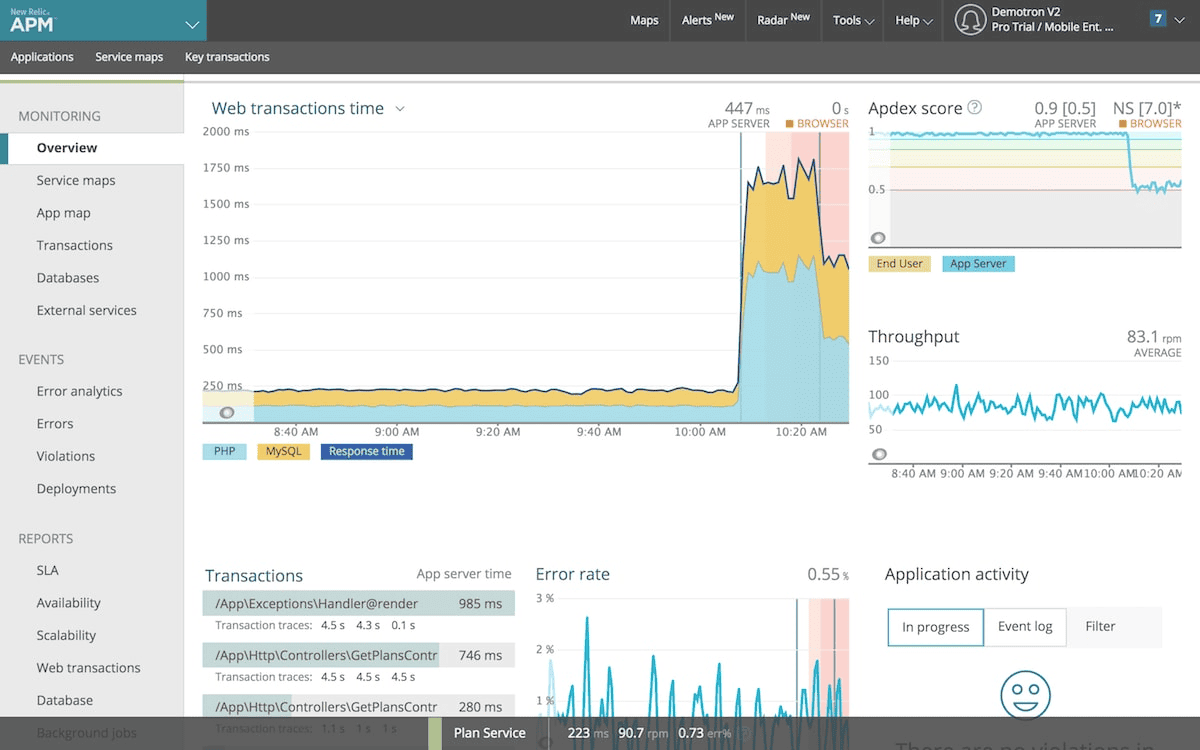
Best for: small to mid-size teams wanting SaaS full-stack observability, organizations migrating away from Datadog, applications where APM is the primary concern. Comparing other options? See our Top 10 New Relic Alternatives guide.
Elasticsearch has been the dominant log search platform for years, and Elastic's observability product extends the ELK stack (Elasticsearch, Logstash, Kibana) into metrics and traces. If your organization already runs Elasticsearch for log management, adding the observability layers is a logical extension.
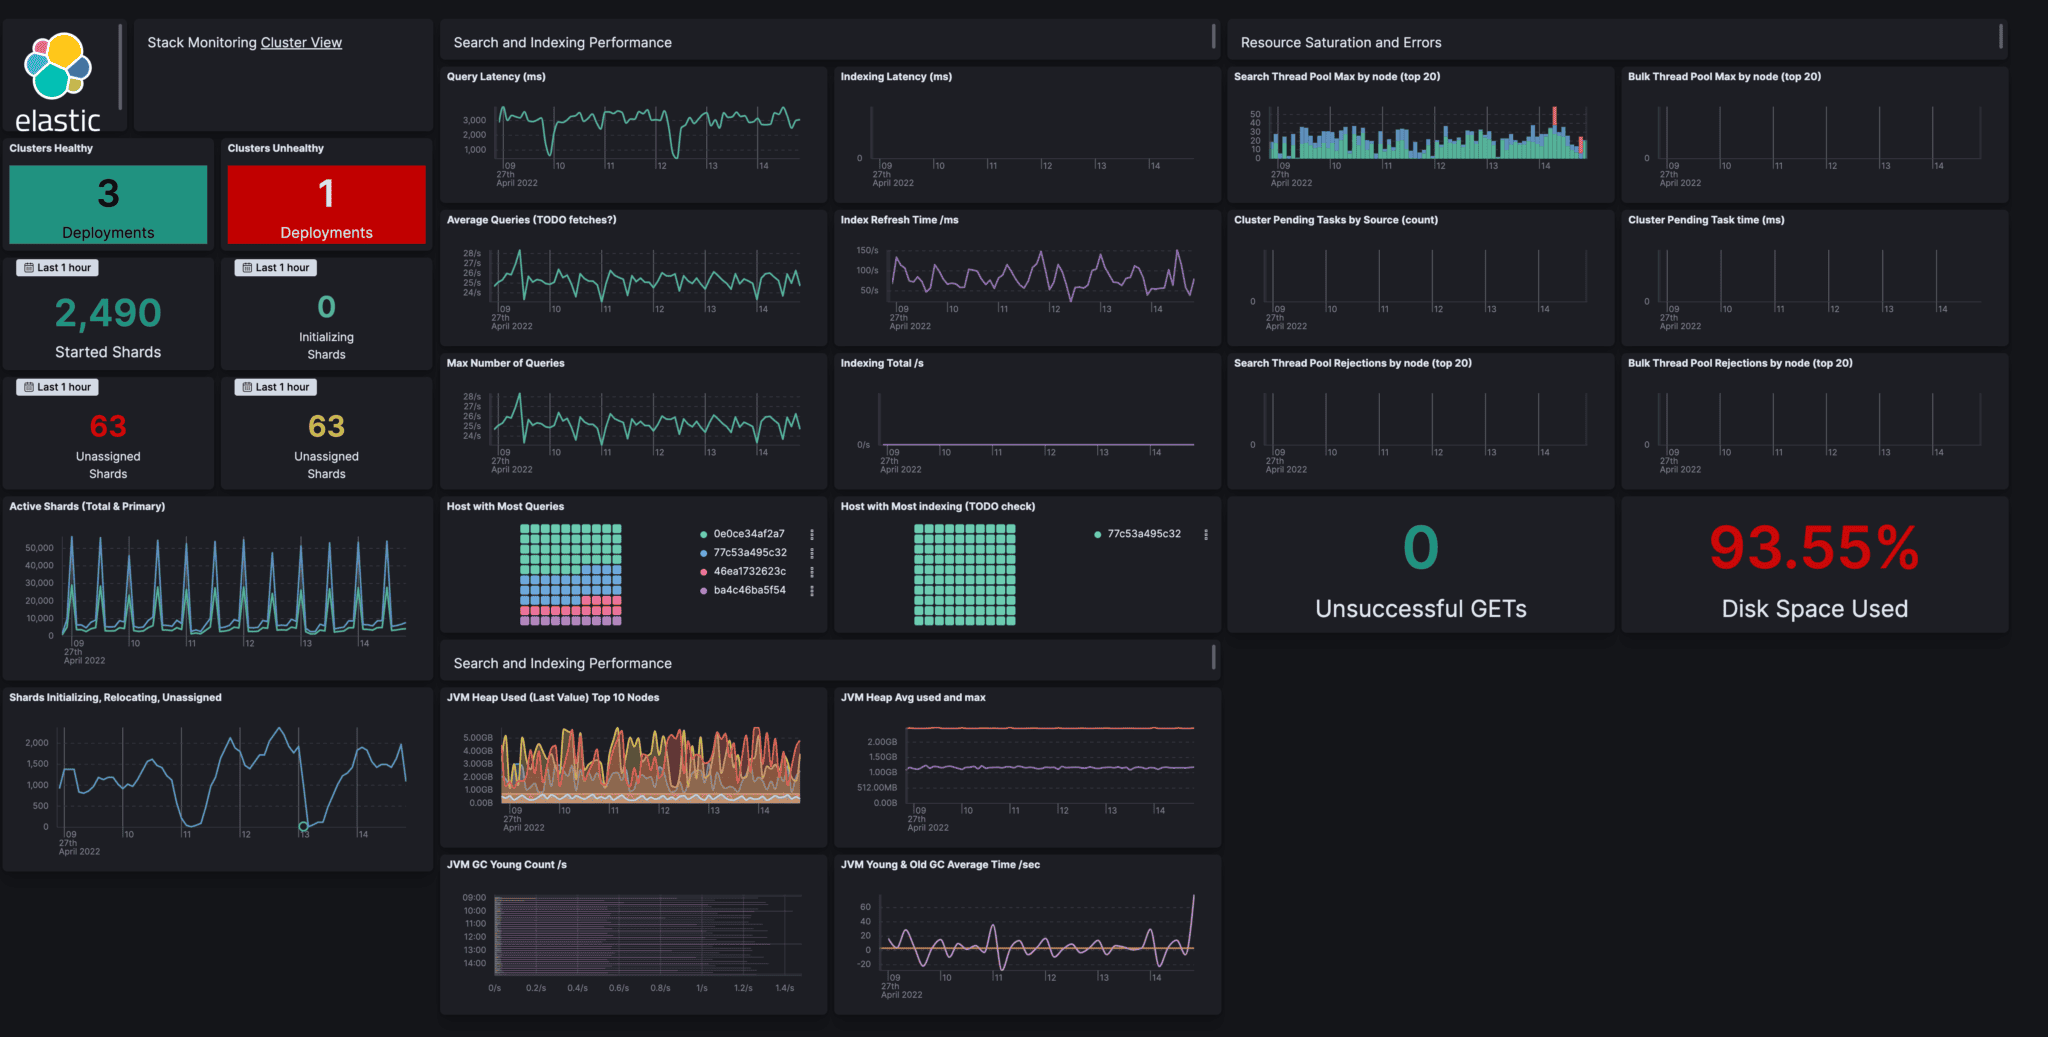
Best for: organizations with existing Elasticsearch investment, security and compliance log management use cases, teams with dedicated platform engineers to manage the operational overhead. Looking to move off Elastic? See our Top 10 Elasticsearch Alternatives guide.
Jaeger is a CNCF-graduated distributed tracing tool originally built by Uber. It does one thing and does it well: distributed tracing across microservices. If you need to visualize request flows, identify where latency is introduced, and understand service dependencies at the trace level, Jaeger is mature and well-supported.
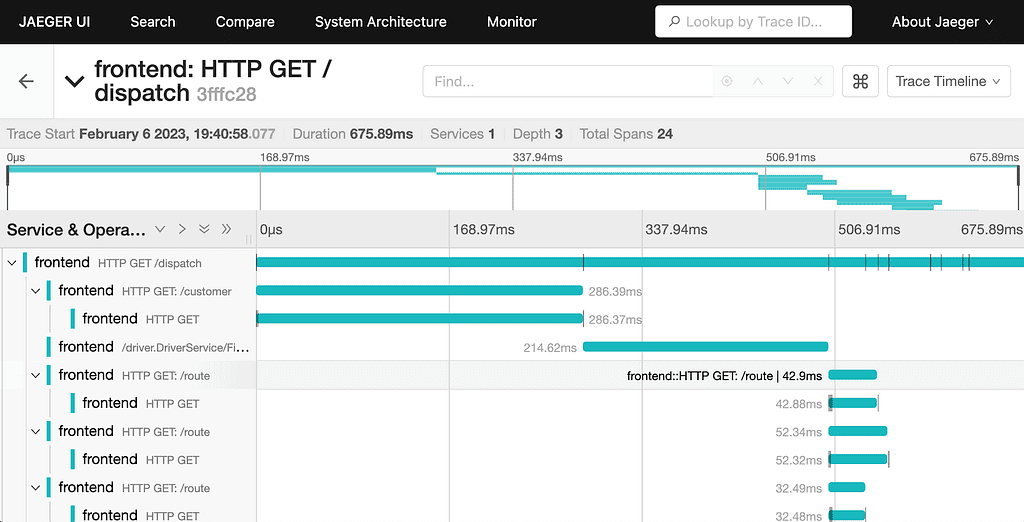
Best for: adding distributed tracing to an existing metrics and logging stack, teams already running CNCF-standard tooling, Kubernetes environments where Jaeger's deep k8s integration is an asset.
Honeycomb is built around a different data model than most observability tools. Instead of separate logs, metrics, and traces, it centers everything on high-cardinality events with arbitrary dimensions. This makes it particularly powerful for debugging production issues in complex microservices environments where the interesting questions involve combinations of attributes you did not think to aggregate in advance.
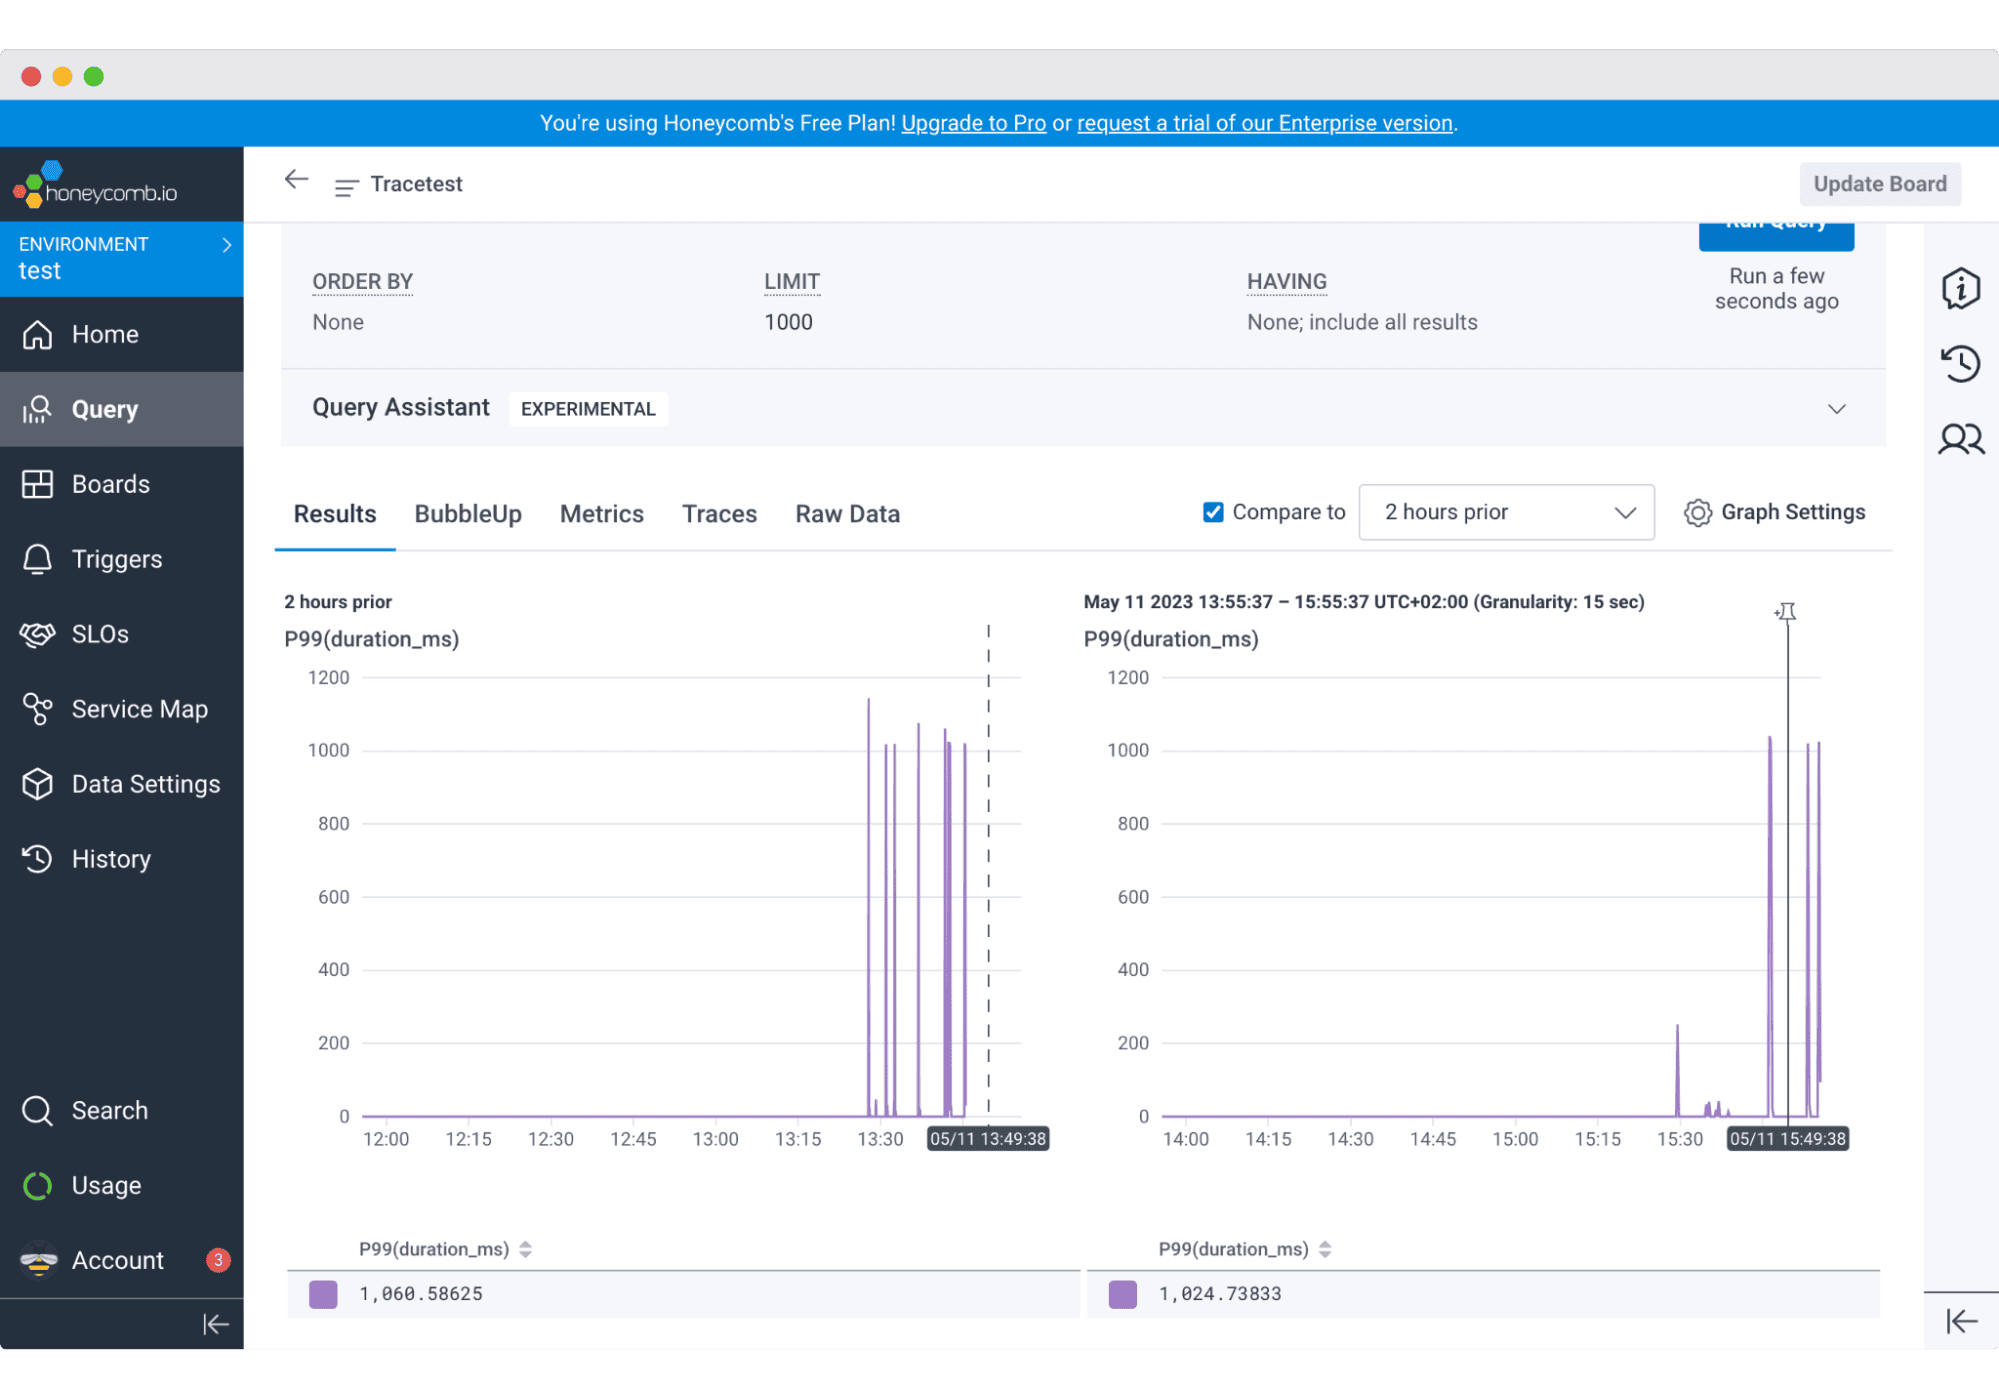
Best for: developer-centric teams debugging novel production issues, microservices environments with genuinely high-cardinality workloads, teams that have tried traditional monitoring and found it inadequate for their specific debugging patterns.
SkyWalking is an open source APM and observability platform designed specifically for cloud-native and microservices architectures. It provides distributed tracing, metrics collection, and service topology visualization, with particular strength in Java-based microservices environments where it has mature auto-instrumentation support.
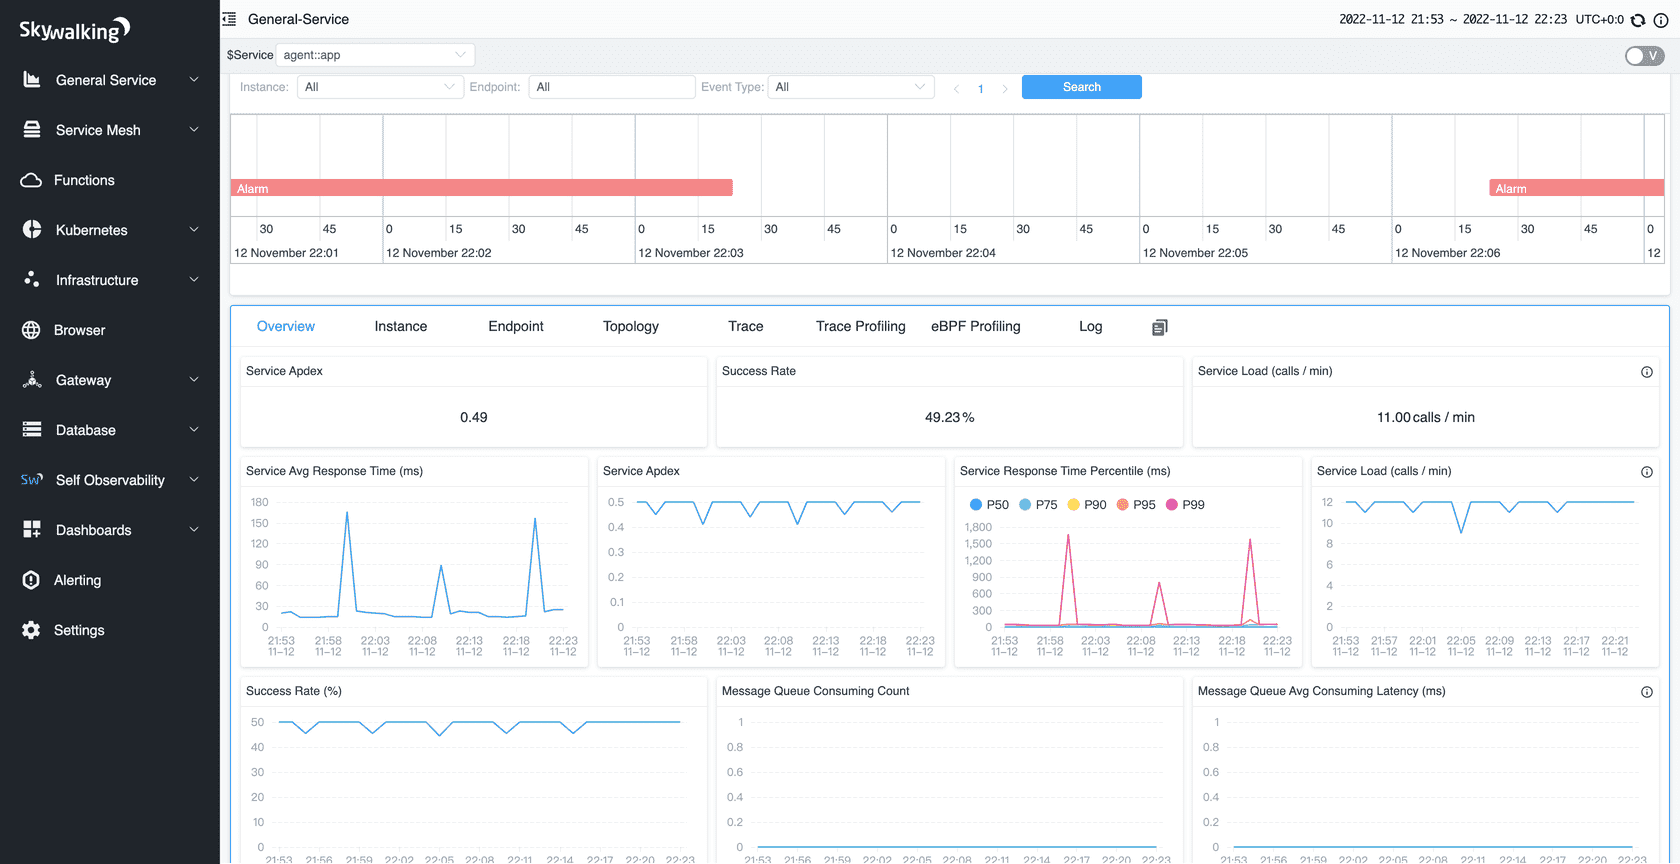
Best for: Java-based microservices architectures, teams wanting open source APM without the operational overhead of the ELK stack, large-scale distributed systems where automated dependency mapping is a priority.
Zipkin is one of the oldest distributed tracing tools still in active use, originally developed at Twitter and inspired by Google's Dapper. It captures timing data across service calls, helps teams troubleshoot latency problems, and generates dependency diagrams that show error paths and calls to deprecated services.
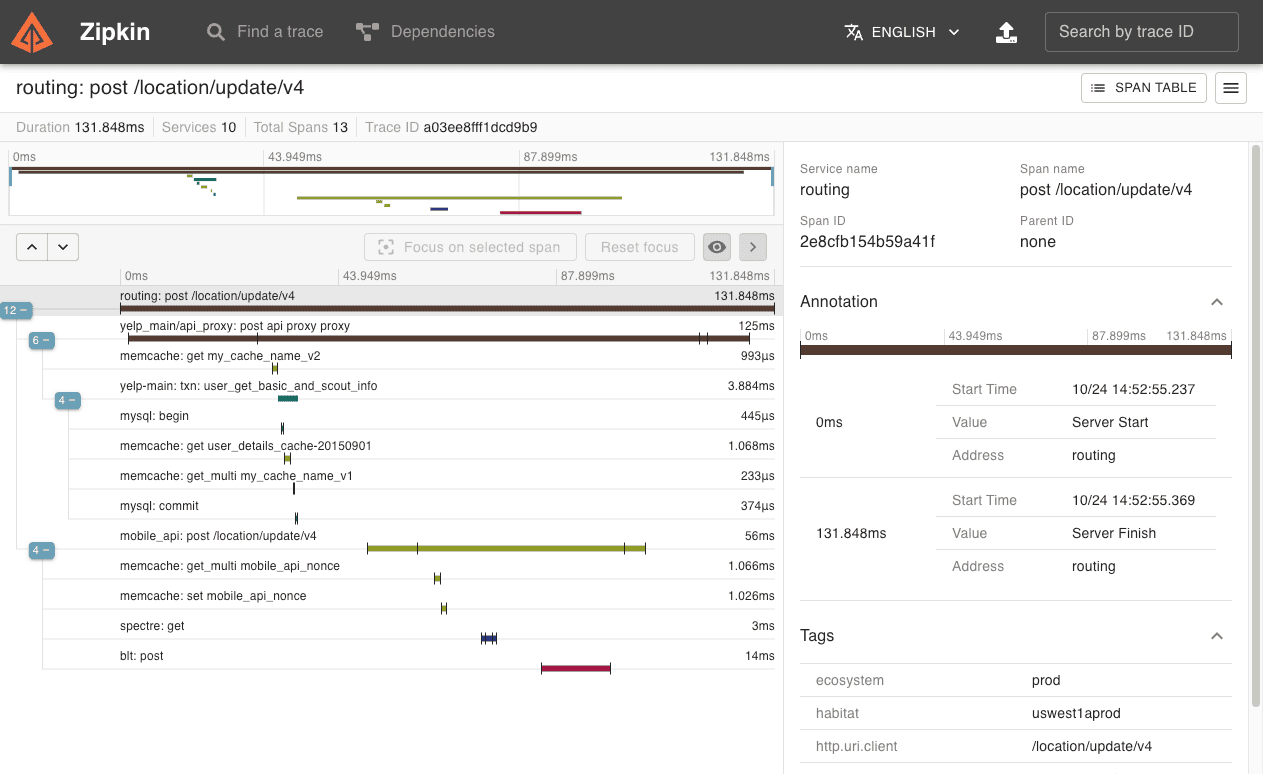
Best for: teams that need simple, low-overhead distributed tracing and are not ready to commit to a heavier platform, existing Zipkin users who have not yet found a reason to migrate.
| Tool | Open Source | Unified (Logs + Metrics + Traces) | OTel Native | Relative Cost |
|---|---|---|---|---|
| OpenObserve | Yes | Yes | Yes | Infrastructure only |
| Grafana LGTM Stack | Yes | Yes (multi-tool) | Partial | Infrastructure or Cloud |
| Datadog | No | Yes | Partial | High |
| Dynatrace | No | Yes | Partial | High |
| New Relic | No | Yes | Partial | Medium |
| Elastic Observability | Partial | Partial | No | Medium to High |
| Jaeger | Yes | No (traces only) | Yes (v2) | Infrastructure only |
| Honeycomb | No | Partial | Yes | Medium to High |
| Apache SkyWalking | Yes | Partial | Partial | Infrastructure only |
| Zipkin | Yes | No (traces only) | Partial | Infrastructure only |
The honest answer is that the right tool depends on where you are right now, not on an abstract feature checklist.
If you are starting fresh on Kubernetes with no existing observability investment, OpenObserve gives you unified observability without committing to SaaS pricing or the operational overhead of running four separate systems. The storage efficiency and SQL query access are particularly useful if your team is not already fluent in PromQL or LogQL.
If you are already running Prometheus and Grafana and want to add log aggregation and tracing without replacing everything, extending to the full LGTM stack with Loki and Tempo is lower risk than a full platform migration. You keep your existing dashboards and alert rules; you just add systems incrementally. The fragmentation is real but manageable if your team already knows the Grafana ecosystem.
If budget is not a constraint and your organization needs enterprise support SLAs, Datadog or Dynatrace cover the most ground with the least operational overhead. Dynatrace wins for auto-instrumentation in complex hybrid environments; Datadog wins for breadth of integrations.
If you are running a Java-heavy stack with dozens of services and want automated dependency mapping, SkyWalking deserves a serious evaluation. It does not get as much attention in cloud-native conversations but it performs well for the use cases it was designed for.
The one pattern worth avoiding: do not let the decision drag on so long that you end up with no monitoring at all. A working setup with basic RED metrics is more valuable than a perfect tool still being evaluated six months later.
Most teams land in one of three places: open source and self-hosted (OpenObserve or the Grafana LGTM stack), commercial SaaS (Datadog or Dynatrace), or a specialized tracing tool alongside an existing metrics setup (Jaeger or Zipkin with Prometheus). The right fit depends on your team size, budget, and how much operational overhead you are willing to carry.
OpenObserve is worth a serious look if you are feeling the cost pressure of SaaS platforms or the complexity of running four separate open source systems. It is genuinely unified, open source, and built for the cardinality that Kubernetes environments produce.
Whatever you pick, instrument with OpenTelemetry from the start. It keeps future options open: switching backends becomes a configuration change, not a project.
OpenObserve Cloud gives you unified logs, metrics, and traces with a free tier up to 50 GB/day, no credit card required.
Related guides:
Passionate about observability, AI systems, and cloud-native tools. All in on DevOps and improving the developer experience.


