Monitoring Claude Code Usage with OpenObserve and Querying via MCP

Gorakhnath Yadav
June 25, 2026
17 min read
Don’t forget to share!
What Nobody Tells You About Running AI in Production
Try OpenObserve Cloud today for more efficient and performant observability.
TLDR
- To monitor Claude Code usage, set
CLAUDE_CODE_ENABLE_TELEMETRY=1and point its OTLP exporter at OpenObserve. Claude Code then ships token counts, cost, sessions, tool decisions, and per-prompt events as standard OpenTelemetry signals.- Part 1 covers instrumentation: the exact metrics and events Claude Code emits, how to route them to OpenObserve, how to attribute usage by developer, repo, and feature, and how to build a team productivity dashboard.
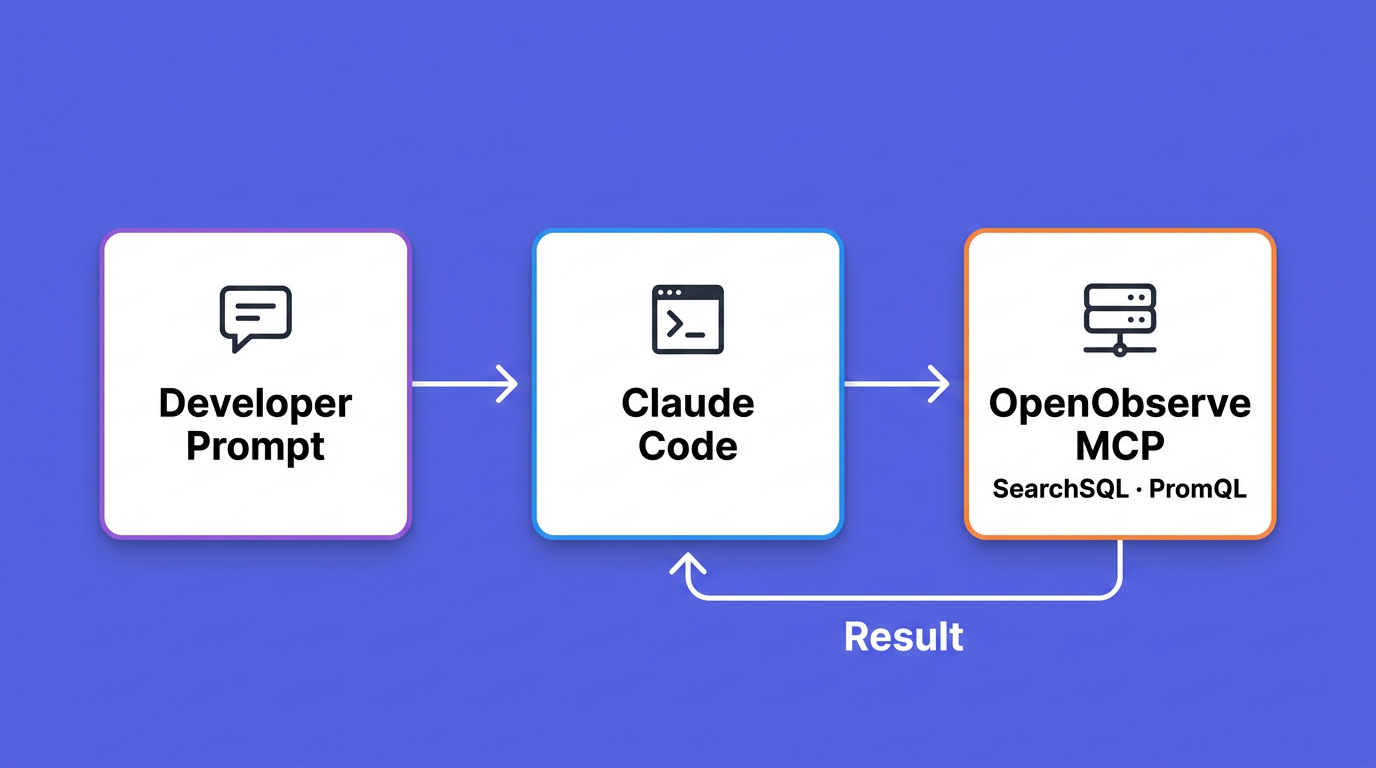
- Part 2 closes the loop: connect Claude Code to OpenObserve's MCP server and ask questions about that same telemetry in natural language, without leaving the terminal.
- The OpenObserve MCP server runs SQL and PromQL against your streams, so you debug usage by asking questions instead of writing queries.
- The post ends with safe MCP usage for production data: least-privilege tokens, read-only scoping, rate limits, and audit logging.
Teams adopt Claude Code quickly, and then the questions start. What is it costing per developer? Which repositories drive the most token spend? Is the team on Opus when Sonnet would do? Are people accepting Claude's edits or rejecting them? The data exists, but it usually never leaves the laptop, so dashboards built for services have nothing to show.
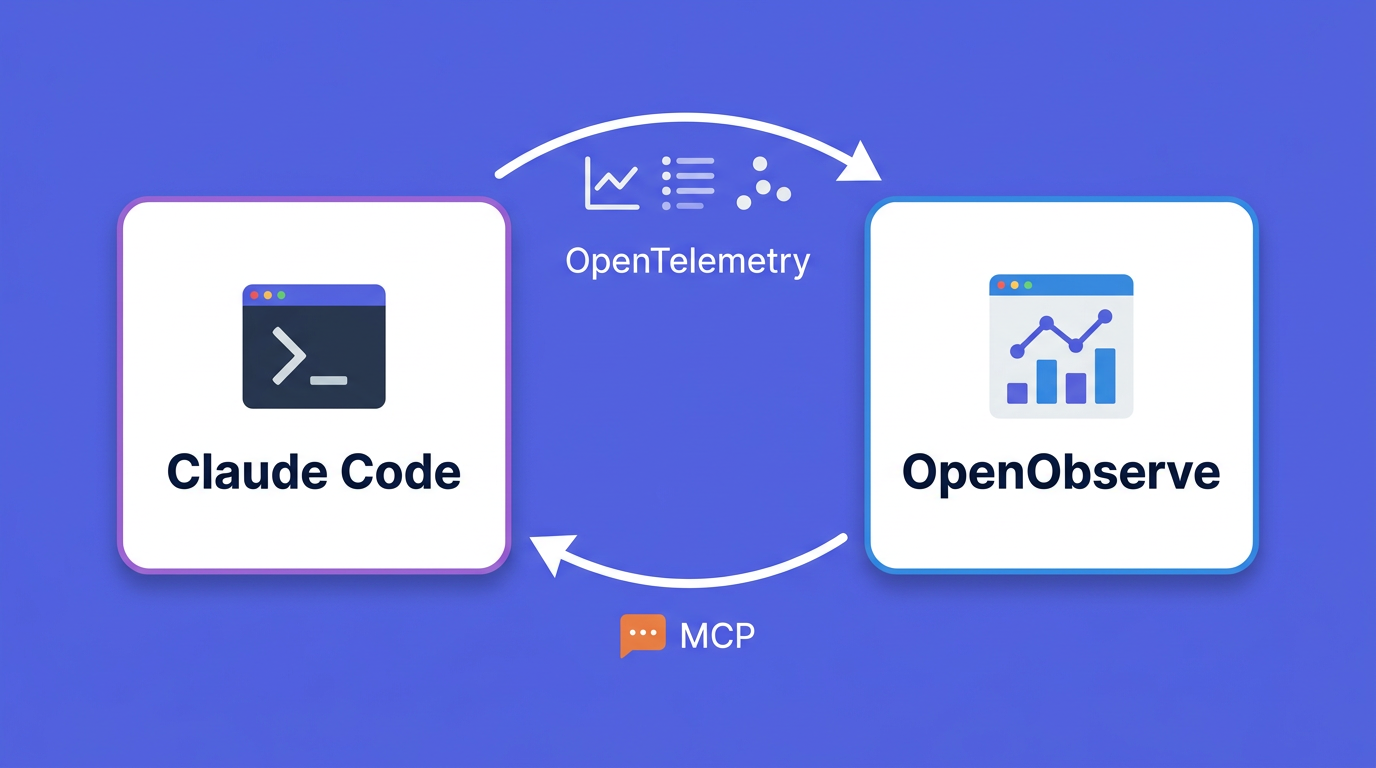
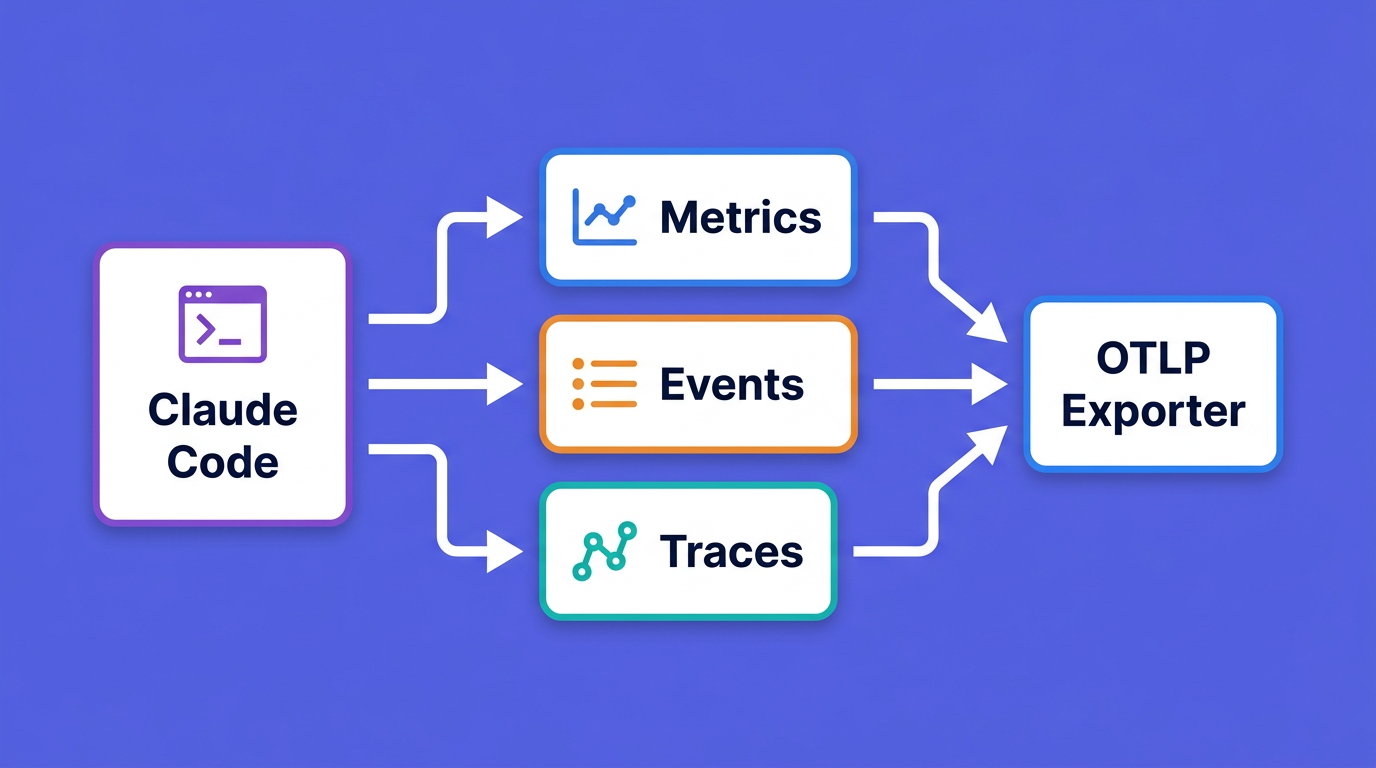
Claude Code answers this by exporting OpenTelemetry signals: metrics for the numbers you chart, events for the audit trail, and distributed traces in beta. This guide instruments Claude Code as the observed workload, lands its telemetry in OpenObserve, and builds a productivity dashboard. Then it does something most monitoring guides skip: it points Claude Code back at that data through the OpenObserve MCP server, so you can debug usage by asking questions instead of writing queries.
Claude Code charges by token consumption, and per-developer spend varies widely with model choice and how many instances people run. Anthropic's own guidance puts the average at "around $13 per developer per active day and $150-250 per developer per month, with costs remaining below $30 per active day for 90% of users" (Claude Code docs). Those are useful planning numbers, but they are averages. Your finance team wants the spend for your org, split by team and project, and your engineering leads want to know whether the spend turns into merged work.
None of that shows up until the telemetry reaches a backend you can query. Claude Code emits the signals; you decide where they go and what you ask of them. The rest of this guide is the path from "telemetry enabled" to "questions answered."
Before wiring anything up, it helps to know exactly what arrives. Claude Code exports three kinds of signal, and the names below are stable identifiers you will query against, so they are worth reading once.
Metrics are numeric time series, ideal for charts, aggregations, and alerts. Claude Code exports eight:
| Metric | Meaning | Unit |
|---|---|---|
claude_code.session.count |
CLI sessions started | count |
claude_code.lines_of_code.count |
Lines added or removed | count |
claude_code.pull_request.count |
Pull requests created | count |
claude_code.commit.count |
Git commits created | count |
claude_code.cost.usage |
Estimated session cost | USD |
claude_code.token.usage |
Tokens used | tokens |
claude_code.code_edit_tool.decision |
Accept or reject on edits | count |
claude_code.active_time.total |
Active time, idle excluded | seconds |
The cost and token counters carry rich attributes you will lean on: model, type (input, output, cacheRead, cacheCreation), query_source (main, subagent, auxiliary), and newer keys like effort, agent.name, skill.name, and mcp_server.name. The code-edit decision counter adds decision (accept or reject) and language, so you can see acceptance rates per programming language.
Events are structured log records emitted per action, ideal for audit trails and debugging a single session. The ones you will use most:
claude_code.user_prompt: a prompt was submitted. Prompt text is redacted unless you opt in.claude_code.api_request: one model request, with model, cost_usd, duration_ms, input_tokens, output_tokens, cache_read_tokens, and cache_creation_tokens.claude_code.api_error and claude_code.api_refusal: failed and refused requests. api_error carries status_code; both carry the retry attempt count. (A refusal is stop_reason: "refusal" on a successful response, not an HTTP error, so it has no status code.)claude_code.tool_result: a tool finished, with tool_name, success, duration_ms, and (when tool details are enabled) a tool_input payload that includes file_path for Read, Edit, and Write.claude_code.tool_decision: a permission decision, with decision and source.Every event carries a prompt.id, a UUID that links a single prompt to all the API calls and tool runs it triggered. That correlation key is what turns a pile of events into a readable session timeline.
With CLAUDE_CODE_ENABLE_TELEMETRY=1 and CLAUDE_CODE_ENHANCED_TELEMETRY_BETA=1, Claude Code exports spans that connect each prompt to its downstream work:
claude_code.interaction
├── claude_code.llm_request
├── claude_code.hook
└── claude_code.tool
    ├── claude_code.tool.blocked_on_user
    └── claude_code.tool.execution
The llm_request span carries ttft_ms (time to first token), token counts, and stop_reason. The tool.blocked_on_user span isolates time spent waiting on a permission prompt from time spent actually running the tool, which is the difference between "Claude is slow" and "I am slow to approve." Traces are off by default and reuse the same OTLP endpoint as metrics and logs. If you instrument the Claude Agent SDK programmatically rather than the CLI, the span model is identical; see Observability for the Claude Agent SDK for that path.
A few standard attributes ride on every signal and decide what your dashboards can slice by. user.email and account identifiers are attached automatically when you authenticate with OAuth. terminal.type tells VS Code from iTerm from tmux. model and session.id are present on the relevant signals. For anything Claude Code does not know about, such as team or cost center, you supply it yourself with OTEL_RESOURCE_ATTRIBUTES, covered next.
You need a running OpenObserve instance (self-hosted or Cloud) and Claude Code installed.
OpenObserve generates the configuration for you, so there is no need to assemble it by hand. In the dashboard, open Data Sources → AI Integrations and select Claude Code: the page shows a ready-to-run snippet with your org's OTLP endpoint URL and the Authorization: Basic <token> header already filled in — no manual base64 encoding of credentials. Copy that snippet and you are done; the next section breaks down what each variable does.
OpenObserve's OTLP base endpoint is https://<host>/api/<org>. The OpenTelemetry SDK appends /v1/metrics, /v1/logs, and /v1/traces itself, so the endpoint must not end in a trailing slash, a slash there returns a 404. The same endpoint, protocol, and auth header serve all three signals. OpenObserve names the logs and traces stream from the stream-name header, so the example sets it to claude_code to match the dashboard; without it, logs land in the default stream instead. (Metrics go to per-metric claude_code_* streams regardless.) Traces are beta and off by default, so emitting spans takes the extra CLAUDE_CODE_ENHANCED_TELEMETRY_BETA=1 flag plus a traces exporter. Set the environment variables before launching Claude Code:
# Enable telemetry (traces also need the beta flag below)
export CLAUDE_CODE_ENABLE_TELEMETRY=1

# Export metrics, events, and traces over OTLP/HTTP
export OTEL_METRICS_EXPORTER=otlp
export OTEL_LOGS_EXPORTER=otlp
export OTEL_TRACES_EXPORTER=otlp
export OTEL_EXPORTER_OTLP_PROTOCOL=http/protobuf

# Distributed traces are beta: this flag is required to emit spans
export CLAUDE_CODE_ENHANCED_TELEMETRY_BETA=1

# OpenObserve OTLP endpoint (no trailing slash); serves metrics, logs, and traces
export OTEL_EXPORTER_OTLP_ENDPOINT="https://your-instance.openobserve.ai/api/your-org"

# Basic auth header (copied from Data Sources -> AI Integrations -> Claude Code),
# plus stream-name so logs and traces land in the claude_code stream the dashboard queries
export OTEL_EXPORTER_OTLP_HEADERS="Authorization=Basic <YOUR_BASE64_TOKEN>,stream-name=claude_code"

# Optional during setup: shorter intervals so data shows up sooner
export OTEL_METRIC_EXPORT_INTERVAL=10000
export OTEL_LOGS_EXPORT_INTERVAL=5000
export OTEL_TRACES_EXPORT_INTERVAL=5000

claude
The default export intervals are 60 seconds for metrics and 5 seconds for logs. The shorter values above are for setup only; reset them for production so you are not paying for export overhead you do not need. Claude Code's metrics use delta temporality by default, which OpenObserve accepts; leave OTEL_EXPORTER_OTLP_METRICS_TEMPORALITY_PREFERENCE alone unless you have a specific reason to switch.
For more on the OTLP exporter knobs and how OpenObserve receives them, see the OTLP ingestion docs and the OTLP exporters primer.
Sending straight from each laptop works for a quick test. For a team, put an OpenTelemetry Collector in the middle. The Collector is where you batch, redact, add environment tags, and fan out to more than one backend without touching developer machines again.
receivers:
  otlp:
    protocols:
      http:
        endpoint: 0.0.0.0:4318
      grpc:
        endpoint: 0.0.0.0:4317

processors:
  batch: {}
  resource:
    attributes:
      - key: deployment.environment
        value: dev
        action: upsert

exporters:
  otlphttp/openobserve:
    endpoint: "https://your-instance.openobserve.ai/api/your-org"
    headers:
      Authorization: "Basic <YOUR_BASE64_TOKEN>"
      stream-name: claude_code

service:
  pipelines:
    metrics:
      receivers: [otlp]
      processors: [batch, resource]
      exporters: [otlphttp/openobserve]
    logs:
      receivers: [otlp]
      processors: [batch, resource]
      exporters: [otlphttp/openobserve]
    traces:
      receivers: [otlp]
      processors: [batch, resource]
      exporters: [otlphttp/openobserve]
Then each developer points Claude Code at the local Collector instead of at OpenObserve directly:
export OTEL_EXPORTER_OTLP_ENDPOINT=http://localhost:4318
export OTEL_EXPORTER_OTLP_PROTOCOL=http/protobuf
OpenObserve also accepts OTLP over gRPC on port 5081 if you prefer gRPC between the Collector and OpenObserve. Switching is more than a port change: use the otlp/openobserve exporter with endpoint: "your-instance.openobserve.ai:5081" and add organization and stream-name headers next to Authorization, since the gRPC request no longer carries the org in the URL the way /api/<org> does over HTTP.
user.email, the account identifiers, and organization.id all arrive automatically under OAuth, the standard attributes from earlier. What Claude Code cannot infer is your org structure: team, cost center, and which repo a session belongs to. You add those through OTEL_RESOURCE_ATTRIBUTES, which Claude Code attaches to every metric datapoint and event:
export OTEL_RESOURCE_ATTRIBUTES="team.id=platform,cost_center=eng-42,repo.name=web-frontend"
A few rules from the docs that save a debugging session later. Values cannot contain spaces, so use Johns_Org, not John's Org, or percent-encode. Each custom key becomes a label on every metric series, so a high-cardinality value such as a raw branch name will inflate storage; keep feature to a small set of names. The example hardcodes generic values for clarity. To have each repo tag itself instead, resolve the name per shell, for example repo.name=$(basename "$(git rev-parse --show-toplevel 2>/dev/null)"), which is a natural fit for a direnv or shell-profile setup so each project tags itself.
Per-shell exports do not scale past a pilot. For everyone, distribute a managed settings file whose values cannot be overridden by users:
{
  "env": {
    "CLAUDE_CODE_ENABLE_TELEMETRY": "1",
    "CLAUDE_CODE_ENHANCED_TELEMETRY_BETA": "1",
    "OTEL_METRICS_EXPORTER": "otlp",
    "OTEL_LOGS_EXPORTER": "otlp",
    "OTEL_TRACES_EXPORTER": "otlp",
    "OTEL_EXPORTER_OTLP_PROTOCOL": "http/protobuf",
    "OTEL_EXPORTER_OTLP_ENDPOINT": "https://your-instance.openobserve.ai/api/your-org",
    "OTEL_EXPORTER_OTLP_HEADERS": "Authorization=Basic <YOUR_BASE64_TOKEN>,stream-name=claude_code"
  }
}
Place it at /Library/Application Support/ClaudeCode/managed-settings.json on macOS, /etc/claude-code/managed-settings.json on Linux and WSL, or C:\Program Files\ClaudeCode\managed-settings.json on Windows, and push it with your MDM. One caveat worth planning around: on Bedrock, Vertex, and Foundry, Claude Code does not send cost metrics from your cloud, so teams on those backends track spend through their gateway instead.
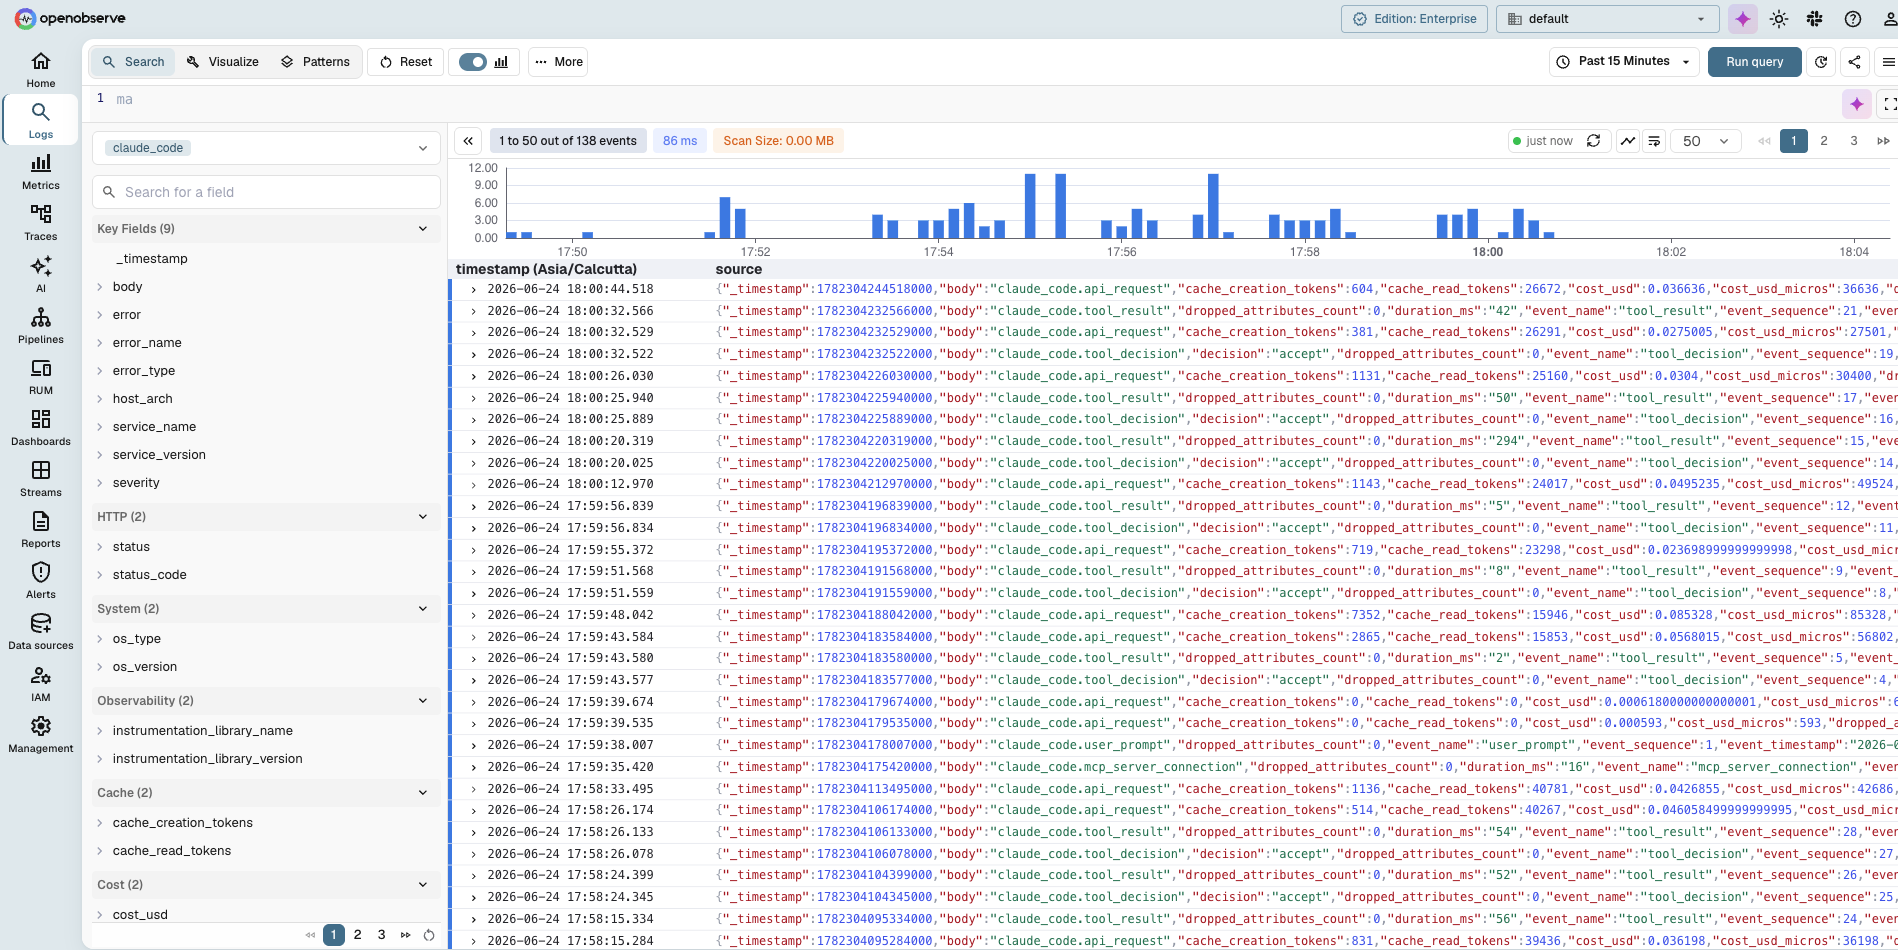
Launch Claude Code, run a few prompts, and open the Logs view in OpenObserve. Claude Code's events arrive as a logs stream, its metrics as metric streams, and, with the beta tracing flag set, its spans show up under the Traces view. If nothing shows up, drop the export interval to a couple of seconds, check that the endpoint has no trailing slash, and confirm the Basic token decodes to email:password. If logs and metrics land but traces do not, confirm CLAUDE_CODE_ENHANCED_TELEMETRY_BETA=1 and OTEL_TRACES_EXPORTER=otlp are both set, since tracing stays off without them.
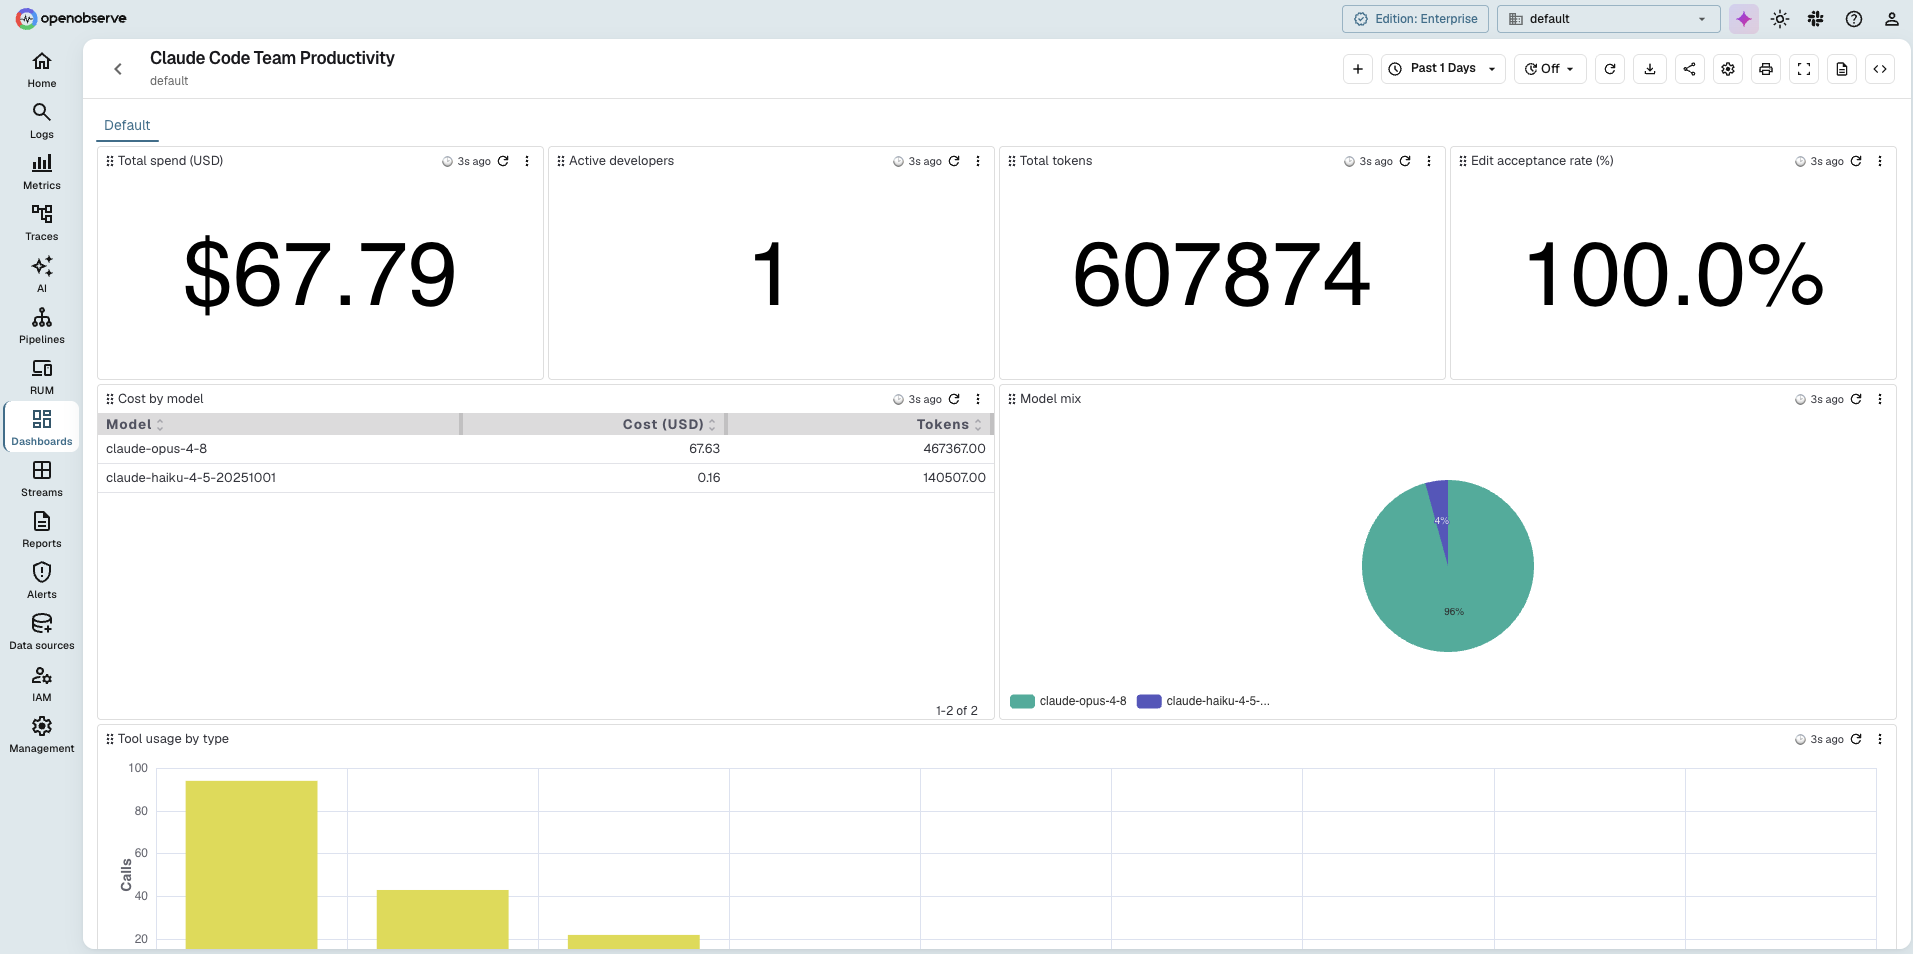
A ready-made dashboard is available, so you don't have to build each panel by hand. Download the Claude Code dashboard JSON, then in OpenObserve open Dashboards, click Import, and upload the file. It builds the full set of panels in one step: org-wide totals and trends on top (spend, active developers, tokens, edit-acceptance rate, token usage over time, model mix, cost by model, tool usage), and per-developer breakdowns below (cost, edit-acceptance rate, and model mix by developer).
One thing to adjust after import: every panel queries an events stream named claude_code. If you named your stream differently, open each panel and point the stream reference at your setup.
For framing Claude Code spend alongside the rest of your AI workloads, the OpenTelemetry for LLMs guide and LLM observability tools cover the wider token-cost picture.
Every cost panel in the dashboard sums one field, cost_usd, that Claude Code attaches to each api_request event. That value is Claude Code's own estimate, not a billed figure: for each call it multiplies the token counts by Anthropic's per-model prices and reports the result. It is cache-aware (cache reads are priced far below fresh input tokens) and close to your invoice, but it is computed client-side. As noted earlier, on Bedrock, Vertex, and Foundry Claude Code does not emit cost at all, so teams on those backends price spend at the gateway.
Because the raw token counts (input_tokens, output_tokens, cache_read_tokens, cache_creation_tokens) are in the stream, you can also price them with your own rates, which is useful if you have negotiated pricing or want to cross-check the estimate. Don't hardcode rates into the SQL of every panel. Keep them in one place as an OpenObserve enrichment table and join against it.
Create a CSV with one row per model (per 1M tokens; a 5-minute cache write is 1.25x the input rate, a cache read 0.1x) and upload it under Pipelines → Enrichment Tables as model_pricing:
model,input_rate,output_rate,cache_write_rate,cache_read_rate
claude-opus-4-8,5.00,25.00,6.25,0.50
claude-sonnet-4-6,3.00,15.00,3.75,0.30
claude-haiku-4-5,1.00,5.00,1.25,0.10
Then join the events stream against it. OpenObserve stores enrichment-table columns as text, so cast the rate columns to numbers:
SELECT c.model,
  ROUND(SUM(
      c.input_tokens          / 1000000.0 * CAST(p.input_rate       AS DOUBLE)
    + c.output_tokens         / 1000000.0 * CAST(p.output_rate      AS DOUBLE)
    + c.cache_creation_tokens / 1000000.0 * CAST(p.cache_write_rate AS DOUBLE)
    + c.cache_read_tokens     / 1000000.0 * CAST(p.cache_read_rate  AS DOUBLE)
  ), 2) AS computed_cost_usd
FROM "claude_code" c
JOIN "model_pricing" p ON c.model = p.model
WHERE c.event_name = 'api_request'
GROUP BY c.model
Two things keep this honest. Populate the CSV with the model IDs exactly as they appear in the stream, including any date suffix (claude-haiku-4-5-20251001); run SELECT DISTINCT model FROM "claude_code" first, because the join matches on the exact string and any model missing from the table is silently dropped from the total. And the result should land close to SUM(cost_usd) from the panels above — if it is far off, a model is missing from the table or a rate is stale. The rates here are current as of writing; confirm Anthropic's current pricing before relying on them.
The dashboard answers questions you already knew to ask. Debugging usage is more open-ended: "why did spend jump on Tuesday," "who is still on Opus for trivial edits," "which repo drove the cache-miss spike." OpenObserve ships an MCP server so you can ask those from inside Claude Code, and it runs the SQL or PromQL for you. This complements the broader MCP servers for observability guide; here we point it at the Claude Code data we just collected.
The MCP server is part of the Enterprise edition. Enable it on your OpenObserve instance:
export O2_AI_ENABLED="true"
export O2_TOOL_API_URL="http://your-openobserve-host:5080"
Set O2_TOOL_API_URL to wherever the OpenObserve API is reachable from the server: http://localhost:5080 for a single-host install, or the Docker Compose service name for a containerized deployment. Full setup notes are in the MCP integration docs.
The MCP endpoint follows the same path convention as ingestion, with /mcp on the end. Add it to Claude Code with a scoped Basic token:
claude mcp add openobserve https://your-instance.openobserve.ai/api/your-org/mcp \
  -t http \
  --header "Authorization: Basic <YOUR_BASE64_TOKEN>"
Confirm it registered:
claude mcp list
Now ask. Claude Code picks the right tool, writes the query, and explains the result. The server front-lists a handful of tools and exposes the rest of its roughly 120-tool catalog through a tool_search lookup, so the agent discovers what it needs on demand instead of loading every schema up front. For Claude Code telemetry the two that matter are SearchSQL over the event streams and PrometheusRangeQuery over the metrics.
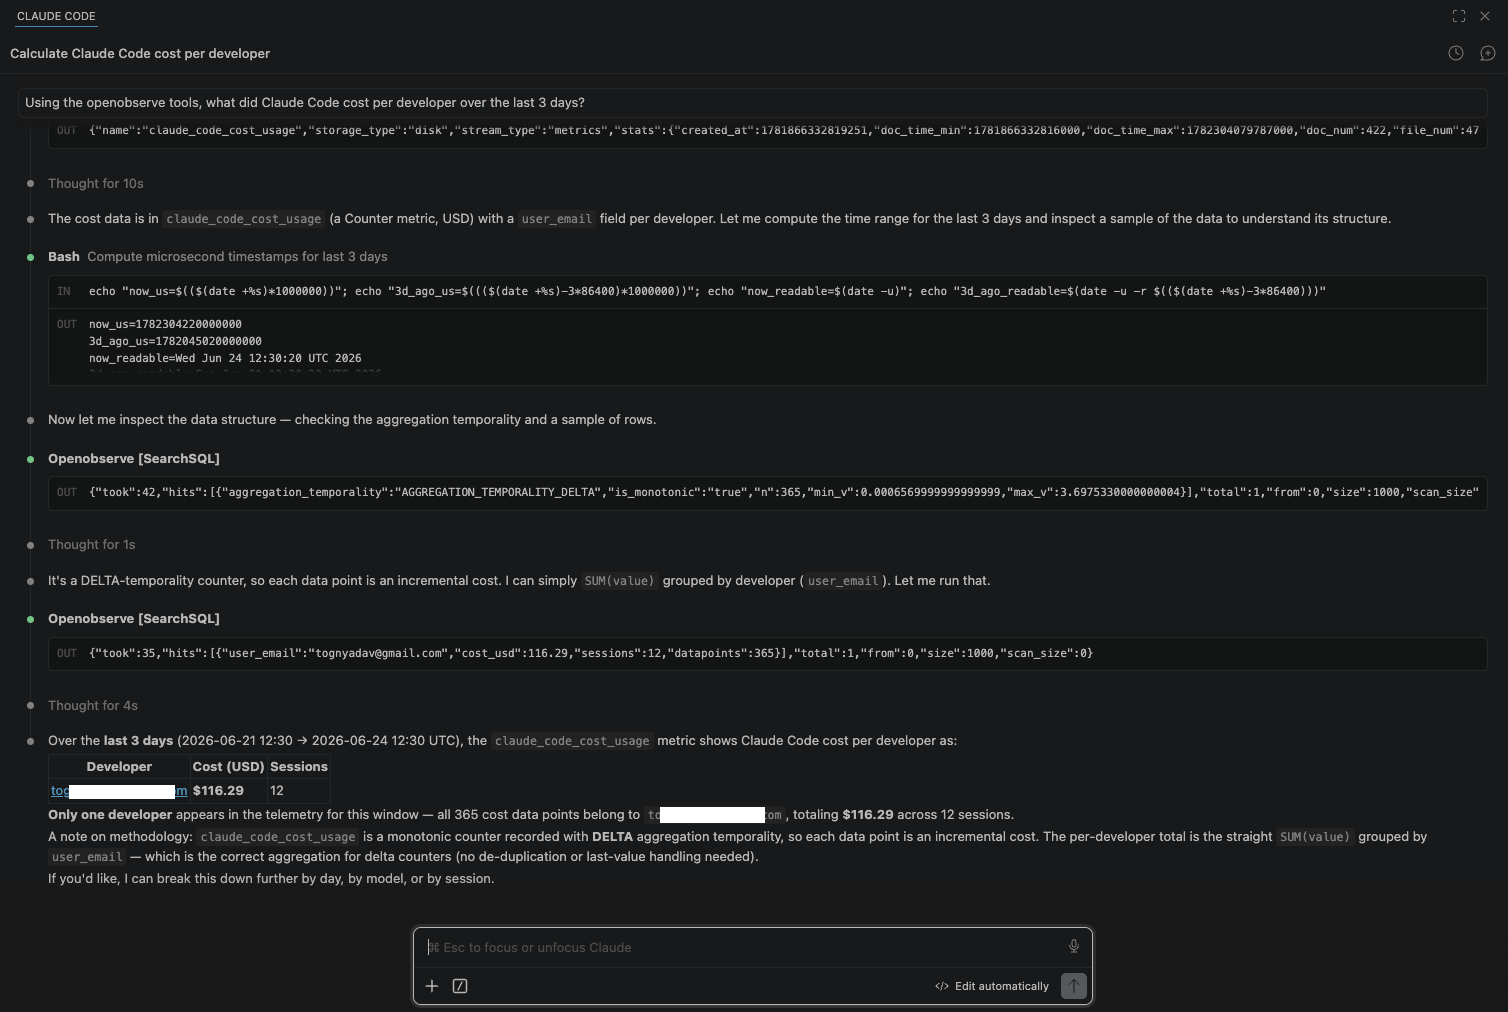
> Using the openobserve tools, what did Claude Code cost per developer
  over the last 7 days?

> Which model produced the most output tokens yesterday, and what did
  each model cost?

> Show me the five files Claude Code edited most this week, and the
  accept-versus-reject rate on those edits.

> p95 tool execution duration today, broken down by tool_name.
Behind the first prompt, the agent issues the same SearchSQL you would type into the Logs view, so the answer matches your dashboard exactly rather than being a separate estimate. Because the agent can also create dashboards and alerts, a natural follow-up is "save that cost-per-developer query as a dashboard panel," which it can do in the same session. Scope the token to read-only if you do not want that, covered in the next section.
An MCP token that can query production telemetry is a database credential, and the prompts above prove it: anything in the data is one question away. Treat it accordingly.
CreateAlert, CreateDashboard, and StreamCreate. With RBAC enabled, scope the user so those calls are denied; without it, any authenticated token can run them. Enable write access only for the session where you need it.SearchSQL tool takes a timeout_seconds argument) and a default 1,000-row result cap, which together bound the blast radius of a runaway agent loop.OTEL_LOG_USER_PROMPTS or OTEL_LOG_RAW_API_BODIES during instrumentation, your telemetry contains prompt text and code, and an MCP query can surface it. Tier your logging so sensitive content never lands where a casual question can reach it.For alerting on the spikes these queries reveal, such as a sudden jump in cost or cache-miss tokens, AI anomaly detection and the patterns in AI-assisted monitoring with MCP extend the same setup from manual debugging to automated detection.
The MCP server and the OTLP ingestion endpoint both come ready on OpenObserve Cloud, so you can skip the instance setup and go straight to pointing Claude Code at your org endpoint. Spin up a free account and start collecting Claude Code telemetry at OpenObserve Cloud.
Gorakhnath is a passionate developer advocate, working on bridging the gap between developers and the tools they use. He focuses on building communities and creating content that empowers developers to build better software.


