OpenObserve vs Langfuse: Unified Observability vs LLM-Specific Platform (2026)




Ready to get started?
Try OpenObserve Cloud today for more efficient and performant observability.
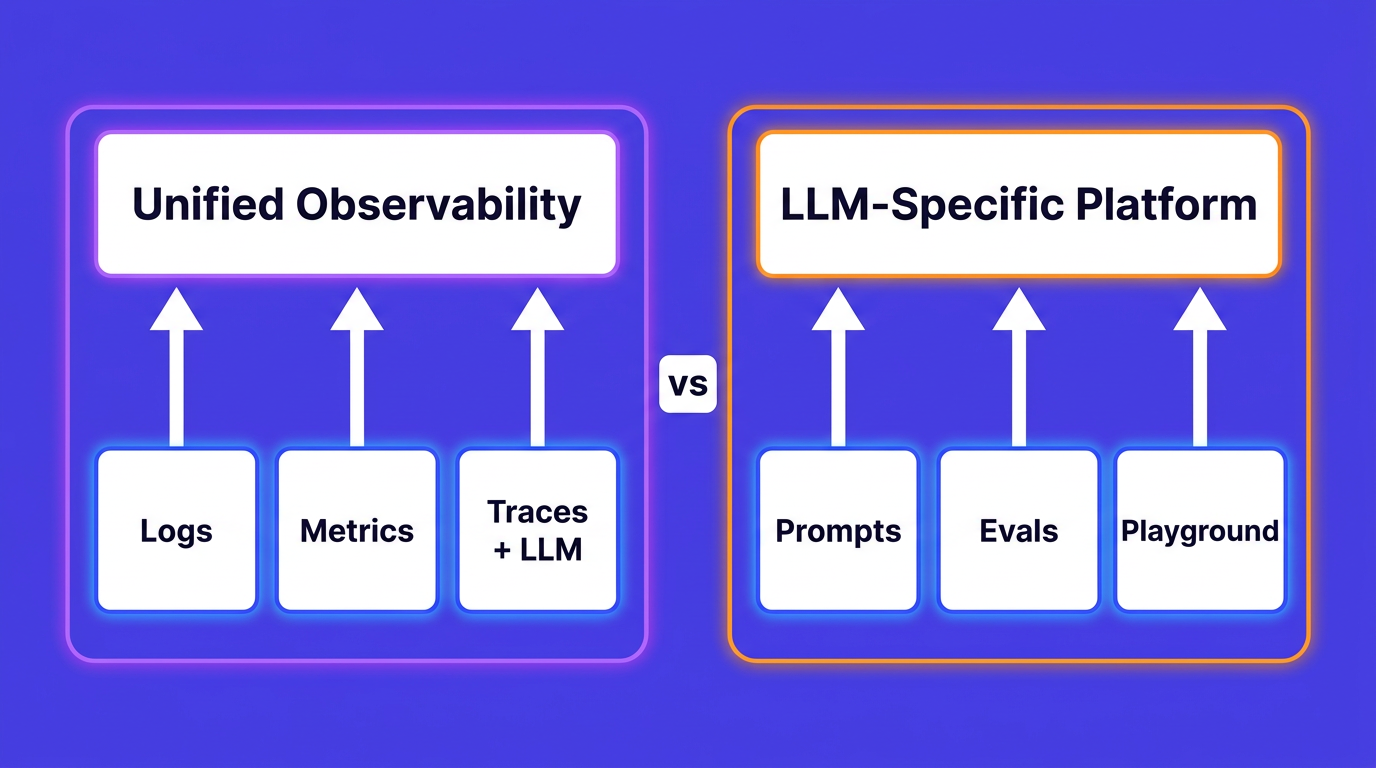
TL;DR: The OpenObserve vs Langfuse decision is not really tool against tool, it is two categories. Langfuse is a purpose-built LLM engineering platform: prompt management, a playground, evaluation datasets, and LLM-as-a-judge, plus tracing for your model calls. OpenObserve is a unified observability backend that stores logs, metrics, traces, RUM, and LLM spans together, at columnar storage cost. Here is the short version:
- Langfuse wins when your bottleneck is the LLM development loop: iterating on prompts, running evals, and inspecting agent runs with LLM-specific tooling.
- OpenObserve wins when you want one backend for the whole system, so an LLM latency spike sits next to the database and host telemetry that explains it, at lower storage cost.
- Use both when you want Langfuse for prompts and evals and OpenObserve as the observability backend for everything, LLM traces included. Both speak OpenTelemetry, so you instrument once.
OpenObserve vs Langfuse: the short answer
Both tools observe LLM applications, but they were built to solve different problems, so the honest answer depends on what is actually slowing you down.
Langfuse is one of the most widely adopted open source LLM-specific platforms. Its core covers end-to-end tracing of model calls, prompt management, evaluation, and datasets, which is the toolkit a team needs while it is still shaping prompts and measuring output quality.
OpenObserve is an open source observability platform built in Rust. It ingests logs, metrics, traces, real user monitoring, and LLM spans into a single backend and queries all of it with SQL. LLM observability shipped as a dedicated feature in early 2026, so LLM traces are a first-class signal rather than a bolt-on.
Here is the quick take before the detail:
| OpenObserve | Langfuse | |
|---|---|---|
| Category | Unified observability (infra + LLM) | LLM engineering and observability |
| Best for | One backend for the whole stack, at scale | The LLM development and evaluation loop |
| License | AGPL-3.0 | MIT (core) |
| Deployment | Single binary | Multi-service stack |
If you want the wider field of LLM tools rather than a head-to-head, the open source LLM observability tools comparison covers ten platforms including Arize Phoenix, Helicone, and Comet Opik.
Two tools built for two different problems
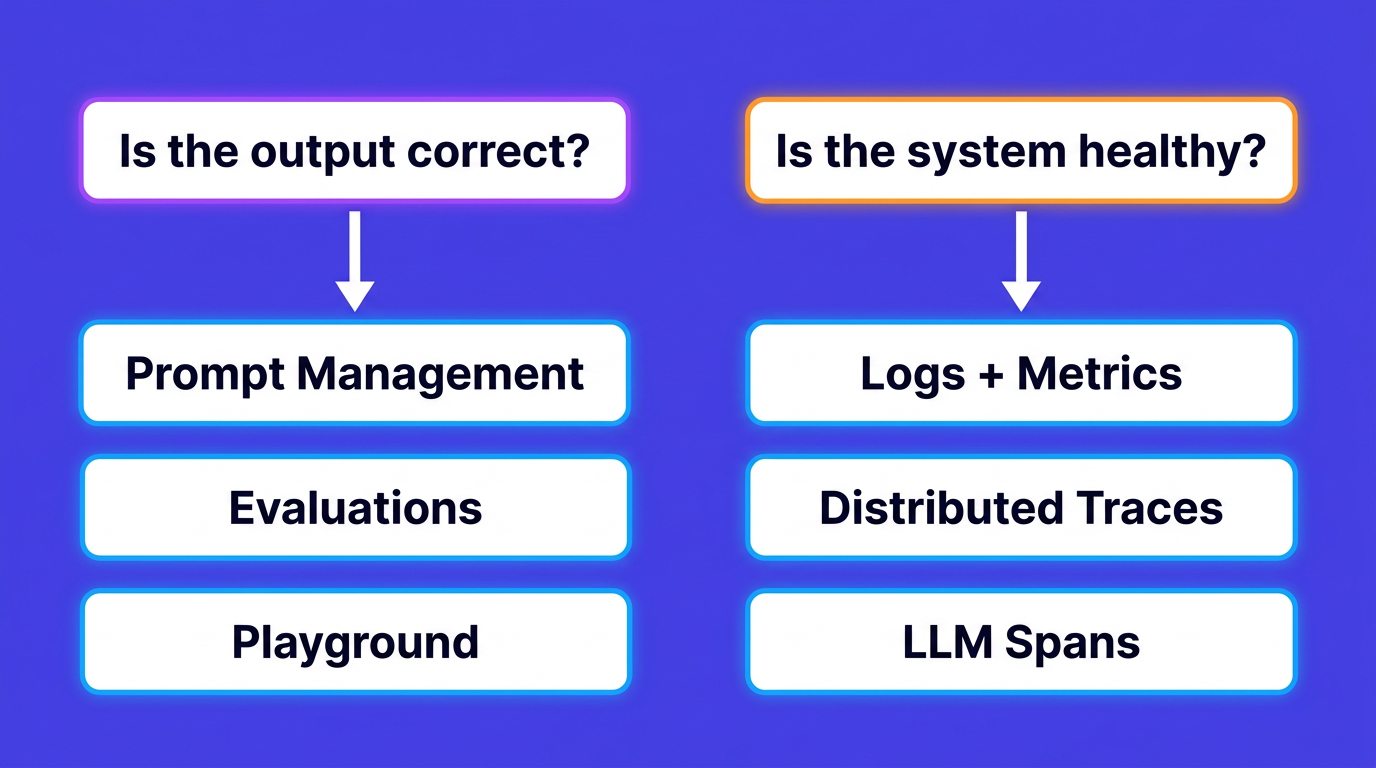
The cleanest way to think about this is by the question each tool answers.
Langfuse answers: is the model output correct? It treats prompts, generations, token usage, and quality scores as first-class objects. When a response is wrong, you replay the exact conversation, open the failing trace in a playground, tweak the prompt, and score the result against a dataset. That is LLM-behavior observability, and Langfuse is good at it.
OpenObserve answers: is the whole system healthy, LLM included? It treats an LLM call as one more span in a distributed trace, sitting in the same store as the API gateway, the vector database, the queue, and the host metrics. When a request is slow, you see whether the model was slow or whether a downstream dependency dragged it down. That is system observability with LLM awareness built in.
Neither framing is wrong. The mistake is expecting one tool to be excellent at both. A dedicated LLM platform will always have deeper prompt and eval features than a general backend, and a general backend will always correlate across the full stack better than an LLM-only tool. The rest of this comparison is about which side of that trade matters for your team, and how to combine them when both do.
Both tools are OpenTelemetry-friendly, which keeps the decision reversible. Langfuse exposes an OTLP endpoint and focuses on gen_ai.* spans. OpenObserve ingests gen_ai.* spans natively as part of standard OpenTelemetry traces. If you want the background on those conventions, see OpenTelemetry for LLMs.
What the ClickHouse acquisition changed
On January 16, 2026, ClickHouse announced it had acquired Langfuse. If you are evaluating Langfuse in 2026, this is context you should factor in, not because it changes the features, but because it changes the strategic shape of the decision.
What stayed the same, per Langfuse's own announcement:
- Langfuse remains open source under its existing MIT core license.
- Self-hosting stays supported as a first-class deployment path.
- Langfuse Cloud keeps running as a standalone service, same endpoints and same experience.
What changed is positioning. Langfuse is now owned by a database company rather than an independent startup. That is worth a moment of thought for two reasons. First, long-term data ownership: your LLM telemetry increasingly lives inside a specific vendor's platform, so it is fair to ask how portable that data is and how the roadmap will prioritize open self-hosting over the commercial cloud. Second, data residency: if you moved to Langfuse partly for its European privacy posture, confirm how region and compliance guarantees carry forward under the new parent. For teams that handle sensitive prompt content, the same questions apply to any backend, which is why redacting PII from LLM telemetry matters regardless of which tool you choose.
One thing worth naming: both products now rely on columnar storage. Langfuse v3 stores traces and observations in ClickHouse. OpenObserve stores everything in Parquet on object storage. The difference is scope. Langfuse covers the LLM layer, while OpenObserve covers the entire observability stack, LLM included, in one open source backend you run yourself.
Where Langfuse wins
Being the vendor here does not mean pretending Langfuse is second best at its own job. On the LLM development loop, Langfuse is stronger, and these are the cases where it is the right call.
Prompt management. Langfuse gives you version-controlled prompts with labels. Each version is tracked, and you "deploy" a version by assigning it the production label, then roll back by reassigning that label in the UI. Your application fetches the current production prompt by label at runtime, so you iterate without a code deploy. OpenObserve has nothing equivalent, because it is an observability backend, not a prompt store.
Evaluations and datasets. Langfuse ships LLM-as-a-judge, code-based evaluators, human annotation, and dataset-driven experiments. You build a test set, run a prompt or model change against it, and compare scores across versions. This is the measurement layer that tells you whether a change actually improved output quality, and it is core Langfuse functionality rather than an integration.
The playground. From a failed production trace, you open the exact prompt and model configuration in a playground and iterate on it directly. That tight replay-to-fix loop is a genuine productivity feature for prompt engineering that a general observability tool does not try to replicate.
Framework SDK depth. Langfuse maintains typed SDKs and integrations across LangChain, LlamaIndex, the OpenAI SDK, LiteLLM, the Vercel AI SDK, Haystack, and more, with LLM-domain concepts modeled directly in the API.
If prompt iteration and evaluation are the daily work of your team, Langfuse earns its place. OpenObserve is not trying to win that specific fight.
Where OpenObserve wins
OpenObserve's advantage is not a longer feature list on the LLM layer. It is the backend everything lands in.
One backend, real correlation
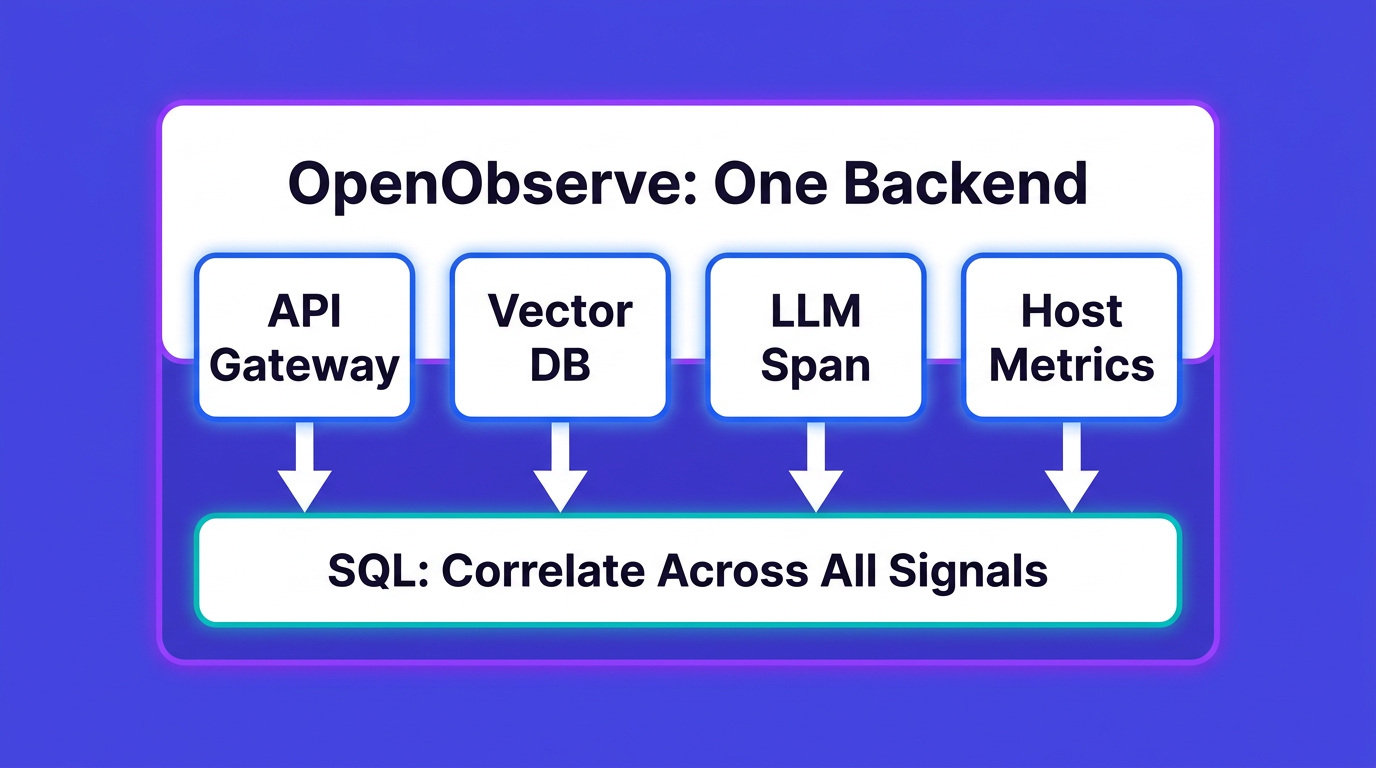
An LLM request is rarely just a model call. It passes through an API gateway, a retriever, a vector database, maybe a reranker, and several service hops, each with its own logs and metrics. When latency spikes, the interesting question is usually which of those stages caused it.
If your LLM traces live in an LLM-only tool and your infrastructure telemetry lives in a separate backend, you cannot answer that in one place. You see the model span was slow in one UI, then go hunting in another for the host or database event that explains it, and you stitch the timeline together by hand. With OpenObserve, the LLM span and the infrastructure telemetry share a store and a query engine, so the correlation is a single query instead of a cross-tool investigation. This is the same signal correlation that makes AIOps workflows work: root-cause analysis needs LLM behavior and infrastructure signals in the same place.
Storage cost at scale
LLM telemetry is heavy. Full prompts and completions are large, cardinality is high once you tag per user and per session, and retention adds up fast. Storage is where the bill grows.
OpenObserve stores data in Parquet columnar format on object storage, which compresses aggressively. In a June 2026 benchmark against Elasticsearch at roughly 1.1 TB of ingested logs, OpenObserve measured about 87x lower monthly storage cost ($2.71 versus $236.16) with 9.5x compression on identical hardware. Log workloads are not identical to LLM traces, and actual results vary, but the columnar model is the reason retaining months of LLM trace history stays affordable. The full methodology is in the Elasticsearch vs OpenObserve benchmark.
Single binary versus a multi-service stack
OpenObserve ships as a single binary. You download it, run it, and you have logs, metrics, traces, and LLM observability. For self-hosting, that is a meaningful operational difference.
Langfuse's self-hosted v3 architecture is a multi-service stack: Postgres for transactional data, ClickHouse for traces and observations, Redis or Valkey for the event queue and caching, and S3-compatible blob storage for raw events, plus separate web and worker containers. It is a capable design, but it is more moving parts to deploy, monitor, and keep healthy than a single process. If your team is small or your priority is a minimal footprint, that difference is real.
Feature matrix: OpenObserve vs Langfuse
| Capability | OpenObserve | Langfuse |
|---|---|---|
| Infrastructure logs | ✅ | ❌ |
| Infrastructure and host metrics | ✅ | ❌ |
| Distributed traces (full stack) | ✅ | ⚠️ LLM spans only |
LLM tracing (gen_ai.* spans) |
✅ | ✅ |
| Prompt management | ⚠️ via integration | ✅ |
| Evaluations (LLM-as-judge, datasets) | ⚠️ via integration | ✅ |
| Prompt playground | ❌ | ✅ |
| Real user and frontend monitoring | ✅ | ❌ |
| Alerts and dashboards | ✅ | ⚠️ LLM metrics only |
| Query language | SQL and PromQL | UI + Metrics API (no query language) |
| Storage engine | Parquet on object storage | Postgres + ClickHouse + Redis + S3 |
| Deployment | Single binary | Multi-service stack |
| OpenTelemetry ingest | ✅ native gen_ai.* |
✅ gen_ai.* focused |
| License | AGPL-3.0 | MIT (core) |
| Pricing model | Per GB ingested and queried | Per unit or event |
✅ strong support, ⚠️ partial or via integration, ❌ not available.
The pattern in the table is the whole argument. OpenObserve fills the top rows (system-wide signals) and Langfuse fills the middle rows (LLM development features). They overlap only on LLM tracing itself.
Pricing models compared
The two tools bill on different units, which matters more than any single number.
Langfuse Cloud charges per unit or event. As of mid-2026, the tiers are (data retention rises by tier):
| Tier | Price per month | Included units per month | Retention |
|---|---|---|---|
| Hobby | $0 | 50k | 30 days |
| Core | $29 | 100k | 90 days |
| Pro | $199 | 100k | 3 years |
| Enterprise | $2,499 | 100k | 3 years |
Overage is $8 per 100k units, with volume discounts at higher tiers. Self-hosting is free under the open source core, with a separately priced enterprise tier for features like project-level RBAC, data retention management, and audit logs.
OpenObserve Cloud charges on volume. As of mid-2026, that is $0.50 per GB ingested and $0.01 per GB queried, with a 14-day trial and no ongoing free cloud tier. Self-hosting is free under AGPL, and the self-hosted enterprise edition is free up to 50 GB per day of ingestion, adding SSO, RBAC, and sensitive data redaction.
The structural point: per-event pricing is predictable when your event count is predictable, but LLM telemetry tends to grow in both count and payload size. GB-based columnar pricing tracks the actual data volume instead. If you want to attribute spend down to the token and model, LLM cost monitoring in OpenObserve covers per-user and per-model breakdowns.
There is also a cost the "run both tools" advice usually skips: two backends means two bills, two query languages, and two places to look during an incident. That overhead is exactly why the unified backend exists, and it is worth counting when you compare the sticker prices.
Choose OpenObserve if, Langfuse if, or use both
No single tool is the right answer for every team. Map the choice to your bottleneck.
Choose Langfuse if
Your team spends its days iterating on prompts and measuring output quality. You want version-controlled prompts you can deploy without a code push, evaluation datasets and LLM-as-a-judge to catch regressions, and a playground wired to your failing traces. You are early enough that the LLM layer is where the risk lives, and you already have infrastructure observability handled elsewhere or do not need it yet. In that situation, a dedicated LLM platform is the sharper tool.
Choose OpenObserve if
You are running LLM features in production alongside real infrastructure, and you want one backend for all of it. You care about correlating an LLM latency spike with the database or host event behind it, retaining months of high-volume trace history without the storage bill dominating, and querying everything in SQL instead of learning a second system. You would rather run a single binary than operate a multi-service stack. For teams consolidating tools, OpenObserve replaces the LLM tracing tool and the infrastructure backend at the same time.
Use both: bring your prompt tool, observe everything
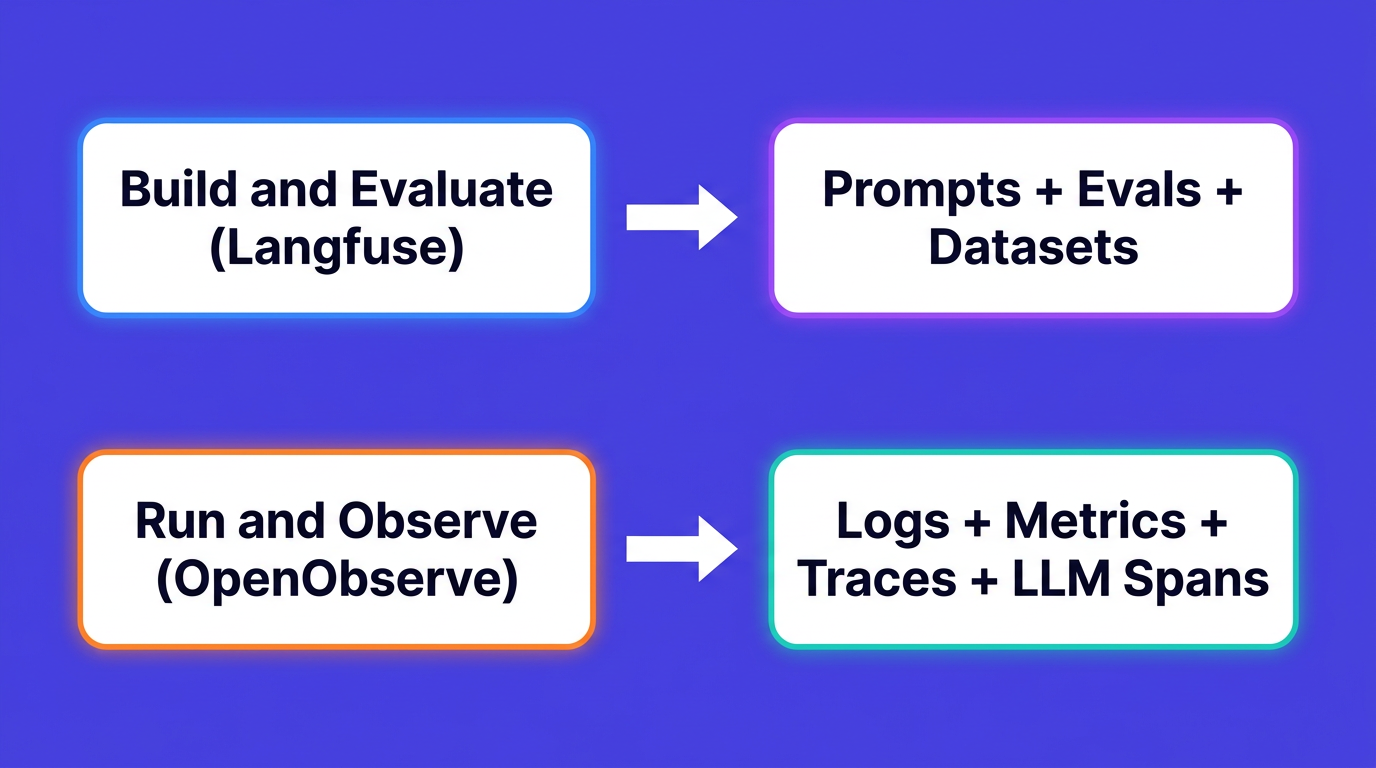
These tools are complementary more than they are competitive, and many teams use each for what it does best. Langfuse owns the development loop: you author and version prompts, run evaluation datasets, and score output quality while you build and iterate. OpenObserve owns production observability: once the application is running, your logs, metrics, traces, and LLM spans land in one backend where you can correlate an LLM slowdown with the infrastructure behind it and keep history at columnar cost.
Split this way, the two do not overlap. Langfuse is where you decide whether a prompt is good before it ships. OpenObserve is where you see how the whole system, model calls included, behaves under real traffic. Teams that want deep prompt and evaluation tooling without giving up full-stack correlation keep both, each in its own lane.
Wiring it up: send LLM traces to OpenObserve
If you already instrument with OpenTelemetry, or with a library like OpenLLMetry that emits gen_ai.* spans, pointing that data at OpenObserve is a configuration change, not a rewrite. Set the OTLP endpoint and auth header:
OTEL_EXPORTER_OTLP_ENDPOINT=https://api.openobserve.ai/api/your_org_slug/v1/traces
OTEL_EXPORTER_OTLP_HEADERS=Authorization=Basic <your_base64_token>,stream-name=default
Your existing chain and agent instrumentation keeps producing the same spans, and OpenObserve picks up the gen_ai.* attributes (model name, token counts, prompt and completion content) as structured, queryable fields. Nothing about your application code changes. If you use Langfuse for prompt management and evaluation, that stays exactly where it is; this only changes where your telemetry lands. For a full framework walkthrough, see tracing LangChain and LlamaIndex with OpenObserve.
Try OpenObserve Cloud
If you want a single backend for LLM traces and infrastructure telemetry, the fastest way to see the correlation is to send some traces and query them next to your logs and metrics. Start a free OpenObserve Cloud trial with no credit card, or self-host the single binary under AGPL. Point your OpenTelemetry exporter at it and your LLM spans will be queryable in minutes.
The self-hosted path is one command:
Frequently Asked Questions
About the Author
Gorakhnath Yadav


Gorakhnath is a passionate developer advocate, working on bridging the gap between developers and the tools they use. He focuses on building communities and creating content that empowers developers to build better software.
Follow OpenObserve on Google
Add OpenObserve as a preferred source to see more of our articles in Google Search and Top Stories.













