In 2026, log analysis has become a core engineering discipline. As distributed systems grow more complex microservices, serverless functions, LLM pipelines, Kubernetes workloads the ability to search, parse, correlate, and extract meaning from logs at scale separates teams that can debug production incidents in minutes from those that spend hours in the dark.
Modern log analysis tools go far beyond grepping a file. They provide full-text search across billions of events, pattern extraction and clustering, anomaly detection, pipeline transformations to enrich or redact data in flight, and correlation with traces and metrics to give complete incident context.
In this guide, we compare the best log analysis tools in 2026, covering their strengths, trade-offs, and ideal use cases for DevOps, SRE, and platform engineering teams.
For related reading, see our guides on Log Management Tools, Best Log Visualization Tools, and Structured Logging Best Practices.
TL;DR: Key Takeaways
OpenObserve is the strongest log analysis platform in 2026, with SQL-based querying, built-in pattern detection, VRL pipelines for PII redaction, native OpenTelemetry trace correlation, and columnar object storage that cuts log retention costs by up to 140x. Logs, metrics, and traces in a single platform, with no operational overhead.
Get started free →
What Is a Log Analysis Tool?
A log analysis tool collects log data from applications, infrastructure, and services, and provides capabilities to search, parse, aggregate, and derive insight from that data. Core capabilities include:
- Ingestion and parsing: Accepting logs from multiple sources and extracting structured fields from unstructured text
- Full-text search: Querying across all fields in large datasets with low latency
- Pattern detection: Automatically grouping log events by common templates to surface new error patterns
- Anomaly detection: Identifying unusual log volumes or patterns without predefined thresholds
- Pipeline transformations: Enriching, filtering, or redacting log data in flight before storage
- Correlation: Joining log events with traces and metrics from the same request or time window
- Alerting: Notifying teams when specific conditions appear in the log stream
The distinction from log monitoring is emphasis: monitoring watches known conditions in real time; analysis explores historical and streaming data to answer questions you didn't know to ask.
Why Log Analysis Matters
1. Root cause investigation: When incidents happen, logs contain the ground truth. Effective analysis tools let you narrow from millions of events to the specific sequence that caused a failure in minutes rather than hours.
2. Pattern detection before incidents: Automatic log clustering surfaces new error patterns as they emerge, often before a threshold alert fires or a user reports a problem.
3. Cost control: Uninstrumented systems generate enormous log volumes. Analysis tools with pipeline filtering and efficient compression let teams retain more data for longer at lower cost.
4. Compliance and audit: Regulated industries need to retain and search logs for extended periods. Log analysis tools with role-based access, PII redaction, and long-term storage directly support compliance requirements.
5. Security investigation: Log analysis is the foundation of threat hunting and forensic investigation. The ability to search across all log sources for an indicator of compromise, join across services by a shared identifier, and reconstruct a timeline is not possible without capable tooling.
What to Look for in a Log Analysis Tool
| Feature |
Why It Matters |
| Query Language |
SQL, KQL, Lucene, or proprietary; affects how quickly engineers can get answers and how steep the learning curve is for new team members |
| Ingestion Throughput |
Can it handle your peak log volume without dropping events or degrading query performance |
| Storage Efficiency |
Compression ratio and storage backend (object storage vs. disk) directly determines cost at scale |
| Search Latency |
Sub-second response on recent data; acceptable latency on cold historical queries |
| Pattern and Anomaly Detection |
Automatic clustering of log templates to surface new patterns without writing rules |
| Pipeline Transformations |
Ability to enrich, filter, mask, or route log data before or during ingestion |
| Trace and Metric Correlation |
Join logs to traces using trace_id for full incident context |
| Alerting |
Scheduled and real-time alert conditions with integration to Slack, PagerDuty, etc. |
| Access Control |
RBAC, field-level masking, and audit trails for regulated environments |
| Deployment Model |
SaaS, self-hosted, or hybrid; affects data residency, operational burden, and total cost |
| Pricing Model |
Per-GB ingested, per-user, per-host, or flat rate; shapes total cost at scale |
Best Log Analysis Tools in 2026: Detailed Comparison
Jump to the comparison table.
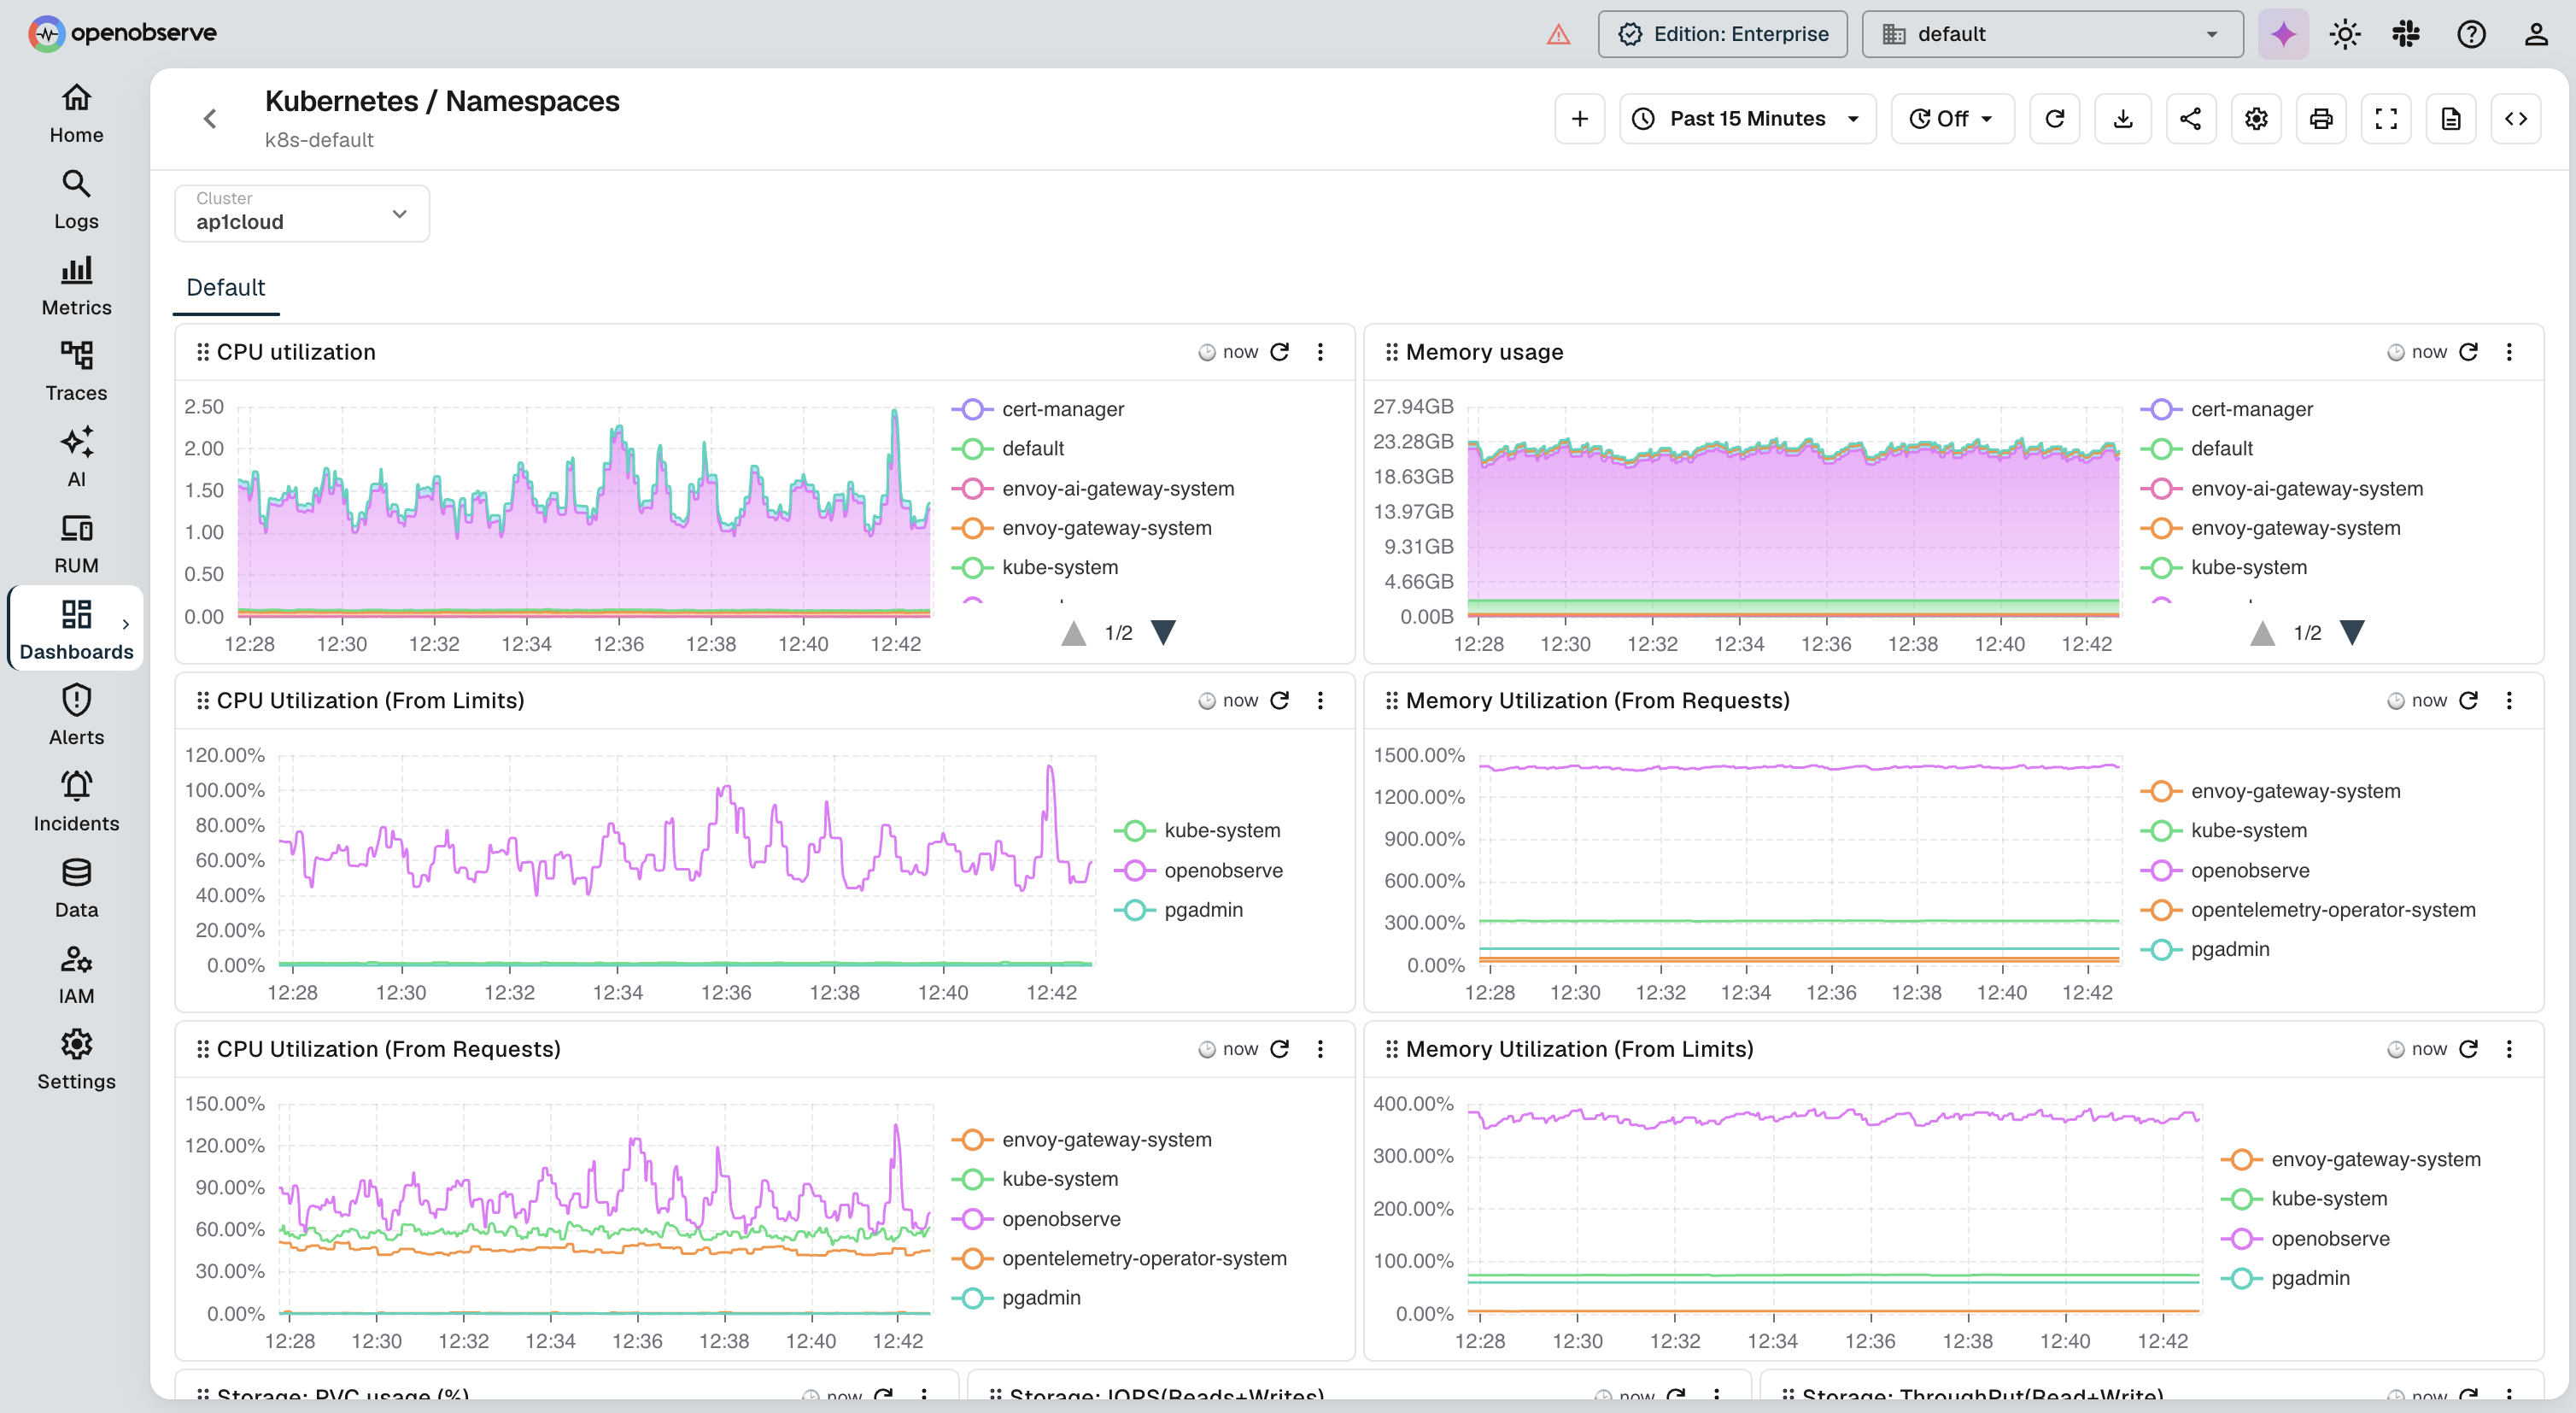
1. OpenObserve
OpenObserve is an open source unified observability platform with purpose-built log analysis capabilities: SQL-based querying, automatic log pattern extraction, VRL pipeline transformations, native OpenTelemetry support, and columnar object storage that makes long-term retention practical at scale.
OpenObserve Pros:
- SQL-Based Analysis: Query logs with familiar SQL, with no proprietary language to learn. Supports aggregations, joins, window functions, and subqueries across log, trace, and metric streams
- Automatic Log Patterns: Built-in pattern extraction clusters log lines by template, surfacing new error signatures without writing rules
- VRL Pipelines: Transform, enrich, mask, or filter log data in flight using Vector Remap Language, with 147+ built-in PII redaction patterns for compliance
- Exceptional Storage Efficiency: Columnar Parquet format on S3-compatible object storage delivers up to 140x compression vs. Elasticsearch, making full log retention feasible for most teams
- Trace Correlation: Pivot from a log line to its originating trace using shared
trace_id, which works automatically when logs and traces are both sent via OpenTelemetry
- Unified Platform: Logs, metrics, and traces in one place with a single query interface and unified dashboards
- Real-Time and Scheduled Alerts: SQL-based alert conditions with Slack, PagerDuty, email, and webhook delivery
- Self-Hosted or Managed: Deploy on your own infrastructure or use OpenObserve Cloud with no forced SaaS dependency
- Cost-Effective at Scale: Open source core with enterprise features; significantly lower total cost than Splunk, Datadog, or New Relic at equivalent volumes
OpenObserve Cons:
- Advanced SQL queries require SQL familiarity; teams used to Lucene or KQL have a short adaptation period
Integration / Mitigation:
- Ingest logs via OpenTelemetry Collector, Fluent Bit, Vector, Fluentd, or direct HTTP ingest
- Use VRL pipelines to parse unstructured log formats (nginx, syslog, JSON) at ingestion
- Use pre-built dashboards from the OpenObserve dashboard library
- Deploy using Docker, Kubernetes Helm chart, or binary (single binary, no external dependencies required)
- Use OpenObserve Cloud for managed deployment with no infrastructure overhead
2. Splunk
Splunk is the market-leading commercial log analysis platform, known for its powerful search processing language (SPL), massive ecosystem of integrations, and enterprise-grade security and compliance features. If cost is a concern, see our roundup of Splunk alternatives.
Splunk Pros:
- SPL: Splunk's Search Processing Language is extremely powerful for complex log analysis, statistical summaries, and multi-step pipelines
- Ecosystem: Thousands of pre-built apps, dashboards, and integrations covering virtually every log source
- Enterprise Features: Role-based access control, field-level encryption, audit logging, and compliance certifications
- Machine Learning Toolkit: Built-in ML for anomaly detection, predictive analytics, and log clustering
- SIEM Capabilities: Splunk Enterprise Security is the dominant SIEM platform for large enterprises
- Real-Time Streaming: High-throughput real-time ingestion with sub-second search on recent data
- Universal Forwarder: Lightweight agent for collecting logs from any host
Splunk Cons:
- Cost: Splunk's per-GB ingestion pricing is the most expensive in the category at scale, with many teams paying $50-150K+ annually
- Complexity: SPL has a steep learning curve; advanced searches require dedicated expertise
- Infrastructure Overhead: Self-hosted Splunk requires significant operational expertise to manage indexers, search heads, and forwarders
- Vendor Lock-In: SPL and Splunk's data format create strong dependency that is hard to migrate away from
- SaaS Pricing: Splunk Cloud pricing can be even higher than self-hosted at equivalent volumes
Integration / Mitigation:
- Use Splunk with data volume management to control ingestion costs; aggressive filtering at the forwarder level is essential
- Consider OpenObserve as a cost-effective alternative for non-SIEM log analysis workloads
- Leverage SmartStore (Splunk's object storage tier) for long-term retention cost reduction
- Evaluate whether all use cases require Splunk or whether non-security logs can move to a lower-cost platform
- If running both, use the OpenObserve to Splunk pipeline integration to forward only security-relevant events to Splunk
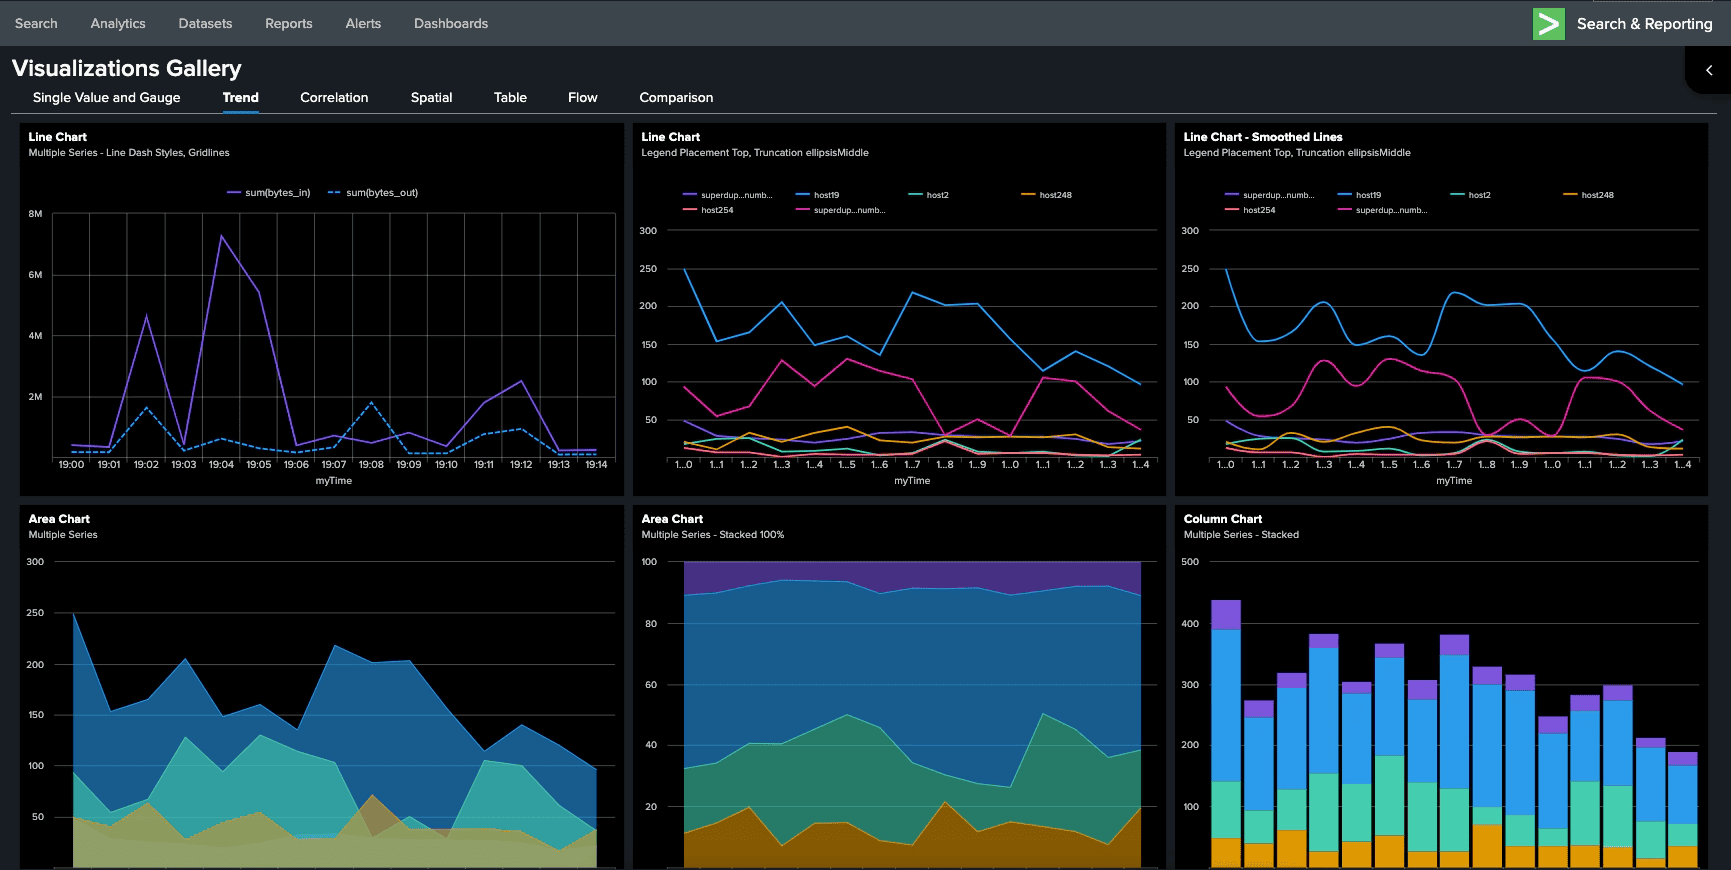
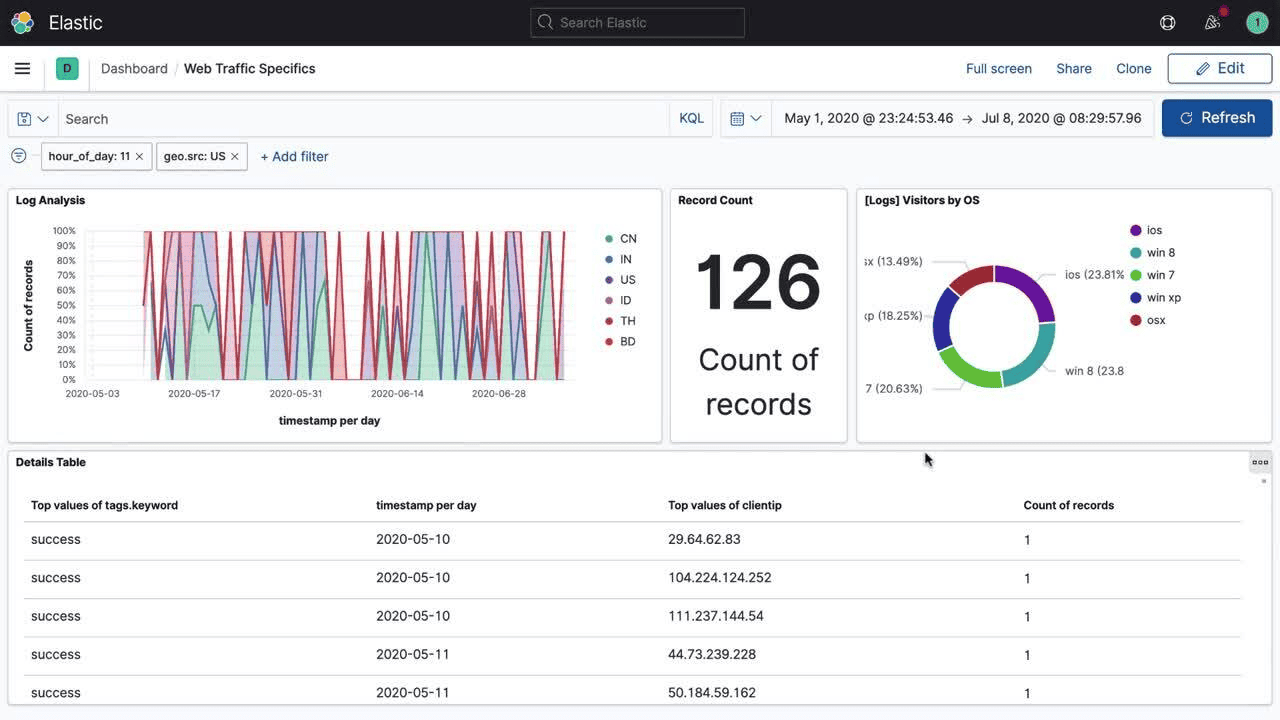
3. Elasticsearch / OpenSearch
Elasticsearch (and its open source fork OpenSearch) is the engine behind the ELK and EFK stacks, providing distributed full-text search and analytics on log data at petabyte scale. If you're evaluating moving off it, see how to replace Elasticsearch for log management, the broader Elasticsearch alternatives guide, or the OpenObserve vs Elasticsearch benchmarking and migration guide.
Elasticsearch / OpenSearch Pros:
- Powerful Full-Text Search: Inverted index architecture makes Elasticsearch extremely fast at free-text search across large datasets
- Flexible Schema: Dynamic field mapping accepts logs of any structure without upfront schema definition
- Kibana / OpenSearch Dashboards: Rich visualization and dashboard capabilities for log analysis and exploration
- Massive Ecosystem: Logstash, Fluent Bit, and hundreds of other collectors support Elasticsearch natively
- Open Source: OpenSearch is fully open source; Elasticsearch has both open and proprietary editions
- Horizontal Scalability: Designed to scale across many nodes for very high ingest rates
- APM Integration: Elastic APM provides trace-to-log correlation within the Elastic stack
Elasticsearch / OpenSearch Cons:
- Resource Intensive: Elasticsearch's JVM-based architecture requires significant memory and compute, and operational costs are high at scale
- Storage Costs: Raw JSON indexing results in large storage footprints; ILM management is required to control costs
- Operational Complexity: Managing shard allocation, index lifecycle, and cluster health is a significant ongoing operational burden
- Scaling Challenges: Performance degrades predictably with cluster size if not carefully managed
- Cost: Elastic Cloud pricing for managed Elasticsearch can rival Splunk at high volumes
Integration / Mitigation:
- Use Elastic's index lifecycle management (ILM) or OpenSearch's Index State Management (ISM) to move old logs to lower-cost tiers
- Deploy Fluent Bit as a lightweight log shipper rather than Logstash to reduce resource overhead
- Consider OpenObserve for long-term retention where Elasticsearch's storage costs are prohibitive
- Use dedicated cold or frozen tiers for historical data that is searched infrequently
4. Datadog Log Management
Datadog provides log analysis as part of its full-stack observability platform, with tight integration between logs, metrics, and APM traces that makes incident investigation fast when all your telemetry is in one place. For a detailed head-to-head on log capabilities and cost, see the Datadog vs OpenObserve log management comparison. If you're evaluating alternatives, see the top Datadog alternative tools guide or learn why OpenObserve is the leading open source Datadog alternative.
Datadog Pros:
- Unified Observability: Logs, metrics, APM traces, and RUM in one platform; pivot from a spike in error rate to the specific log lines without switching tools
- Log Explorer: Fast, intuitive log search with pattern clustering, saved views, and shareable links
- Live Tail: Real-time log streaming for debugging active incidents
- Automatic Pattern Detection: Groups log events by template to surface new patterns
- Log Pipelines: No-code pipeline UI for parsing, enriching, and routing logs
- Anomaly Detection: ML-based volume anomaly detection on log streams
- Security Monitoring: Cloud SIEM built on top of the log platform
Datadog Cons:
- Cost: Datadog's per-GB ingestion and retention pricing can become very expensive at scale, with bills commonly exceeding $100K/year for mid-size engineering teams
- Retention Limits: Default log retention is 15 days; longer retention requires additional cost
- Vendor Lock-In: Proprietary platform with limited data portability
- SaaS Only: No self-hosted deployment option for regulated environments that require on-premises
- Indexing Cost: Datadog charges separately for indexed (searchable) logs vs. archived (non-searchable) logs
Integration / Mitigation:
- Use Datadog's Flex Logs or archive feature to reduce costs on high-volume, low-query-frequency log streams
- Apply sampling and filtering at the agent level to reduce ingested volume
- Consider OpenObserve for cost-sensitive log retention alongside Datadog for real-time monitoring
- Set up log exclusion filters for verbose sources that add volume without debugging value
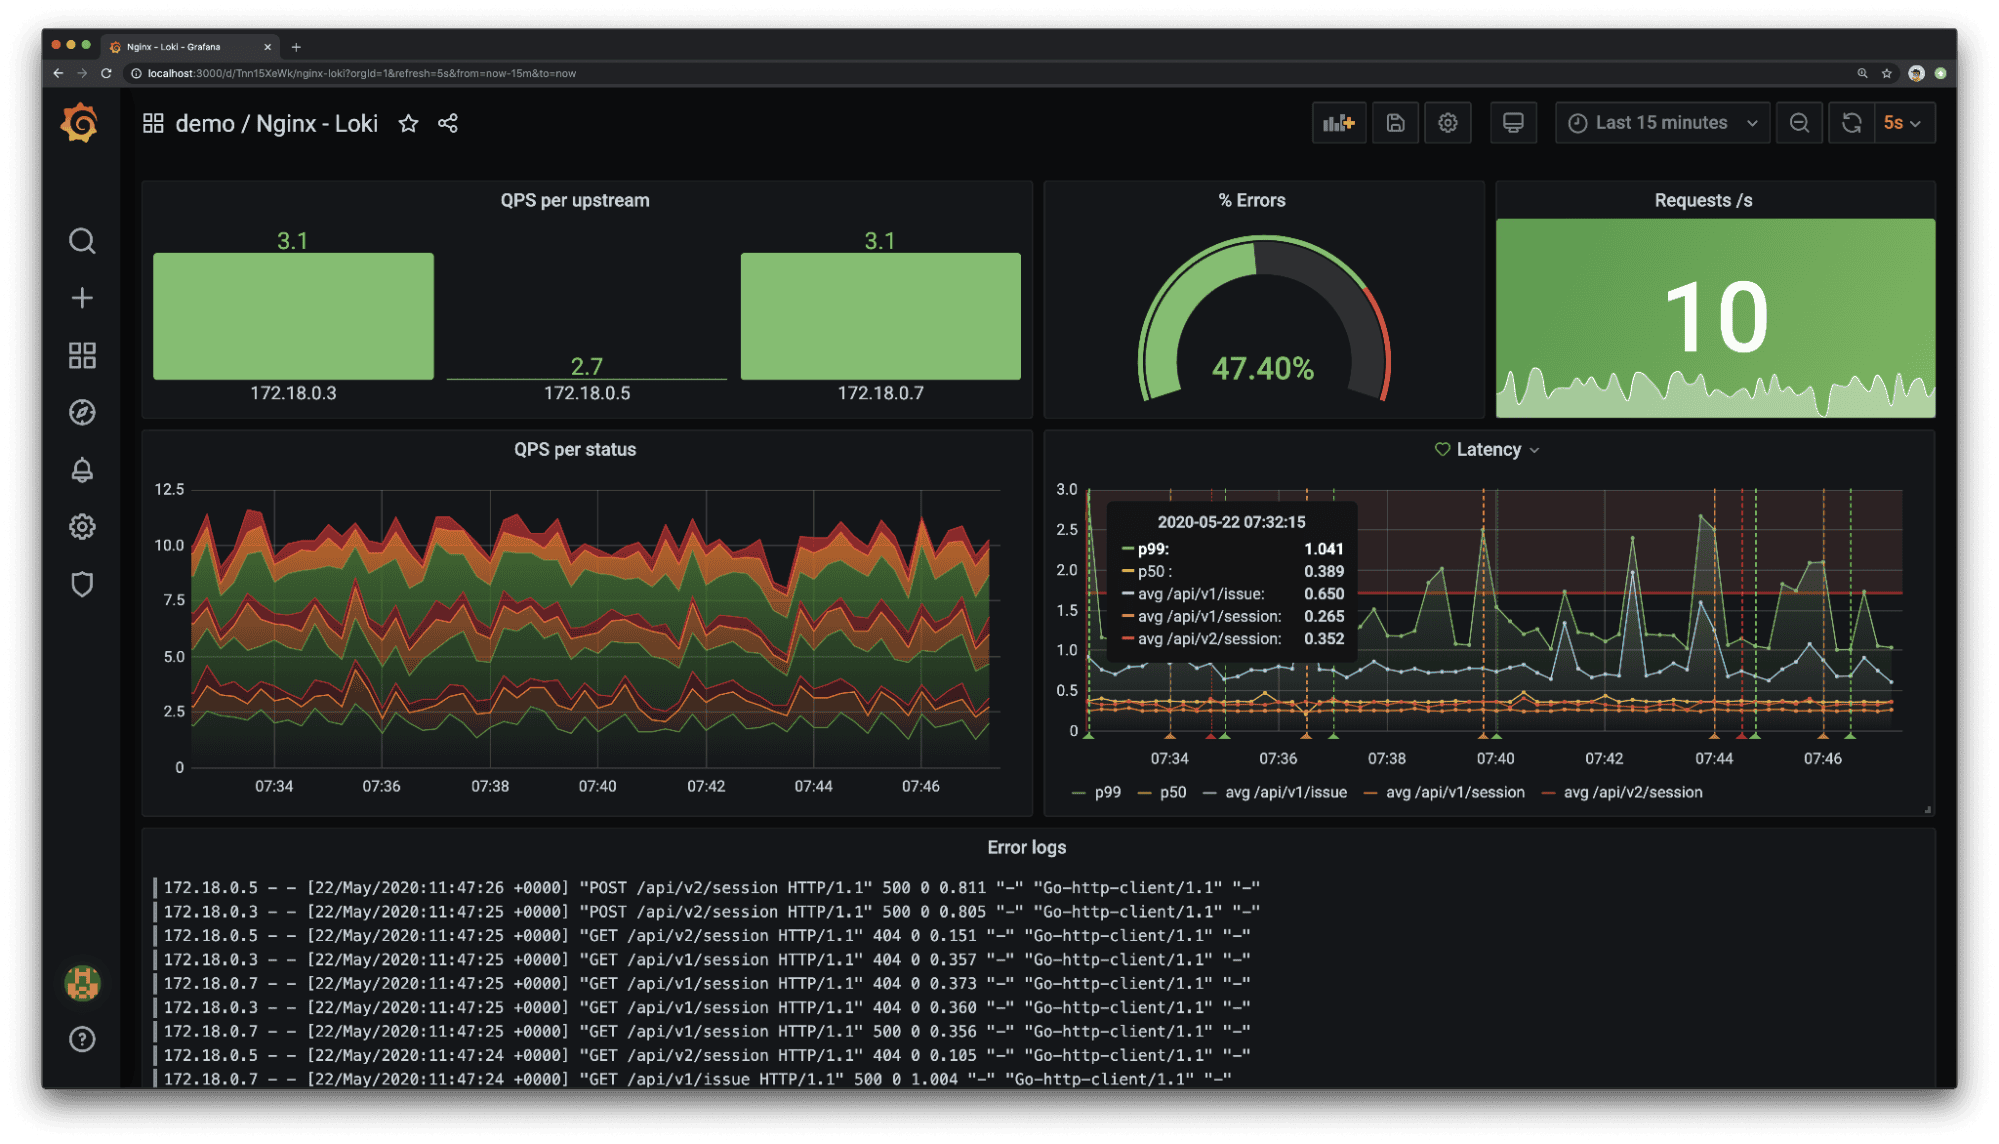
5. Grafana Loki
Grafana Loki is a horizontally scalable, cloud-native log aggregation system inspired by Prometheus. Unlike Elasticsearch, Loki indexes only labels rather than log content, making it extremely cost-efficient for Kubernetes environments already running Grafana. If you are evaluating alternatives, see our Grafana alternatives guide and the OpenObserve vs Grafana comparison. For a practical setup guide, see how to send Kubernetes logs to OpenObserve using Fluent Bit.
Grafana Loki Pros:
- Highly Cost-Efficient: Indexes only labels, not content, dramatically lowering storage and compute costs compared to full-text indexed solutions
- Kubernetes-Native: Pairs naturally with Prometheus and Grafana for a unified metrics-and-logs stack in Kubernetes environments
- LogQL: Label-based query language that Prometheus users find intuitive
- Horizontal Scalability: Microservices mode scales ingestion and query components independently
- Object Storage Backend: Uses S3, GCS, or Azure Blob for long-term log storage
- Grafana Integration: First-class support in Grafana dashboards and alerting
- Open Source: Licensed under AGPLv3; Grafana Cloud offers a managed tier
Grafana Loki Cons:
- No Full-Text Index: Searching log content requires scanning matching chunks, resulting in slow queries on large datasets when labels don't narrow the result set significantly
- LogQL Learning Curve: Different from SQL and Lucene; teams without Prometheus experience find it less intuitive
- Limited Analytics: Loki is optimized for log retrieval, not complex aggregations or analytical queries across log content
- Operational Complexity: Self-hosted distributed mode requires managing multiple components (distributor, ingester, querier, compactor)
- Pattern Detection: Less sophisticated log clustering compared to Splunk, Datadog, or OpenObserve
Integration / Mitigation:
- Use Promtail, Alloy, or Fluent Bit to collect and ship logs to Loki
- Pair with Grafana for visualization and alerting; the Explore interface is excellent for log investigation
- Add meaningful labels at the source to keep query performance acceptable
- Consider OpenObserve when you need full-text search or SQL-based analytics beyond what LogQL provides
6. Sumo Logic
Sumo Logic is a cloud-native SaaS log analysis platform with strong enterprise security features, built-in machine learning for anomaly detection, and a purpose-built SIEM offering.
Sumo Logic Pros:
- Cloud-Native SaaS: Fully managed, no infrastructure to operate
- Machine Learning: Outlier detection, log reduce (clustering), and predictive analytics built in
- Security Use Cases: Sumo Logic Cloud SIEM is a competitive enterprise security platform
- Flex Pricing: Credits-based pricing model provides some flexibility compared to pure per-GB models
- Multi-Cloud Support: Ingests from AWS, GCP, Azure, and on-premises environments
- LiveTail: Real-time log streaming for active troubleshooting
- Integrations: Pre-built collectors and dashboards for hundreds of sources
Sumo Logic Cons:
- Cost at Scale: Credits-based pricing can be unpredictable and expensive as log volume grows
- Query Performance: Complex queries on large datasets can be slow compared to alternatives
- Proprietary Query Language: Sumo Logic Query Language (SQL-like but distinct) requires learning
- SaaS Only: No self-hosted option
- UI Complexity: The interface can feel dated compared to newer entrants
Integration / Mitigation:
- Use Sumo Logic Collectors with filtering rules to control ingested volume
- Leverage the built-in ML features for anomaly detection to offset manual monitoring
- Consider OpenObserve for non-security log analysis workloads to reduce costs
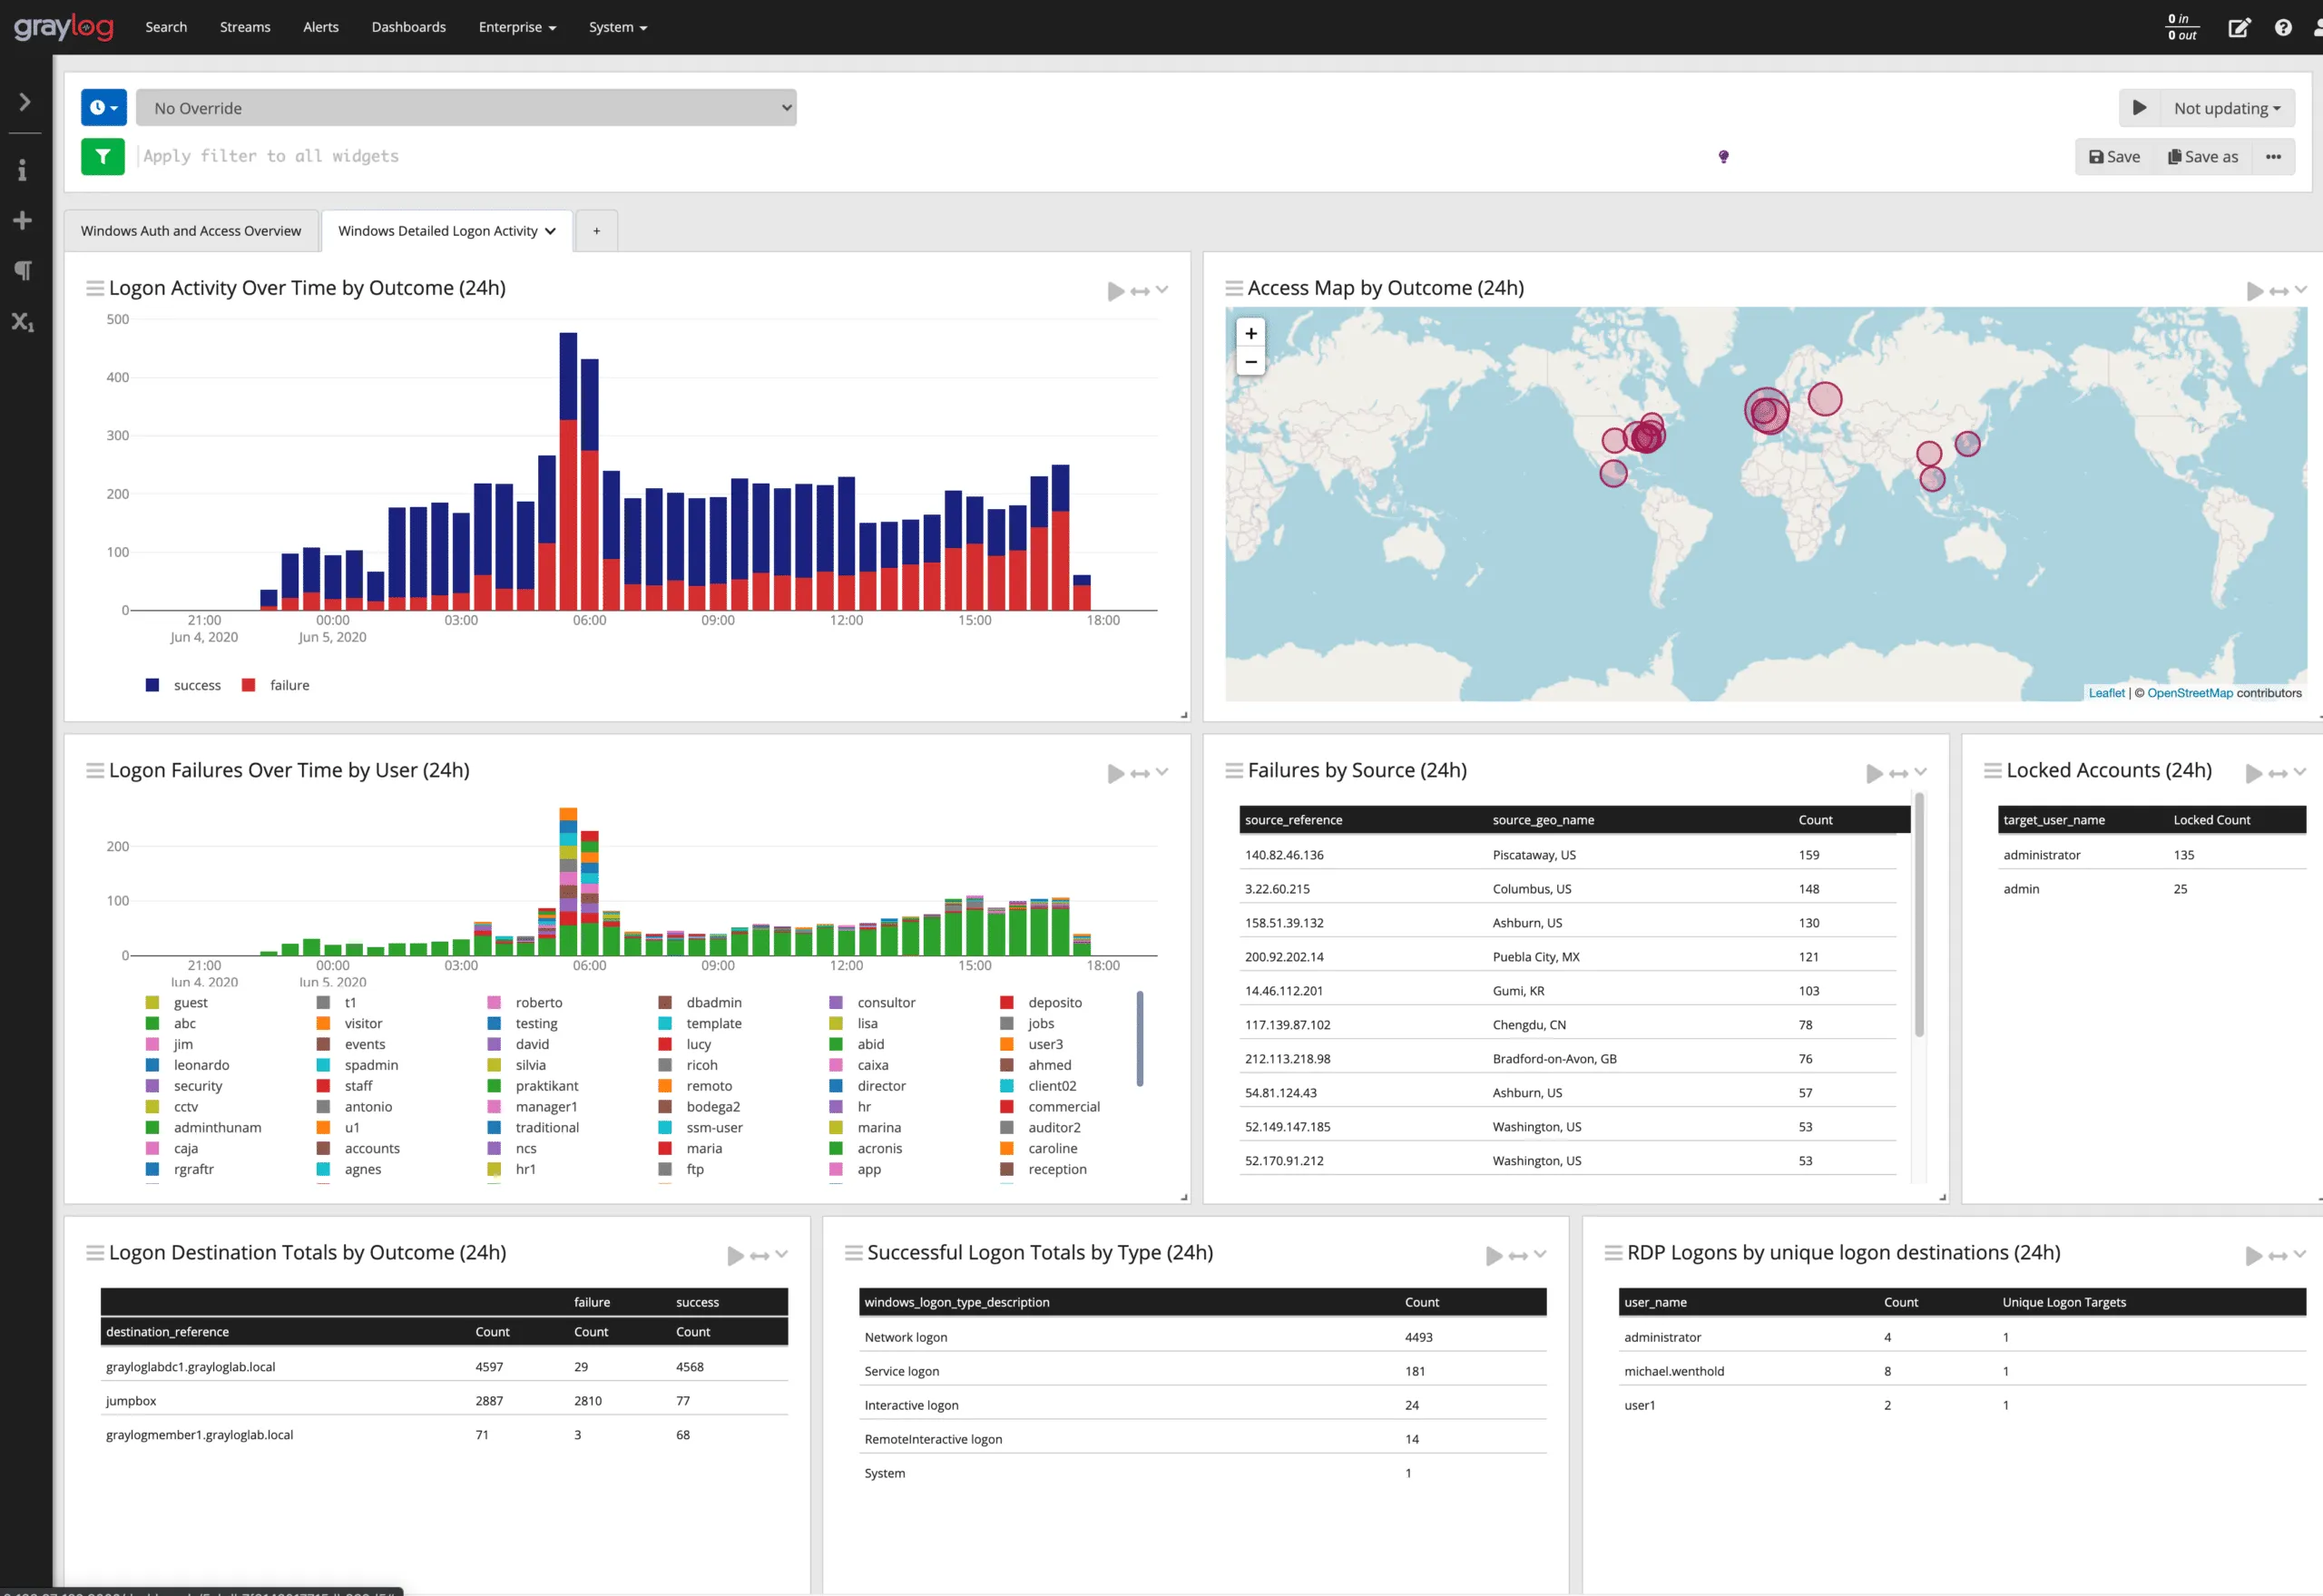
7. Graylog
Graylog is an open source log management and analysis platform built on Elasticsearch, designed specifically for security operations and IT teams that need powerful search with a lower barrier to entry than the full ELK stack.
Graylog Pros:
- Purpose-Built for Logs: UI and workflow designed specifically for log investigation rather than general analytics
- GELF Protocol: Graylog Extended Log Format supports structured logging with full field preservation
- Streams and Pipelines: Built-in routing, transformation, and enrichment without external tools
- Alerting: Flexible alert conditions on log content with notification integrations
- Security-Focused: Graylog Security is a dedicated SIEM offering
- Open Source Core: Community edition is free and self-hostable
- Schema-Flexible: Accepts logs with varying fields without upfront schema changes
Graylog Cons:
- Elasticsearch Dependency: Graylog requires Elasticsearch or OpenSearch as the storage backend, inheriting their operational complexity and resource requirements
- Scaling Limitations: Graylog's architecture does not scale as cleanly as purpose-built distributed systems at very high ingest rates
- Limited Analytics: Less powerful for complex statistical analysis compared to Splunk or OpenObserve
- UI Dated: Interface is functional but less polished than commercial alternatives
Integration / Mitigation:
- Use Graylog for structured log analysis and security use cases where the ELK operational overhead is acceptable
- Deploy with OpenSearch instead of Elasticsearch to avoid licensing concerns
- Consider OpenObserve for teams that want SQL-based analysis without Elasticsearch infrastructure
8. New Relic
New Relic provides log analysis as part of its full-stack observability platform, with strong correlation between logs and APM traces and a generous free tier that makes it accessible for smaller teams. If you're evaluating alternatives, see the top New Relic alternatives guide.
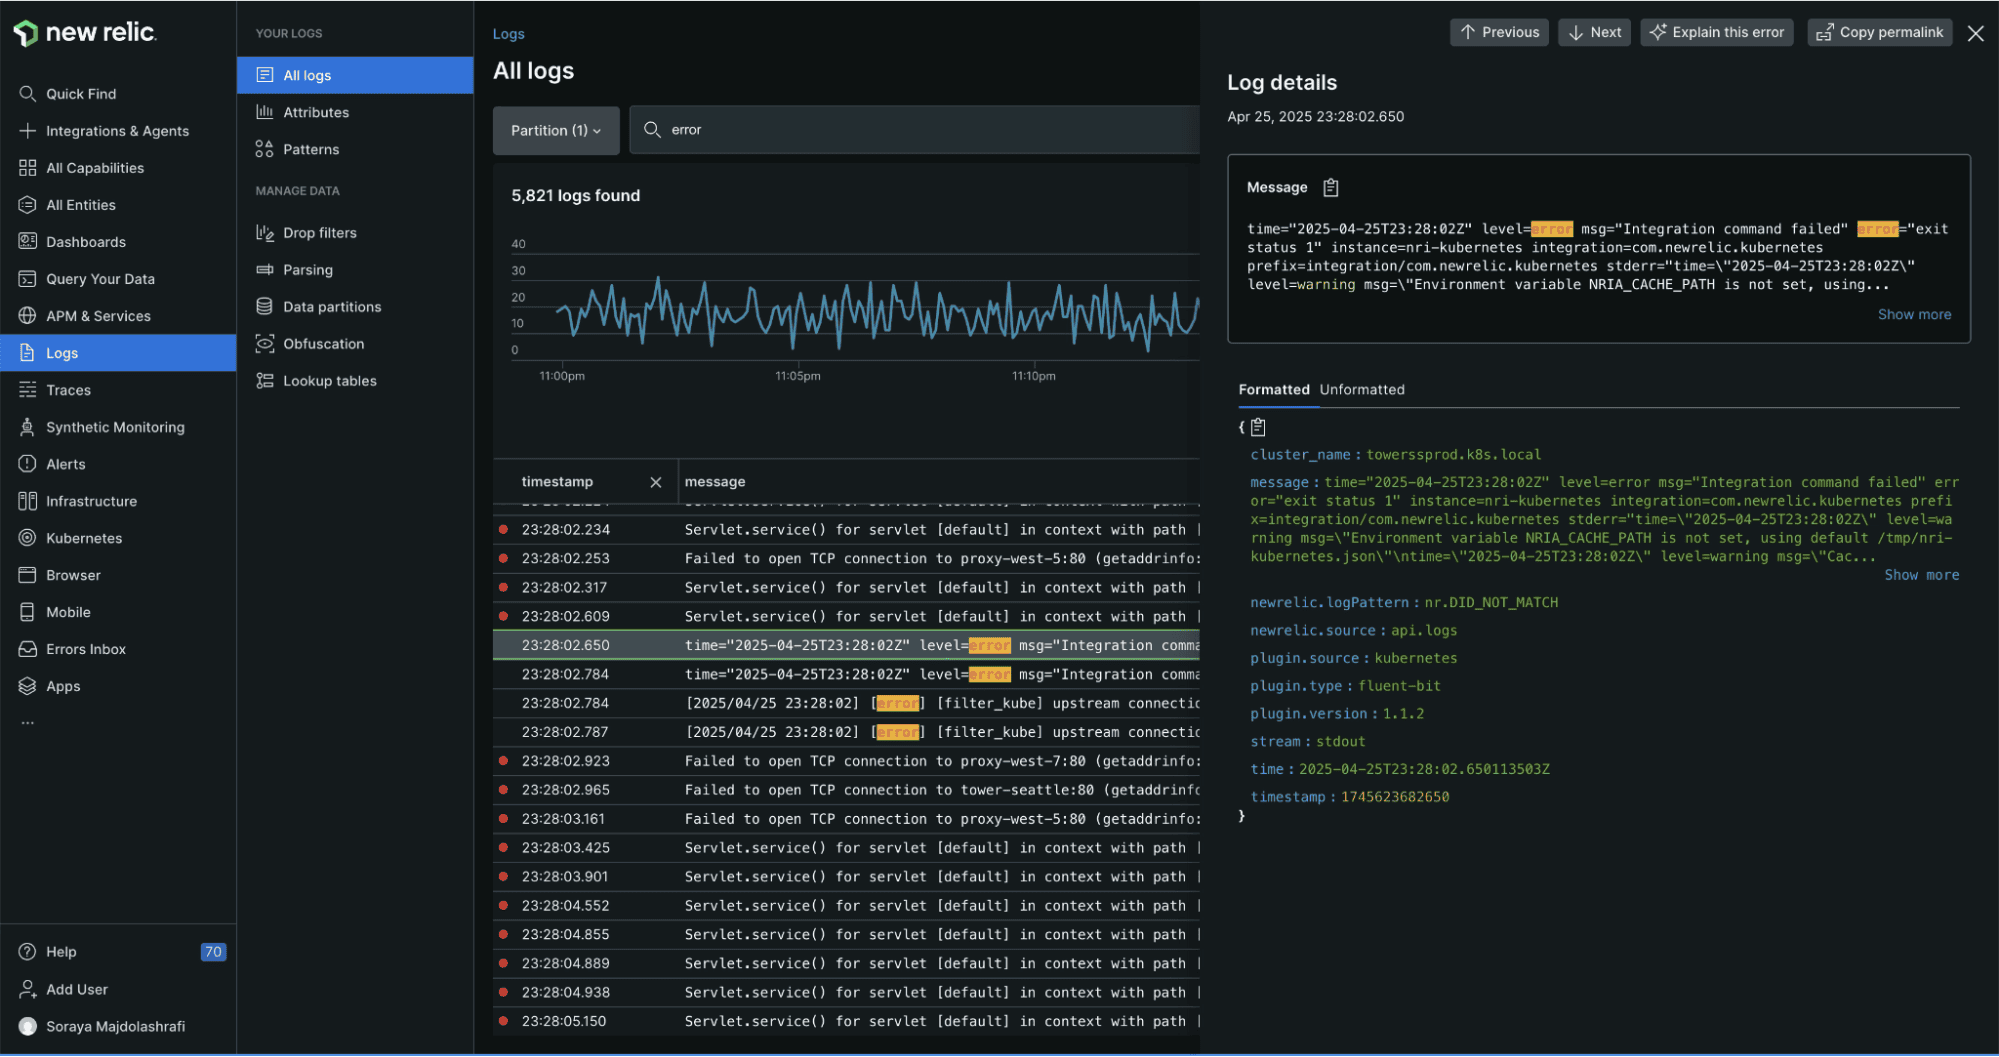
New Relic Pros:
- Log-in-Context: Automatic correlation of logs to APM traces and distributed tracing; click from a slow trace to the logs produced by that request
- Generous Free Tier: 100GB/month free data ingest covers many small and medium teams
- NRQL: New Relic Query Language is powerful for analytics across logs, metrics, and traces
- Automatic Parsing: Detects and parses common log formats without configuration
- Pattern Detection: Groups log events by template to surface new patterns
- Unified Platform: Logs, metrics, browser monitoring, mobile, and synthetic monitoring in one place
- Alerting: Flexible alert policies with multiple notification channels
New Relic Cons:
- Cost Beyond Free Tier: After the 100GB free tier, pricing scales with data volume and can become expensive
- NRQL Learning Curve: Teams unfamiliar with New Relic's query syntax need time to become productive
- Retention Limits: Default log retention is 30 days; longer retention requires additional cost
- SaaS Only: No on-premises deployment option
Integration / Mitigation:
- Use the Infrastructure Agent, Fluent Bit integration, or OpenTelemetry to ship logs
- Leverage the free tier for development and staging environments
- Apply log filtering and sampling at the agent level to stay within budget on high-volume sources
- Consider OpenObserve for self-hosted or cost-sensitive production deployments
9. AWS CloudWatch Logs Insights
AWS CloudWatch Logs Insights is the native log analysis service for AWS workloads, providing a query interface on top of CloudWatch Logs with deep integration into the AWS ecosystem. For Lambda-specific log analysis workflows, see how to monitor AWS Lambda logs using CloudWatch and Kinesis Firehose.

CloudWatch Logs Insights Pros:
- AWS-Native: No setup required for AWS workloads; Lambda, ECS, EKS, EC2, and most AWS services emit logs to CloudWatch automatically
- No Infrastructure: Fully managed and serverless with no logging infrastructure to operate
- Insights Query Language: SQL-like syntax that is approachable for engineers familiar with AWS
- Log Groups: Organized log storage per service or application
- IAM Integration: Native AWS IAM for access control without additional setup
- Metric Filters: Convert log patterns to CloudWatch metrics for alerting
- Container Insights: Enhanced monitoring for EKS and ECS workloads
CloudWatch Logs Insights Cons:
- Cost at Volume: CloudWatch charges per GB ingested, stored, and queried, and costs escalate quickly at high log volumes
- Query Performance: Insights queries on large log groups can be slow
- Limited Analytics: No automatic pattern detection or anomaly detection on log content
- AWS Lock-In: Not suitable for multi-cloud or on-premises log analysis
- Retention Management: Default retention is indefinite (and costly); managing retention per log group requires operational attention
- No Correlation: Limited native integration with distributed tracing or APM
Integration / Mitigation:
- Set explicit retention periods on all log groups to avoid indefinite storage costs
- Use subscription filters to forward high-value logs to OpenObserve or another analysis platform for advanced querying
- Use CloudWatch Logs Insights for simple, operational queries on recent AWS logs
- Route all logs through OpenTelemetry Collector to centralize across multi-cloud and on-premises sources
10. Papertrail
Papertrail (part of SolarWinds) is a cloud-hosted log management service designed for simplicity, with a focus on real-time tail, fast search, and easy setup; a strong fit for small teams and straightforward use cases.
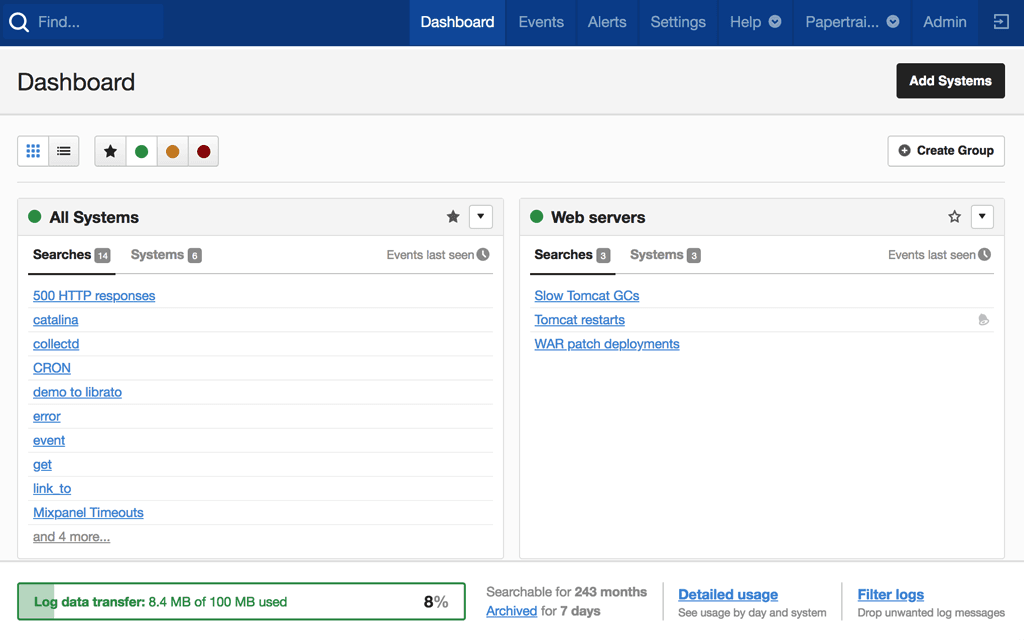
Papertrail Pros:
- Simplicity: Minimal setup; just point syslog or a log shipper at Papertrail and you're done
- Live Tail: Real-time log streaming with a clean, fast interface
- Fast Search: Full-text search on recent logs with quick results
- Team Features: Saved searches, shared views, and team access management
- Affordable Entry: Low starting price makes it accessible for small teams and side projects
- Alerts: Email and webhook alerts on log patterns
Papertrail Cons:
- Limited Scale: Not designed for very high log volumes or complex analytical queries
- Short Retention: Default retention periods are short; longer retention requires higher plans
- No Analytics: No aggregation, pattern detection, or anomaly detection beyond basic search
- SaaS Only: No self-hosted option
- Limited Integration: Fewer integrations with modern observability stacks compared to alternatives
Integration / Mitigation:
- Best suited for small teams, hobby projects, or isolated services
- Use Papertrail for simple operational log tailing alongside a more capable platform for production analysis
- Migrate to OpenObserve or Loki as log volume and analysis complexity grows
Log Analysis Tools Comparison Table
| Tool |
Deployment |
Query Language |
Pattern Detection |
Trace Correlation |
Storage Efficiency |
Cost Profile |
| OpenObserve |
Self-hosted / Managed |
SQL |
Yes (Built-in) |
Yes (Native OTel) |
Very High (Parquet + object storage) |
Low |
| Splunk |
Self-hosted / SaaS |
SPL |
Yes (ML Toolkit) |
Yes (Splunk APM) |
Medium |
Very High |
| Elasticsearch / OpenSearch |
Self-hosted / Cloud |
Lucene / DSL |
Limited |
Yes (Elastic APM) |
Low (raw JSON indexing) |
Medium–High |
| Datadog |
SaaS only |
Proprietary |
Yes (Built-in) |
Yes (APM integration) |
Medium |
High |
| Grafana Loki |
Self-hosted / Managed |
LogQL |
Limited |
Partial (via Tempo) |
High (label-only index) |
Low |
| Sumo Logic |
SaaS only |
SQL-like |
Yes (ML-powered) |
Limited |
Medium |
Medium–High |
| Graylog |
Self-hosted / Cloud |
Lucene / GELF |
Basic |
No native |
Low (Elasticsearch backend) |
Low–Medium |
| New Relic |
SaaS only |
NRQL |
Yes (Built-in) |
Yes (APM integration) |
Medium |
Low–High (volume-dependent) |
| CloudWatch Logs Insights |
SaaS (AWS) |
Insights QL |
No |
No native |
Low |
Medium (pay per query) |
| Papertrail |
SaaS only |
Full-text search |
No |
No |
Low |
Low (limited scale) |
Best Practices for Log Analysis
Structure your logs at the source: JSON-formatted logs with consistent field names dramatically reduce the parsing work required at ingestion and make queries faster and more reliable. See Structured Logging Best Practices for a detailed guide.
Include trace context in every log line: Emit trace_id and span_id in every log line using OpenTelemetry's log bridge or a structured logger. This makes log-to-trace correlation automatic rather than a manual join. See why logs-traces-metrics correlation matters for a deeper look at what this unlocks.
Filter at the source, not after ingestion: Apply sampling and filtering in your log shipper or OTel Collector before logs reach the backend. Dropping high-volume, low-value logs at the edge reduces costs without affecting analysis quality.
Never sample errors: Apply sampling only to INFO and DEBUG-level logs. Always retain 100% of WARN, ERROR, and CRITICAL events, as these are exactly what you need when debugging.
Set retention policies explicitly: Every log backend will accumulate data indefinitely if you don't configure retention. Match retention to your compliance requirements; most teams need 30-90 days hot and 1-2 years cold.
Use pipeline transformations for PII: Apply redaction or hashing to sensitive fields (emails, phone numbers, SSNs) at ingestion time, before data reaches storage. See our guide on redacting PII from LLM telemetry for implementation patterns applicable to any log pipeline.
Alert on log volume anomalies, not just content: A sudden 10x increase in log volume from a service is itself a signal worth alerting on, even if none of the individual log lines cross a threshold.
Correlate logs, metrics, and traces in a single platform: The most effective incident investigation starts with a metrics anomaly, pivots to the traces that were slow during that window, and lands on the specific log lines that explain why. This workflow requires a platform that unifies all three, or a disciplined approach to linking between separate tools.
Conclusion
The best log analysis tool for your team depends on your log volume, deployment constraints, budget, and how much analytical capability you need beyond basic search.
For most engineering teams in 2026, OpenObserve is the strongest all-around choice: SQL-based querying that any engineer can use without training, built-in pattern detection, VRL-based pipeline transformations for data shaping and PII redaction, native OpenTelemetry support for trace correlation, and columnar object storage that keeps full log retention affordable at scale. It works self-hosted or as a managed service, and the open source core means no vendor lock-in.
Key recommendations by use case:
- Full log retention at scale without high costs: OpenObserve with its object storage backend and columnar compression is the most cost-efficient option
- Already all-in on AWS: CloudWatch Logs Insights for simple queries; export to OpenObserve for complex analysis
- Kubernetes-native, metrics-first team: Grafana Loki for log collection alongside Prometheus, OpenObserve when you need SQL analytics
- Enterprise SIEM requirement: Splunk Enterprise Security or Sumo Logic Cloud SIEM; route non-security logs to OpenObserve to control costs
- Small team, simple needs: Papertrail to start; migrate to OpenObserve as volume and complexity grow
Take the Next Step