Microservices Monitoring: The Complete Guide to Why OpenObserve Is the Best Tool in 2026

Simran Kumari
June 09, 2026
20 min read
Don’t forget to share!
What Nobody Tells You About Running AI in Production
Try OpenObserve Cloud today for more efficient and performant observability.
Microservices monitoring is harder than most teams expect before they actually need it. When you are running a monolith, a slow page load points you to one application, one log file, one profiler output. When the same application is split across 30 or 50 services, a single slow user request might pass through an API gateway, an auth service, a product catalog service, an inventory service, and a payment processor before it returns. If any one of those hops is broken or slow, you need monitoring infrastructure that can tell you exactly where in that chain the problem lives.
This guide covers:
Microservices monitoring is the continuous collection and analysis of telemetry from every service in a distributed application, including the network calls between services and the infrastructure those services run on. The goal is to know at any moment whether each service is healthy, whether it is meeting its performance expectations, and when it is not, to have enough context to find out why quickly.
That definition sounds straightforward but the operational reality is not. Traditional monitoring tools were designed around a fundamentally different model: a small number of servers, each running one application, with predictable traffic patterns and a single log stream to search. Microservices architectures break every one of those assumptions:
The data volume alone is an order of magnitude larger than what a traditional monitoring stack was sized for. And the failure modes are qualitatively different. Microservices monitoring is not just monitoring at larger scale; the tools need to be different too.
Three specific problems come up repeatedly when teams move from monolith monitoring to microservices monitoring. Understanding them explains most of the tool decisions later in this guide.
Cascading failures. In a monolith, a bad deployment causes errors in one place. In a microservices architecture, a single slow downstream service can cause timeouts in the services that call it, which triggers retry storms in those services, which exhausts connection pools in a fourth service, which starts returning 503s to the API gateway, which the user sees as a broken checkout button. Walking that chain backward to the original cause is not possible without monitoring that can trace the request across every service it touched.
Cardinality cost. In a single service you have one set of metric labels. In a microservices architecture with 50 services, each running in multiple versions across multiple regions, each making calls to multiple downstream dependencies, the number of unique metric time series grows fast. Some commercial monitoring tools charge per unique time series. In a microservices environment those charges compound quickly and teams end up making labeling decisions based on cost rather than what would actually be useful for debugging.
Log correlation. In a monolith, searching logs means searching one stream. In microservices, a single user request produces log lines scattered across 10 to 20 different services. Without a shared request identifier threading through every log line and a platform that can query across all of them simultaneously, log-based debugging in a microservices architecture is not really debugging; it is guessing.
All three of these problems have solutions. They just require a monitoring approach built specifically for distributed systems.
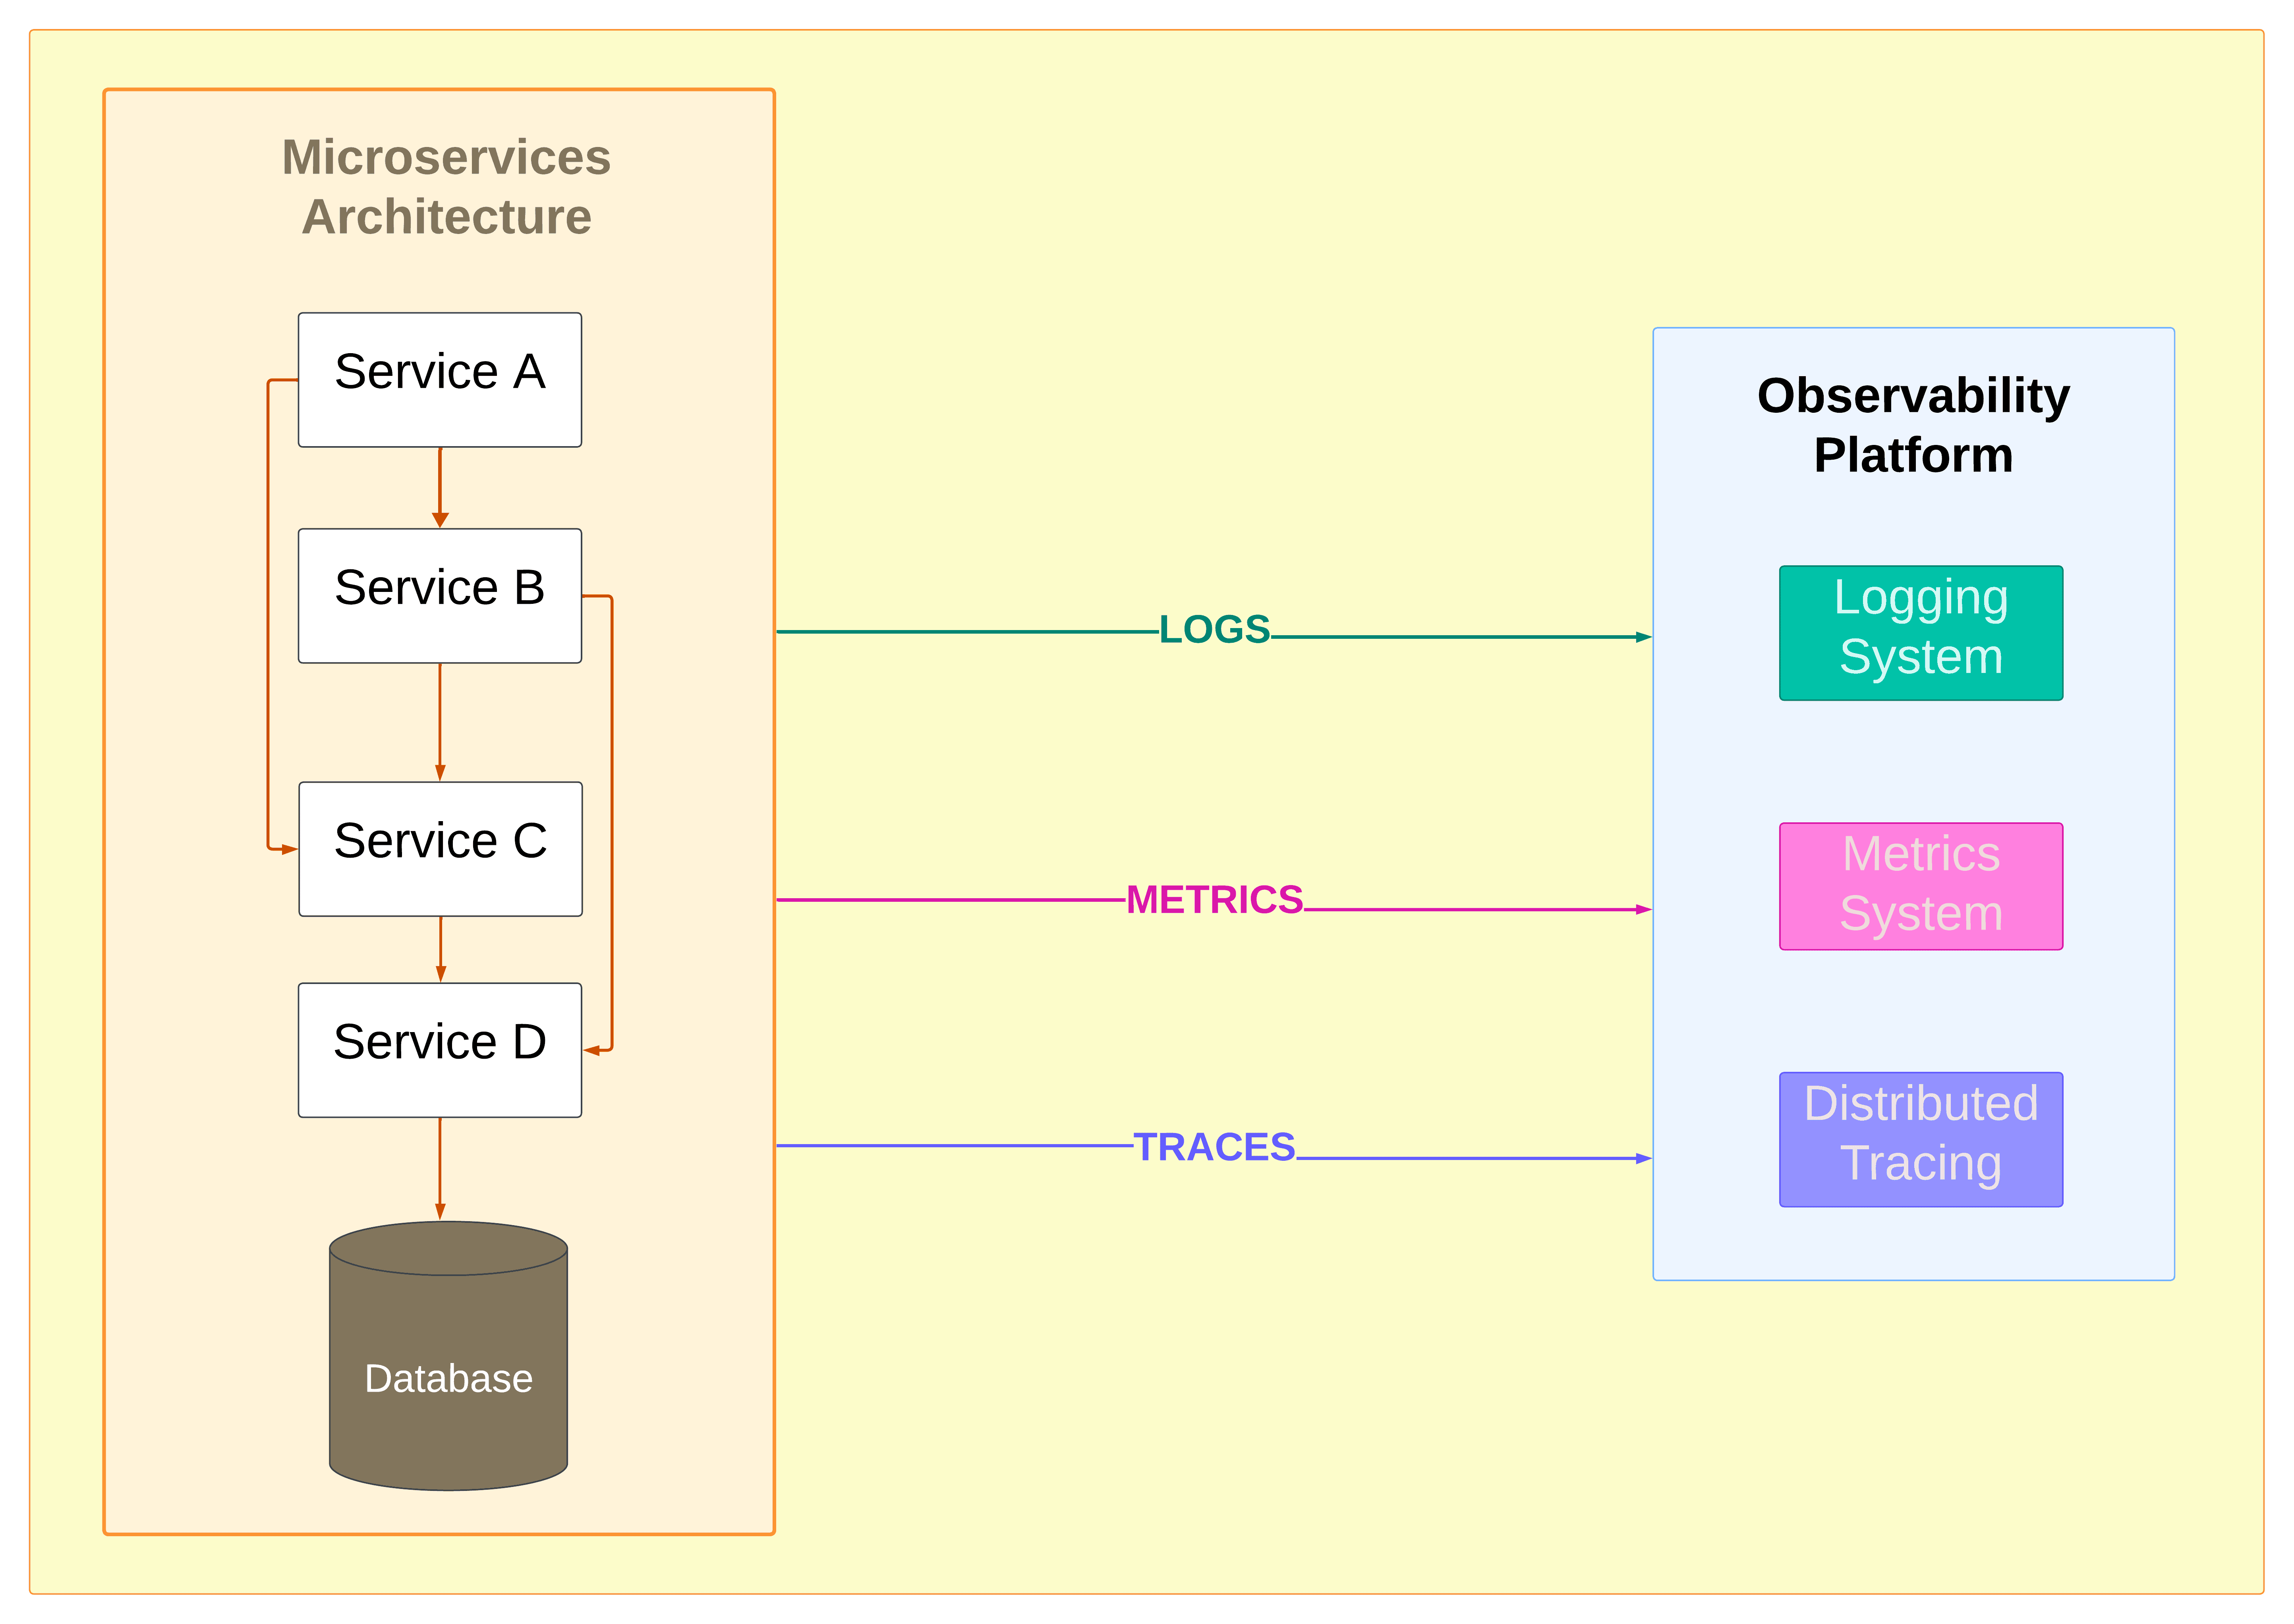
Microservices monitoring is built on three types of telemetry. Each answers a different question about your system. Using only one or two of them leaves gaps that matter during an actual incident.
Metrics are numerical measurements taken at regular intervals: request counts, error rates, latency percentiles, CPU usage, memory consumption, connection pool saturation. They are cheap to collect, cheap to store relative to logs, and fast to query. In microservices monitoring, metrics are the first signal that something is wrong. A p99 latency spike or an error rate crossing a threshold tells you that an SLO is at risk. What metrics cannot tell you is why.
The standard framework is the RED method, applied consistently to every service in your architecture:
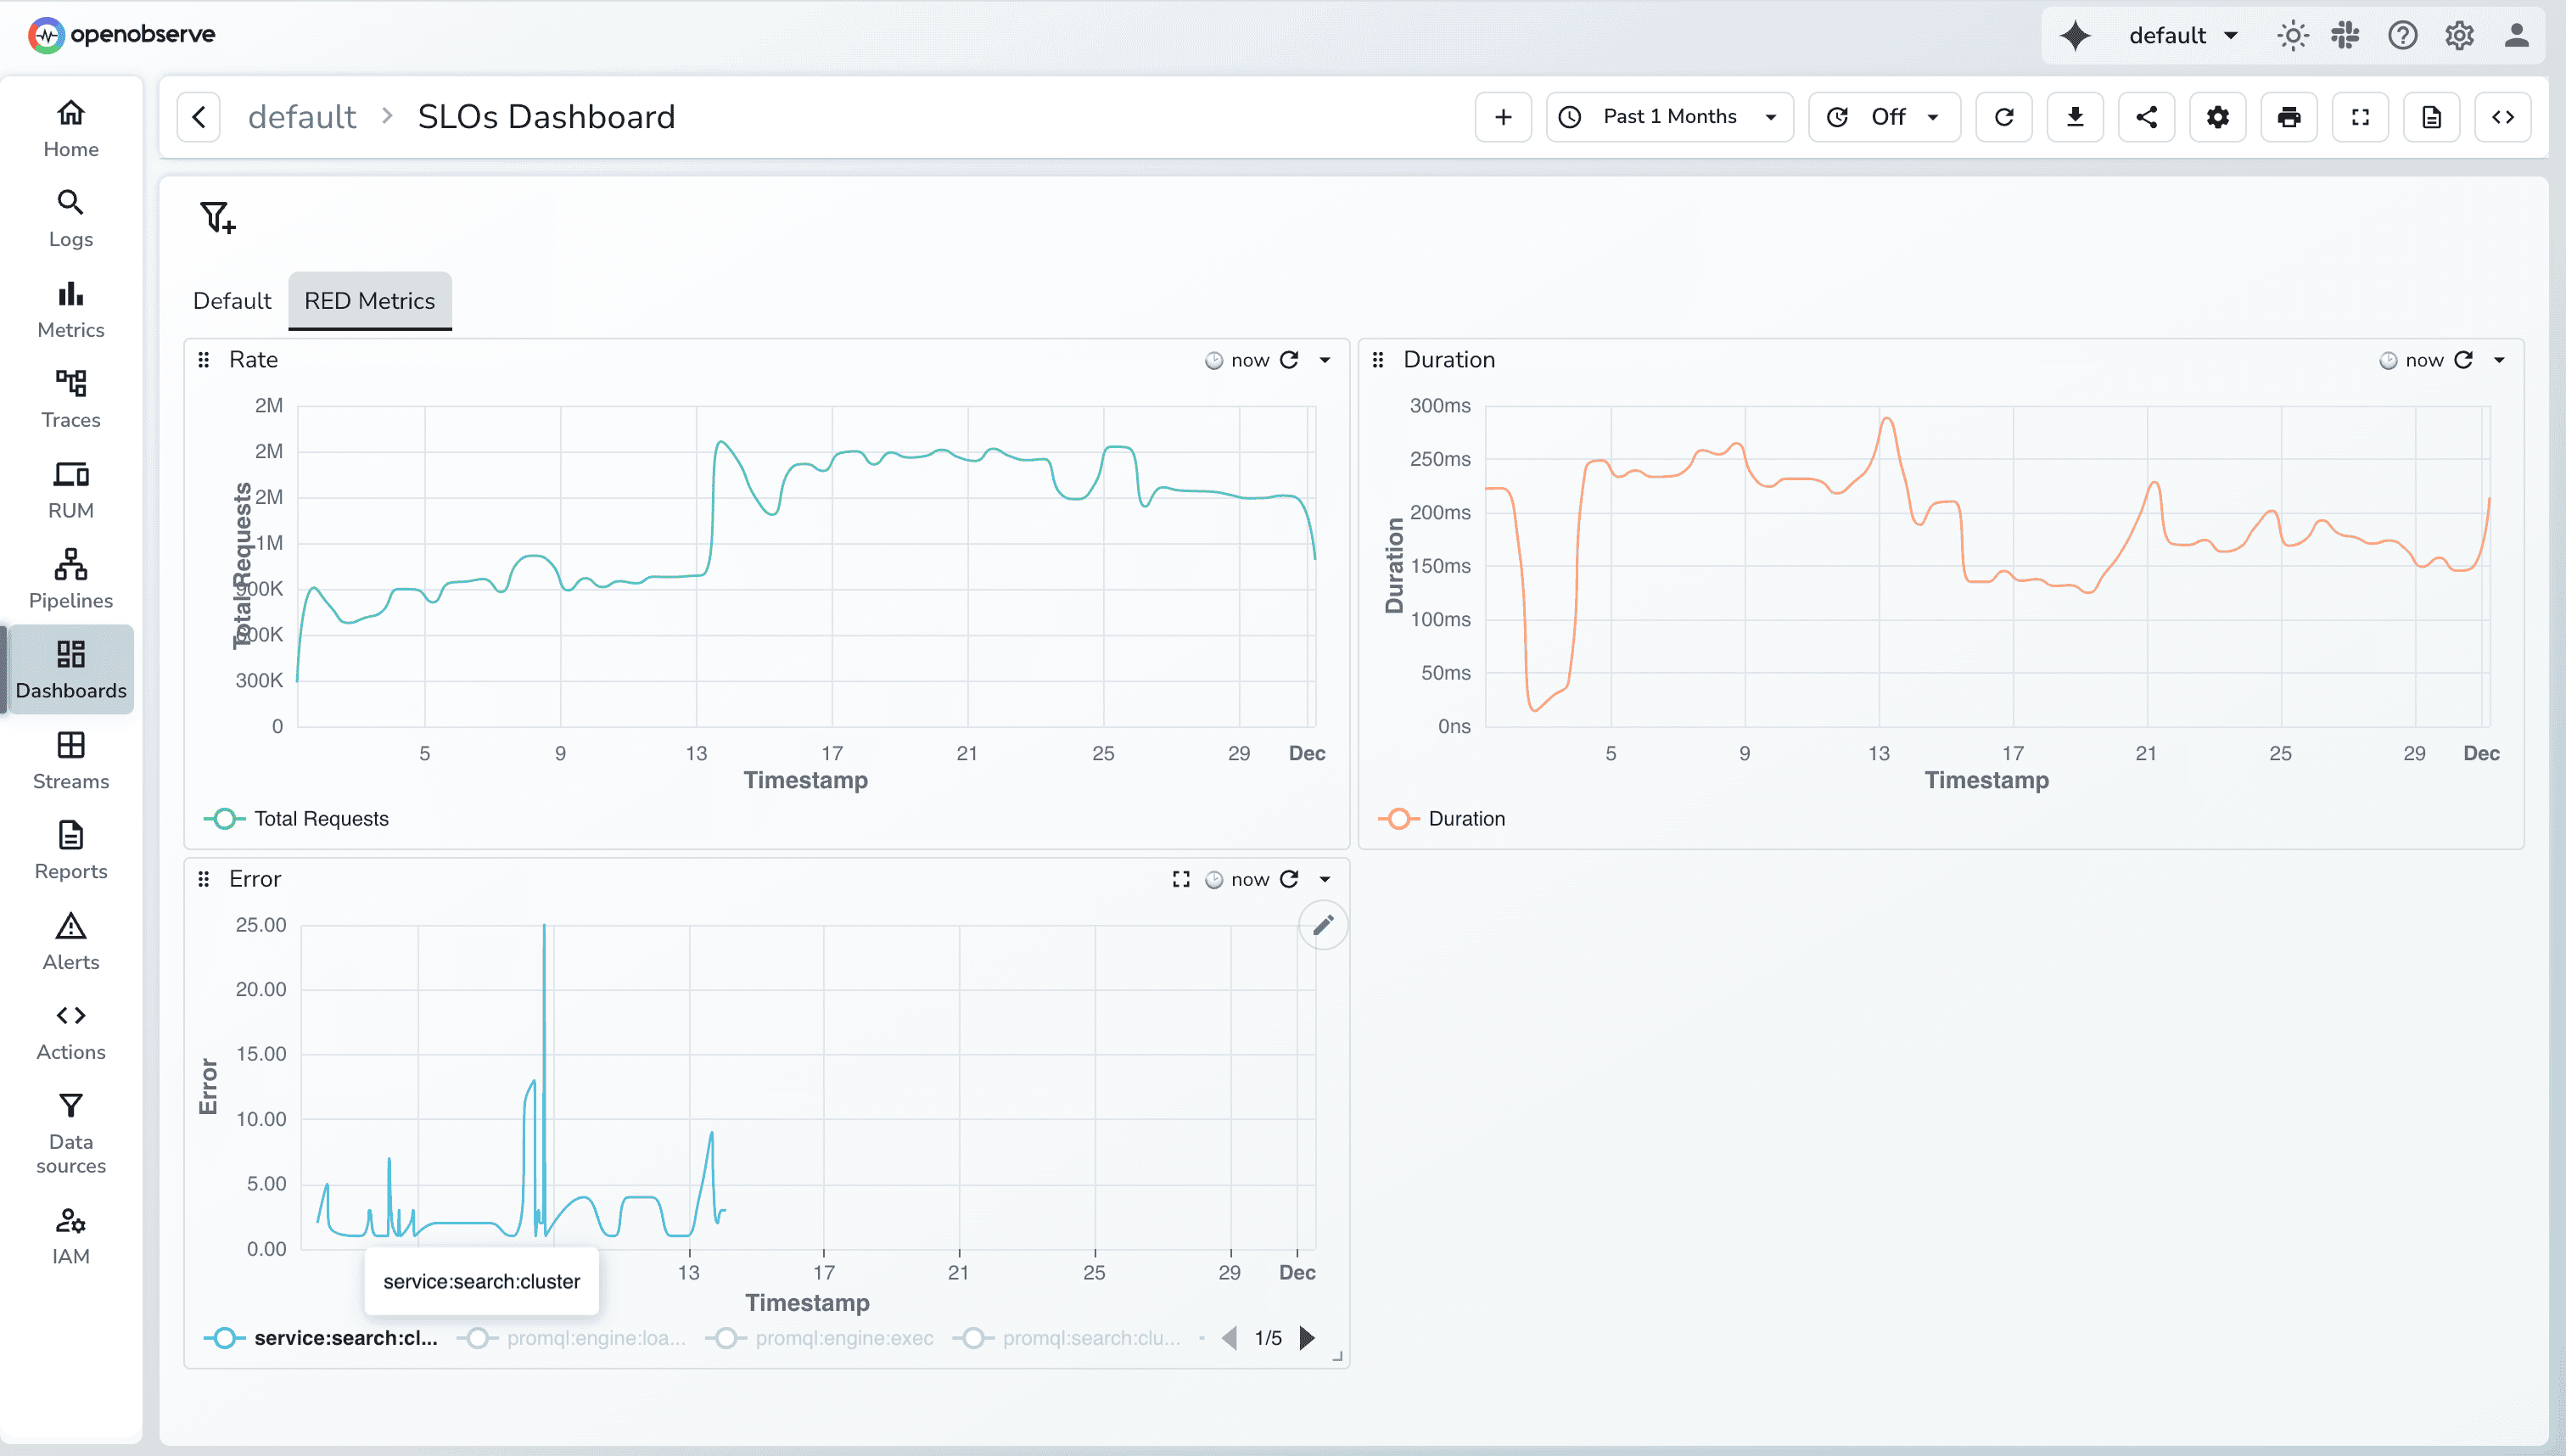
These three give you a uniform baseline for comparing service health. Beyond RED, saturation metrics matter when you are trying to understand whether a service is failing because it is overloaded or because something downstream is unavailable. Those two situations have different remediation paths, and you cannot tell them apart from RED metrics alone.
One thing teams often get wrong early on is writing alerts against infrastructure metrics like CPU percentage rather than against service-level outcomes. CPU at 80% on a node does not tell you whether users are being affected. An error rate crossing 0.5% does. Alerting on Service Level Objectives tied to user-facing behavior is more work to set up initially but produces far fewer false positives.
Logs are timestamped records of discrete events: errors, state changes, branch decisions, external API responses, anything your code explicitly records. In microservices monitoring, logs are the diagnostic layer. Once metrics tell you something is wrong and traces tell you where it is, logs tell you what actually happened.
For logs to be useful in a microservices context they need to be structured, meaning JSON rather than free-form text. Unstructured logs are manageable in a single-service environment. In a system where 50 services are each writing thousands of log lines per second, full-text search across unstructured logs does not scale. Structured logs with consistent field names allow you to filter, aggregate, and join across services in ways that plain text does not support.
The single most important field in any log line for microservices monitoring is the trace ID. When every log line from every service includes the trace ID of the request it belongs to, you can pull every log line related to a single user request across your entire system with one query. Without it, correlating logs across services during an incident means reconstructing the request flow manually from timestamps and service names, which is slow and error-prone.
A minimal structured log line for microservices monitoring should carry at least:
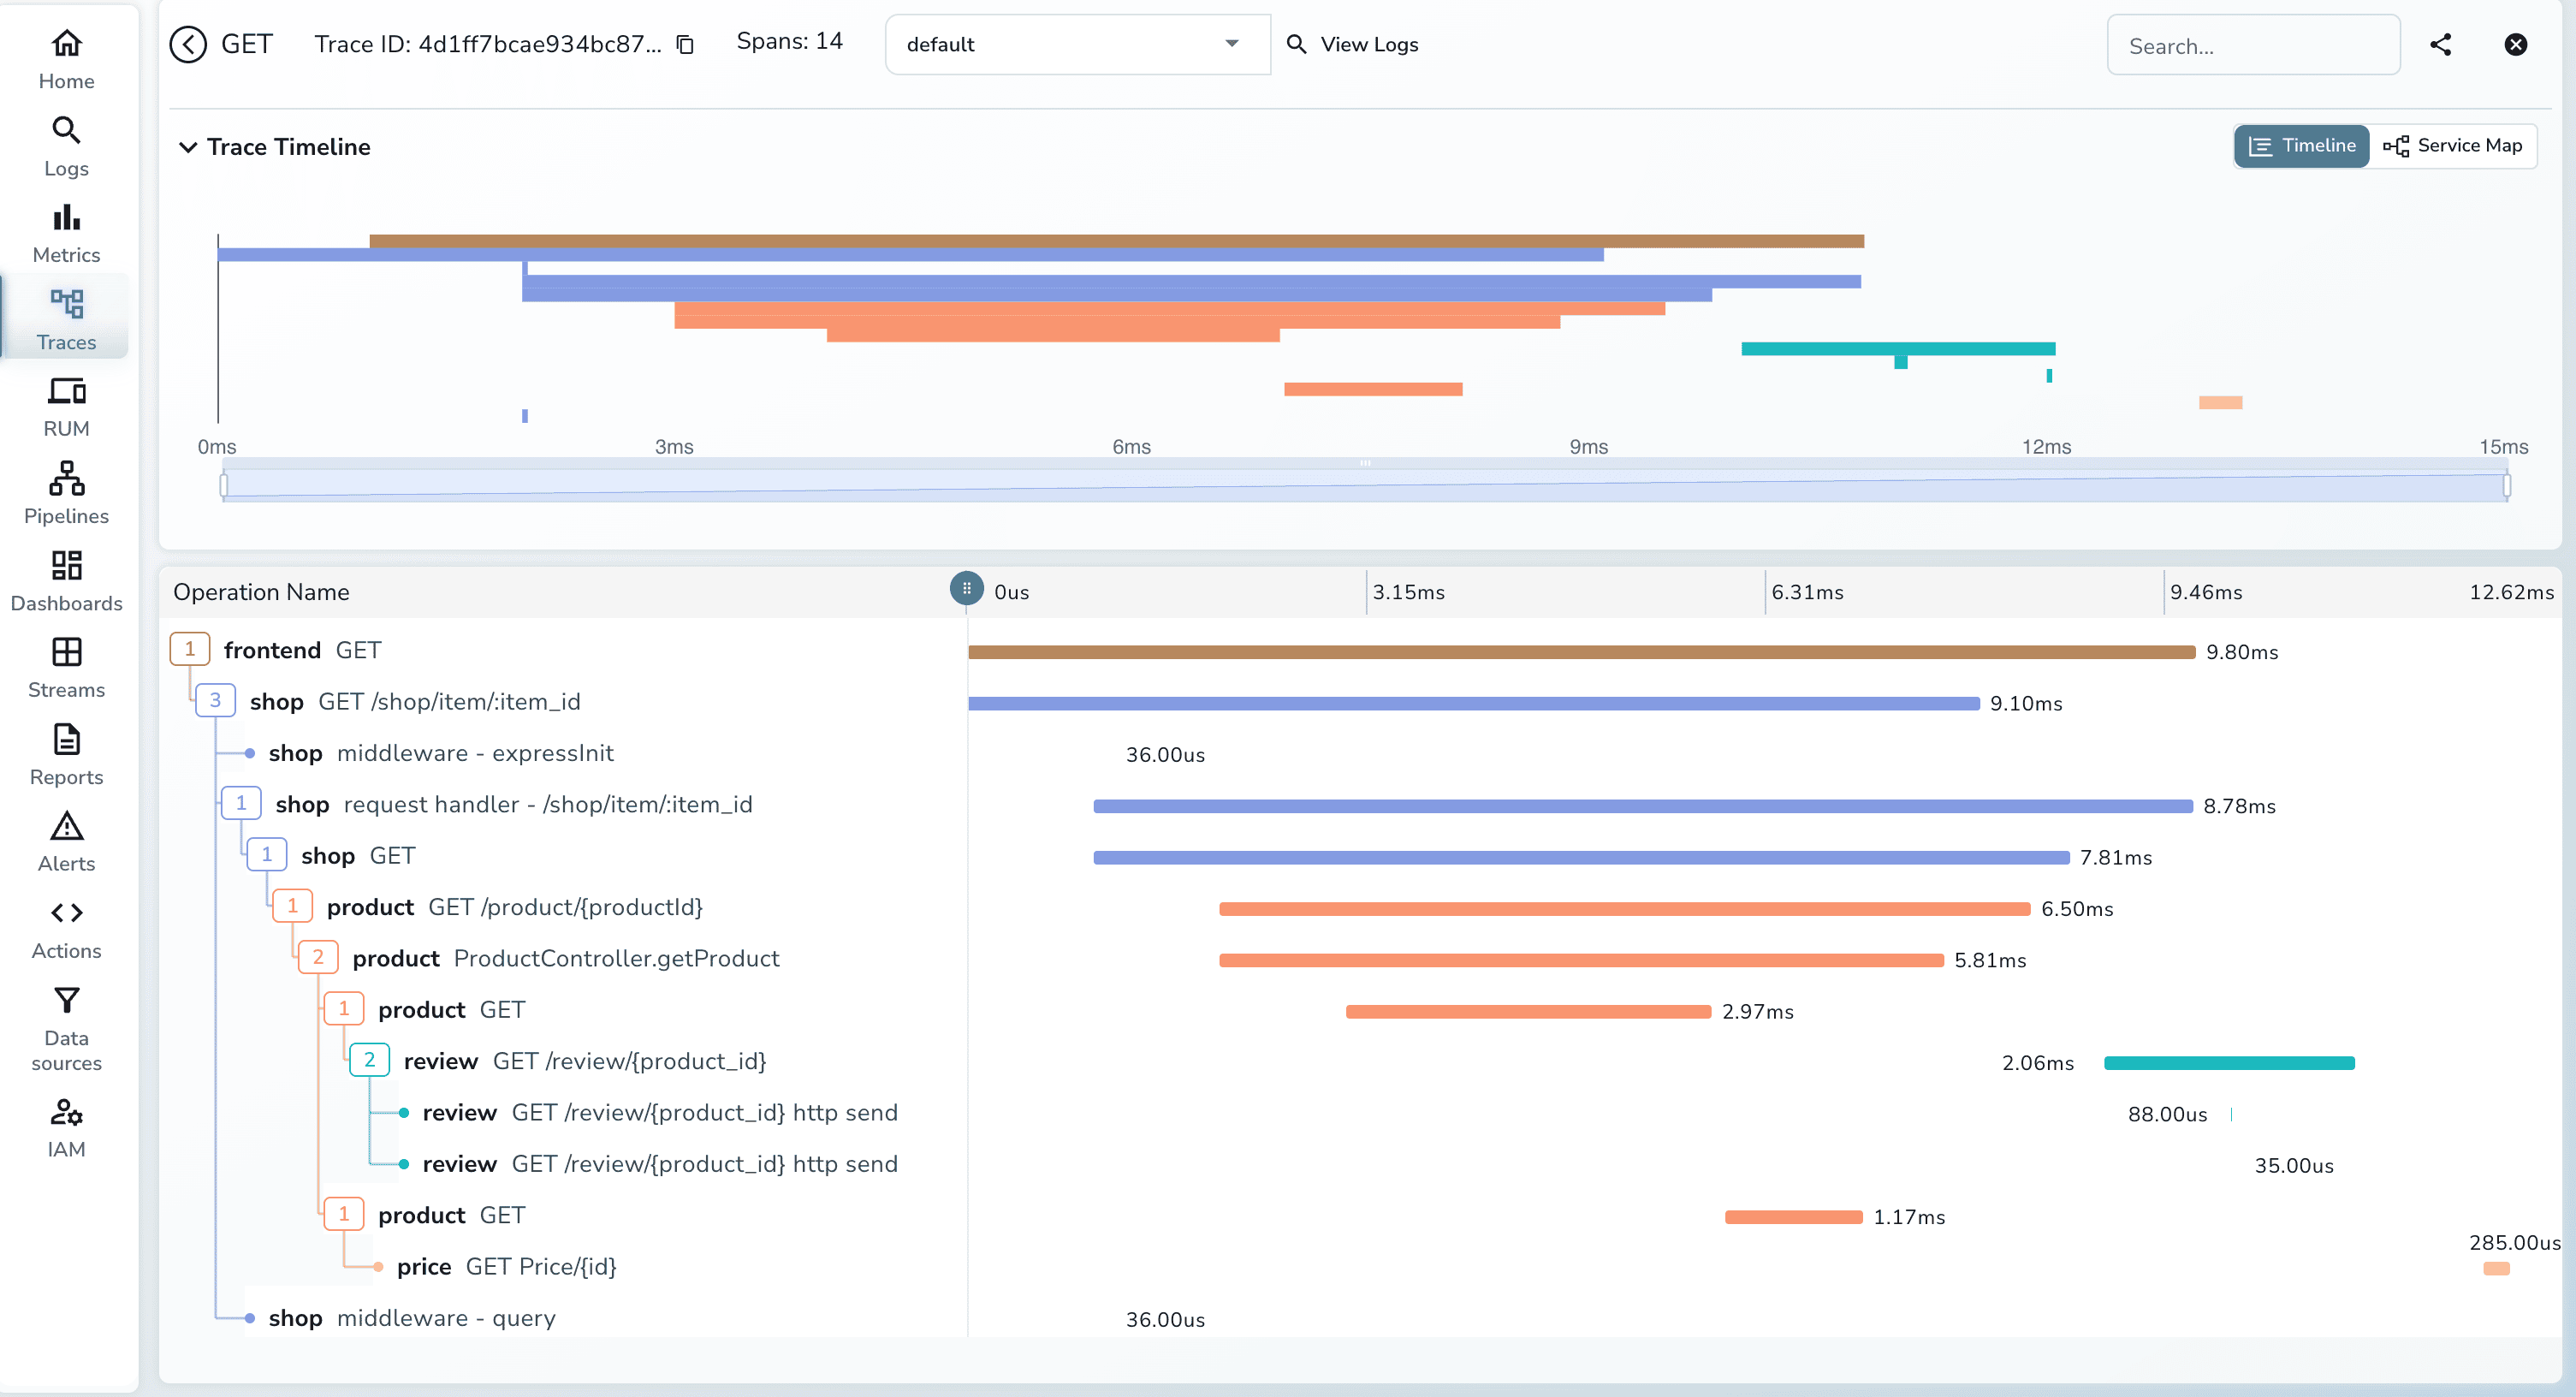
timestamp (ISO 8601 with milliseconds)service name and versiontrace_id from the active OTel contextlevel (info, warn, error)message field, not a concatenated stringDistributed traces are the telemetry type that makes microservices monitoring categorically different from anything before it. A trace is an end-to-end record of a single request as it moves through your entire service graph. It is composed of spans, where each span represents one unit of work in one service: an inbound HTTP request, a database query, a cache lookup, an outbound call to another service. Spans carry the operation name, start and end timestamps, and any attributes you attach.
Distributed tracing answers the question that metrics and logs cannot: given a slow or failed request, which service in the chain was responsible, and how much of the total latency did each hop contribute? A trace visualized as a waterfall or flame graph shows you the complete request journey, annotated with timing at every step.
The implementation works by propagating a trace context through every network call:
OpenTelemetry is the standard instrumentation library for this in 2026. It provides auto-instrumentation agents for Java, Python, Node.js, Go, .NET, and Ruby that handle context propagation automatically. For most services, adding distributed tracing means attaching the OTel agent at startup and pointing it at a collector, with no code changes required.
The three types of telemetry connect in sequence during an incident: metrics fire the alert, traces locate which service and which request paths are affected, logs provide the specific error context from that service at that moment. A monitoring platform that cannot correlate across all three forces you to do that correlation manually.
Knowing which metrics to collect matters as much as collecting them. The common failure mode is collecting everything by default and building dashboards that show a lot of data without giving clear answers.
Here is a practical breakdown by metric category:
Service health (RED, per service)
Service-to-service health
Saturation
SLO budget consumption An SLO defines a measurable user-facing expectation: "99.9% of checkout requests complete in under 500ms over any 30-day window." Alerts should fire when error budget consumption rate is high enough to threaten the SLO, not when a raw metric crosses an arbitrary threshold. The initial SLO definition requires some judgment and some baseline traffic data, but it pays off immediately in reduced alert noise.
With the concepts established, the practical question is which platform to use. The options commonly evaluated for microservices monitoring are Datadog, Dynatrace, and New Relic on the commercial side, and Prometheus with Grafana, SigNoz, and OpenObserve on the open-source side. Each makes different tradeoffs.
OpenObserve is the option that works best for most microservices monitoring setups in 2026, for reasons that are specific and measurable.
OpenObserve is an open-source observability platform that ingests logs, metrics, and distributed traces into a single backend, stores them in Parquet columnar format on S3-compatible object storage, and provides a unified query interface for all three. Written in Rust, with a query engine built on Apache DataFusion. It accepts telemetry via OTLP (the OpenTelemetry wire protocol) and also via Fluentbit, Fluentd, Logstash, Prometheus remote write, Jaeger, and Zipkin. No proprietary agents required.
Deployment options:
The storage cost difference between OpenObserve and Elasticsearch-based platforms is 140x. That number comes from the architectural difference between columnar storage (Parquet) and index-based storage (Elasticsearch inverted indexes). Columnar storage compresses repetitive structured data much more efficiently, and reads far less data during analytical queries because it skips columns not referenced in the query.
For microservices monitoring specifically, this matters because telemetry volume grows with the size of your service graph. A 50-service architecture at moderate traffic generates log and trace data at a rate that, stored in Elasticsearch, costs several hundred dollars a month in storage alone. The same data in OpenObserve on S3 costs a fraction of that.
Teams migrating from Datadog or ELK to OpenObserve consistently report 60 to 90% reductions in total observability costs — see the detailed cost breakdown. One documented case (Evereve, a retail platform) consolidated Datadog, New Relic, AppSignal, and a Prometheus-Grafana stack into OpenObserve and described the outcome as no longer having to decide whether to monitor something based on what it would cost.
Datadog charges per unique metric time series. In a microservices architecture with high-cardinality labels (pod name, deployment version, customer region, request endpoint), the number of unique time series grows fast. Teams end up dropping useful labels to keep their Datadog bill predictable. The debugging cost of those dropped labels never appears on any invoice.
OpenObserve uses flat per-GB pricing regardless of cardinality. You can label your microservices metrics with pod names, versions, regions, and endpoint paths without any cost penalty. Whether that matters depends on whether you need those dimensions to debug incidents. In most microservices monitoring setups, the answer is yes.
The conventional open-source microservices monitoring stack looks like this:
That stack is functional but fragmented (see the OpenObserve vs Grafana stack comparison for a detailed breakdown). During an incident you open Grafana for the metrics alert, switch to Jaeger to find the slow trace, then switch to Kibana or Loki to read the logs for that trace. Each tool has its own query language. The context switching is not a large problem on a calm Tuesday afternoon; it adds real minutes during an incident at 2am when you are already under pressure.
OpenObserve stores all three telemetry types in the same platform and queries them through a unified interface. From a metrics alert you pivot to traces filtered to the same service and time window. From a trace span you jump to the correlated log lines. The query language (SQL or PromQL, your choice) does not change based on which telemetry type you are looking at.
This is not a convenience feature. It is the difference between an incident that takes 12 minutes to resolve and one that takes 45 minutes, specifically because the engineer does not spend time re-orienting across three different UIs with three different data models.
Datadog's query language is proprietary. Splunk's is SPL, also proprietary. Learning a proprietary query language is a one-time cost but the lock-in persists; when you want to move platforms, your queries do not transfer.
OpenObserve supports:
SQL support in a log platform turns out to be more capable than most people expect. Being able to write analytical queries against structured log data covers a large portion of the use cases that would otherwise require a separate data pipeline or a more expensive analytics tool.
OpenObserve accepts data over OTLP without any intermediate translation. OTel metrics are not treated as custom metrics and are not subject to cardinality limits. Auto-instrumentation agents for most languages produce traces that appear in OpenObserve's trace UI with no additional configuration. Service dependency maps are generated automatically from the trace data.
Because OpenTelemetry is vendor-neutral, pointing your services at OpenObserve does not create lock-in. The instrumentation code is the same regardless of which backend you use. If you later want to evaluate another platform, you change the OTel Collector exporter configuration; you do not re-instrument your services.
Step 1: Run OpenObserve locally or deploy to Kubernetes.
For local development or evaluation:
ZO_ROOT_USER_EMAIL="admin@example.com" ZO_ROOT_USER_PASSWORD="yourpassword" ./openobserve
The web UI is available at http://localhost:5080. For production, the Helm chart deployment separates ingester, querier, and compactor roles across Kubernetes deployments, each pointing at an S3 bucket for storage. Refer to the OpenObserve docs for more details on deployment options.
Step 2: Deploy the OTel Collector and configure it to export to OpenObserve.
The relevant exporter section in the collector config:
exporters:
  otlphttp:
    endpoint: https://your-openobserve-instance/api/your-org/
    headers:
      Authorization: "Basic <base64-encoded-credentials>"

service:
  pipelines:
    traces:
      receivers: [otlp]
      exporters: [otlphttp]
    metrics:
      receivers: [otlp]
      exporters: [otlphttp]
    logs:
      receivers: [otlp]
      exporters: [otlphttp]
Step 3: Instrument your services with OpenTelemetry.
If your services already send metrics to Prometheus, configure Prometheus remote write to forward metrics to OpenObserve while keeping your existing Grafana dashboards operational. This lets you migrate incrementally rather than cutting over everything at once.
For services not yet instrumented, the OTel auto-instrumentation agents cover most common cases:
OTEL_SERVICE_NAME and OTEL_EXPORTER_OTLP_ENDPOINT. No code changes required.opentelemetry-instrument python app.py@opentelemetry/auto-instrumentations-node at startupmain() (requires a few lines of code; no annotation-style agent available)Step 4: Configure ingest pipelines.
OpenObserve's ingest pipeline runs transformation and enrichment logic on telemetry as it arrives. Useful applications for microservices monitoring:
trace_id field so you can find instrumentation gapsGetting data quality right at ingest is less expensive than querying and filtering low-quality data later.
Step 5: Define SLOs and create dashboards.
OpenObserve provides a library of community dashboards for common microservices monitoring use cases: Kubernetes cluster health, service RED metrics, database performance, and API gateway monitoring. Custom dashboards use PromQL for metrics charts and SQL for log-based visualizations.
For alerts, define SLO-based rules before adding any threshold-based rules. The SLO definition work forces you to articulate what "working" means for each service, which makes every subsequent alert decision easier.
Standardize on OpenTelemetry before configuring any backend. The correlation between metrics, traces, and logs in OpenObserve depends on shared trace IDs flowing through all three. Inconsistent trace ID formats or missing context propagation in outbound calls breaks the unified query experience. OTel's auto-instrumentation handles this automatically for most services; it requires manual attention only for services making HTTP calls through non-standard clients or using async messaging where headers need to be forwarded explicitly.
Define SLOs first, then alerts. A microservices architecture produces a large number of potential alert sources. Creating threshold-based alerts on raw metrics for every service before establishing what normal looks like is the fastest way to drown in noise. SLO-based alerts require knowing your baseline error rate and latency distribution, but they produce alerts that are directly tied to user impact.
Use the ingest pipeline to enforce trace ID presence. Configure a pipeline rule that flags log records missing a trace_id field into a separate stream. Running this for a week after enabling log ingestion usually reveals which services are missing OTel instrumentation or not propagating context correctly through async calls.
Migrate from Prometheus-Grafana incrementally. The Prometheus remote write path to OpenObserve means you do not have to choose between keeping your existing dashboards and starting to use OpenObserve's trace and log correlation. You can run both simultaneously during a transition period of weeks or months.
Building dashboards around container metrics instead of service metrics. Container restarts and CPU spikes are interesting as supporting signals but a service can have zero container restarts and still be returning a 40% error rate. The RED metrics for the service itself are what tell you whether users are being affected.
Fragmented tooling with no plan to consolidate. Running Prometheus for metrics, Elasticsearch for logs, and Jaeger for traces is functional but means that during an incident the on-call engineer has to keep three browser tabs open, translate between three query languages, and manually correlate timestamps and trace IDs across systems. For smaller teams doing this today, it is worth benchmarking how long a typical incident investigation actually takes before deciding the fragmentation is acceptable.
Not propagating trace IDs into logs. Log lines without trace IDs are queryable by service and timestamp. Log lines with trace IDs are queryable by specific request, which is a fundamentally more useful unit during incident response. Most OTel instrumentation handles this automatically for outbound HTTP calls; the gap is usually internal logging where engineers call a logger directly without injecting the OTel context. The fix is to pass the OTel context object into your logging calls so the SDK can inject the trace ID automatically.
Alerting on infrastructure before defining service-level expectations. CPU threshold alerts on individual nodes generate noise without actionable context. An SLO breach alert tells you a user-facing contract is at risk. The former wakes you up at 3am for something that may not matter. The latter wakes you up because it does.
Microservices architectures introduce monitoring challenges that are qualitatively different from traditional single-service setups: cascading failures that cross service boundaries, label cardinality that compounds with every new service and deployment dimension, and log lines scattered across dozens of services with no shared context threading through them. The solutions are equally specific — distributed traces for following requests end-to-end, structured logs with trace ID propagation, and a platform that correlates across all three telemetry types without requiring manual cross-referencing during an incident.
OpenObserve addresses each of these directly. 140x lower storage costs than Elasticsearch-based stacks mean you can label your metrics with the cardinality your debugging actually needs. Unified logs, metrics, and traces in a single platform mean on-call engineers are not context-switching between three UIs at 2am. Native OTLP ingestion and PromQL support mean your existing OpenTelemetry instrumentation and Prometheus queries transfer without changes.
Get started:
Related reading:
Passionate about observability, AI systems, and cloud-native tools. All in on DevOps and improving the developer experience.


