How We Cut a Query From 49 Seconds to 2 Seconds in OpenObserve — A 25× Win From Two Config Changes


Don’t forget to share!
Getting Started with OpenObserve
Try OpenObserve Cloud today for more efficient and performant observability.
The most convincing moment in performance work isn't "average latency dropped a little." It's the kind of change a user feels instantly: yesterday this query took almost a minute. Today it comes back in two seconds.
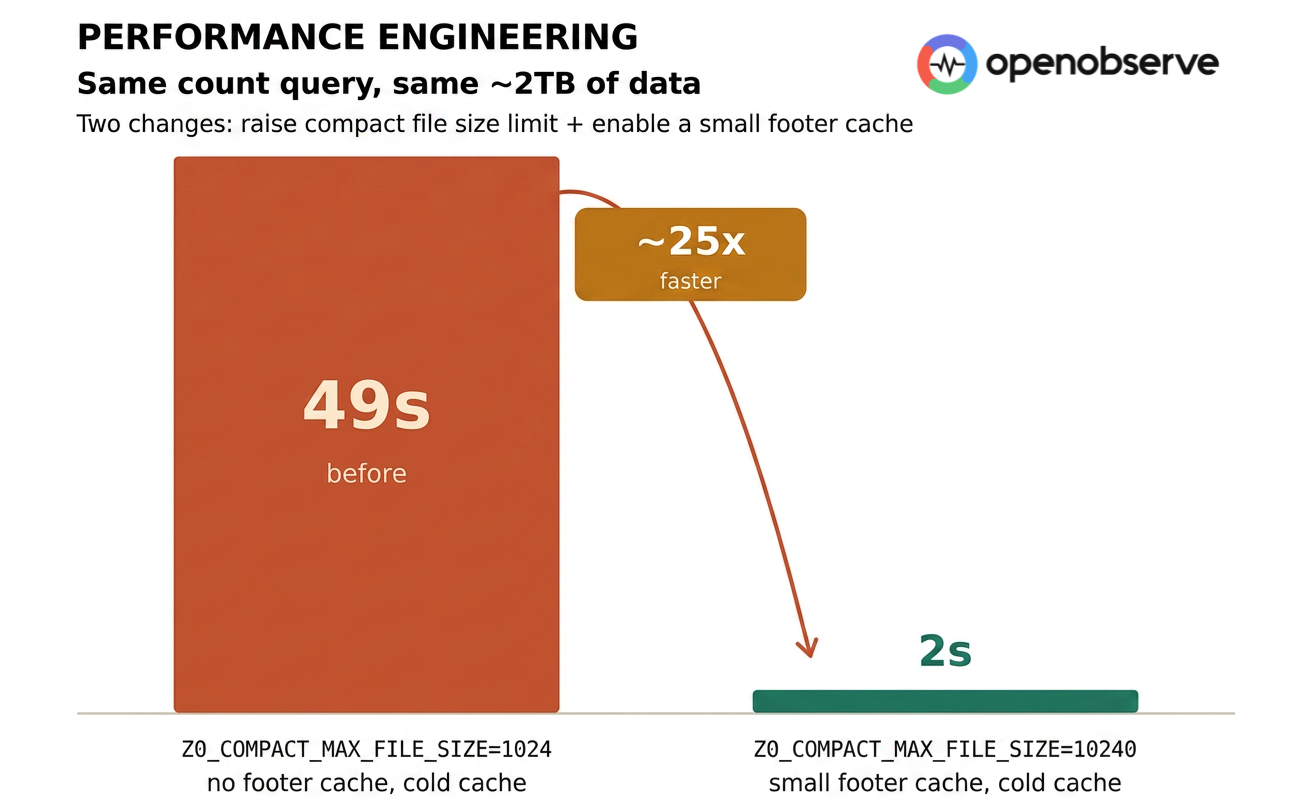
That's what we measured on OpenObserve's Tantivy query path. Same ~2TB of data, same count query, same querier config — two parameter changes took the query from 49 seconds to 2 seconds. Roughly 25× faster.
To avoid confusion, let's pin down the variables up front.
"1GB" and "10GB" do not refer to query size. They refer to ZO_COMPACT_MAX_FILE_SIZE=1024/10240 — the maximum size of a single file after compaction. Both runs query the same ~2TB of data; the only difference is how that data is laid out on disk.
ZO_COMPACT_MAX_FILE_SIZE=1024 → 1GB max per file → ** 2,048 files**ZO_COMPACT_MAX_FILE_SIZE=10240 → 10GB max per file → ** 205 files**The querier config stays the same throughout. A single querier:
querier:
  limits:
    cpu: 2
    memory: 8Gi
  requests:
    cpu: 1
    memory: 2Gi
File count drops by almost an order of magnitude — from ~2,000 to ~200. Keep that number in mind. It's the root cause behind almost every counter-intuitive result that follows.

What were the two changes, exactly?
Change 1: raise ZO_COMPACT_MAX_FILE_SIZE from 1024 to 10240.
Change 2: enable footer cache.
Worth flagging: footer cache is a new feature we built specifically for this performance work, and it ships in the next release. It's a small local in-memory cache that holds the footer of each Tantivy index file, so cold queries don't have to refetch them from S3 every time.
That's it. The same count query:
SELECT count(*) as cnt
FROM "codelab_api_request_duration_seconds_bucket"
WHERE path = '/api/bar'
goes from 49 seconds to 2 seconds.
Each step's contribution is clean and additive:
| Stage | Configuration | count latency |
|---|---|---|
| Baseline | 1GB + cold cache + no footer cache | 49s |
| After change 1 | 10GB + cold cache + no footer cache | 4.5s |
| After change 2 | 10GB + cold cache + small footer cache | 2s |
Change 1 went from 49s to 4.5s — roughly 11×. Change 2 went from 4.5s to 2s — roughly 2.2×. Combined, ~24.5×.
But the numbers alone don't tell the story. The interesting question is: why does flipping one file-size setting and adding a tiny cache move latency by an entire order of magnitude? The answer lives in the S3 latency model.
The numbers look dramatic, but the mechanics are mechanical. First, one critical thing to pin down:
"Cache" and "no cache" in this test refer to the querier's local disk file cache. When there's no cache, every file read goes directly to object storage (S3) over the network.
This matters because a single S3 request takes 30–100ms. A local disk read is sub-millisecond. That's three orders of magnitude. So under cold cache, the real bottleneck isn't CPU, isn't disk throughput — it's how many S3 round trips you have to make.
Now let's do the math.
With ZO_COMPACT_MAX_FILE_SIZE=1024 (1GB), 2TB of data splits into about 2,048 Tantivy index files. Opening each file cold requires:
So opening one index file costs at least 5 S3 requests.
2,048 files × 5 IOs ≈ 10,000+ S3 requests.
That volume of network round-trips alone explains the tens-of-seconds latency. No amount of optimizer cleverness rescues you from it.
Raising ZO_COMPACT_MAX_FILE_SIZE from 1024 (1GB) to 10240 (10GB) compacts the same 2TB into about 205 files. File count drops 10×.
Each file still requires 5 IOs, but the total becomes:
205 × 5 ≈ 1,025 S3 requests
That's a 10× reduction in S3 requests. Which is exactly why the count query falls from 49s to 4.5s — one order of magnitude fewer network round trips, one order of magnitude lower latency.
Footer cache stacks on top.
The footer of a Tantivy index file is small, fixed-size, and reusable across queries — a perfect cache candidate. With footer cache enabled, those 2 footer IOs hit local memory instead of S3. Each file now costs only 3 data IOs:
205 × 3 ≈ 615 S3 requests
Compared to the original 10,000+, that's a ~16× reduction in total IOs. Combined with negligible-latency footer reads and downstream benefits (less scheduling overhead, better connection reuse, fewer small-file open/close cycles), end-to-end latency drops from 49s to 2s. That's the physical source of the ~25× speedup.

| Stage | Files | IOs / file | Total S3 requests | count latency |
|---|---|---|---|---|
| Before (1GB, no footer cache) | ~2,048 | 5 | ~10,000 | 49s |
| After change 1 (10GB, no footer cache) | ~205 | 5 | ~1,025 | 4.5s |
| After change 2 (10GB + footer cache) | ~205 | 3 | ~615 | 2s |
The 25× isn't about faster algorithms. It's about dropping S3 requests from 10,000+ down to ~600.
Object storage latency yields a simple truth: cut request count by an order of magnitude, and end-to-end latency collapses by an order of magnitude. This also explains the counter-intuitive result you'll see in the next section — bigger compact files don't slow queries down. They speed them up, because fewer files means better metadata reuse and fewer network round trips.
The chart below puts every test scenario side by side. The 25× isn't isolated — multiple query patterns improved across the board.

Linear scale matters here. The 49s red bar slams against the right edge while the 2s green bar is a thin sliver — that visual gap is the real 25×. Filtered histogram and group-by aggregation tell the same story: red bars towering, optimized bars collapsing.
Let's start with why the baseline was 49 seconds in the first place.
At ZO_COMPACT_MAX_FILE_SIZE=1024, disk cache state dominates. Same count query:
That's a ~35× gap at the median.
The takeaway: the count optimizer direction is right — when a query only needs to count and doesn't need to do heavy aggregation over full Parquet data, Tantivy lets us skip a lot of wasted scanning. But it also exposes a related problem: even a smart optimizer can't save you if every index file and piece of metadata is cold and lives in S3. I/O cost will drag you back down.
Filtered histogram tells the same story:
SELECT histogram(_timestamp) as "x_axis_1", count(*) as cnt
FROM "codelab_api_request_duration_seconds_bucket"
WHERE path = '/api/bar'
GROUP BY x_axis_1
ORDER BY x_axis_1 ASC
~16.5× cold/warm gap.
The unfiltered histogram is a different story. With no filter to narrow things down, it has to touch the full time range no matter what. Under 1GB, it takes 35s warm and 66s cold. Even moving to 10GB only gets it to 40s cold, 38s with footer cache — it doesn't collapse the way count and filtered histogram do.
That actually confirms the physics from earlier: when a query has to read most of the data anyway, cutting file count and metadata IOs can't save you. The bottleneck stops being "how many S3 requests" and becomes "how many bytes you actually have to move." But flip it around — add a single effective filter (say, WHERE path = '/api/bar') and the same query class drops under 4 seconds. That's one of the most valuable signals in this test: with an effective filter, Tantivy turns minute-scale histograms into seconds.
For a user opening a dashboard, dragging a time range, or drilling into a specific endpoint's behavior, they don't perceive "16.5× faster." They perceive: it used to lag; now it just shows up.
The picture changes once compact file size goes up.
Same count query, 10GB scenario:
The cold/warm gap drops from 35× to ~4.5×. Even without footer cache, 4.5s already crushes the 49s from the 1GB setup. This step alone delivers about 11× improvement.
Footer cache then takes it down to 2s — another 2.2×.
Filtered histogram follows the same trajectory:
Footer cache's real value isn't "make warm queries faster." It's: make cold queries less terrible.
What production systems actually fear isn't a one-off slow query — it's the same query returning in 2s sometimes and 20s other times, with no predictability. Footer cache attacks exactly that volatility.
Here's the result that surprises people:
ZO_COMPACT_MAX_FILE_SIZE=10240 isn't slower than 1024. It's measurably faster across multiple scenarios.
Most engineers' intuition says: bigger files = slower reads, smaller files = faster queries. On the Tantivy query path, that's wrong. With the same data volume and same query:
Why? At a fixed 2TB, going from 2,000 files to 200 files makes the entire execution path lighter:
This is especially true when filter selectivity is low — the query is actually touching very little data. The bottleneck isn't "total file size." It's how fast the index narrows the search and how cleanly the engine avoids touching unnecessary files. More files inflate every one of those fixed costs.
Warning: file size has a ceiling. After seeing the comparison above, you might think: "Should I push
ZO_COMPACT_MAX_FILE_SIZEto 50GB or 100GB for even better results?" Don't. Our recommendation is to cap it at 10GB.The compactor has to read multiple smaller files into memory and merge them into the larger output file. Bigger target files mean more memory pressure on the compactor. If you bump this value to 10GB and start seeing OOMs in the compactor, that's a signal your resources can't support files that large — either dial the size back down, or give the compactor more memory.
A rule of thumb for compactor sizing:
memory = CPU × ZO_COMPACT_MAX_FILE_SIZESo 4 CPUs targeting 10GB files → provision 40GB of memory. This is a conservative floor that keeps compaction from failing under memory pressure.
Tantivy's value comes from narrowing the search first.
Without an index, a filtered query roughly does: open many Parquet files → read metadata → scan relevant row groups or pages → evaluate filter conditions → then do the count / histogram / group by.
With Tantivy: hit the index to identify candidate rows → read only the necessary Parquet data → run optimizers (count, histogram, etc.) on that minimal data.
When filter selectivity is low (say, 0.2% hit rate), the gap between those two paths is enormous. That's why filtered count and histogram queries are where 10×, 20× improvements happen most reliably.
A few clear directions from this run.
First, Tantivy's optimizer coverage is largely in place — the next step is refinement. Field filters, count, histogram, and group by — the most common patterns in logs, metrics, and traces — already route through the index. As this test shows, they deliver 10×–20× speedups when filter selectivity is low. The work ahead isn't covering new patterns; it's polishing the edges on what we already cover: multi-column filter combinations, pushing more complex expressions down to the index, and making sure the optimizer reliably kicks in on the long tail of real-world SQL.
Second, footer cache deserves further investment. Its impact on cold-cache scenarios is direct: less repeated metadata reading, less dependence on OS page cache state.
Third, compact file sizing can't be evaluated in isolation. Smaller files don't always mean faster queries. In this test, at a fixed 2TB and fixed querier config, 10GB beats 1GB across every filter selectivity we tried.
Fourth, "total data size" is the wrong metric for performance testing. What actually determines query performance: filter selectivity, index hit path, partition layout, metadata / footer cache hit rate, whether the optimizer kicks in, and how much Parquet data actually gets read. You need all of those to explain why one query returns in seconds and a query over the same data takes a minute.
One sentence:
OpenObserve's Tantivy query path can now turn minute-scale filtered queries into second-scale ones.
And the complete optimization path is worth repeating: same ~2TB of data, same count query, just two changes — raise ZO_COMPACT_MAX_FILE_SIZE from 1024 to 10240, and turn on a small footer cache — and latency drops from 49 seconds to 2 seconds. About 25× faster.
When both changes land, what users see isn't an abstract optimization percentage. It's a very concrete experience shift:
The same query that used to take nearly a minute now returns in 2 seconds.
ZO_COMPACT_MAX_FILE_SIZE=1024/10240 — the post-compaction max file size, not query data volumeNew to OpenObserve? Register for our Getting Started Workshop for a quick walkthrough.
Hengfei Yang is the founding engineer at OpenObserve. He has extensive experience in distributed system development. He is passionate about open source and has interests in traveling, music and photography.
Huaijin Hao is a backend engineer at OpenObserve, focused on building scalable, high-performance distributed systems. He is passionate about cloud-native technologies and open source.