VMware vSphere Monitoring with OpenTelemetry Collector on Windows




Ready to get started?
Try OpenObserve Cloud today for more efficient and performant observability.

VMware vSphere monitoring with OpenTelemetry means running the OpenTelemetry Collector Contrib distribution with the vcenter receiver, which polls the vSphere SDK for datacenter, cluster, host, VM, datastore, and vSAN metrics and exports them over OTLP. No vendor agent goes on your ESXi hosts, and no software gets installed on the vCenter appliance.
This guide walks the whole path on a Windows host: preparing vCenter, installing the collector, writing the config, running it as a service, adding ESXi syslog, and validating that data actually landed in OpenObserve. It also covers the one configuration mistake that catches almost everyone the first time, where the inventory shows up perfectly and the Metrics explorer stays stubbornly empty.
Key takeaways
- The
vcenterreceiver ships only in the Contrib collector build, and it polls vCenter over HTTPS 443 with a read-only account. - Missing disk latency or throughput series is nearly always a vCenter statistics level problem, not a collector problem.
- Use two separate
otlphttpexporters: metrics with nostream-nameheader, logs with one. Sharing a single exporter is what collapses every metric into one stream. - The collector's own telemetry on port 8888 tells you which half of the pipeline to blame before you go hunting in the UI.
How does the vcenter receiver collect VMware metrics?
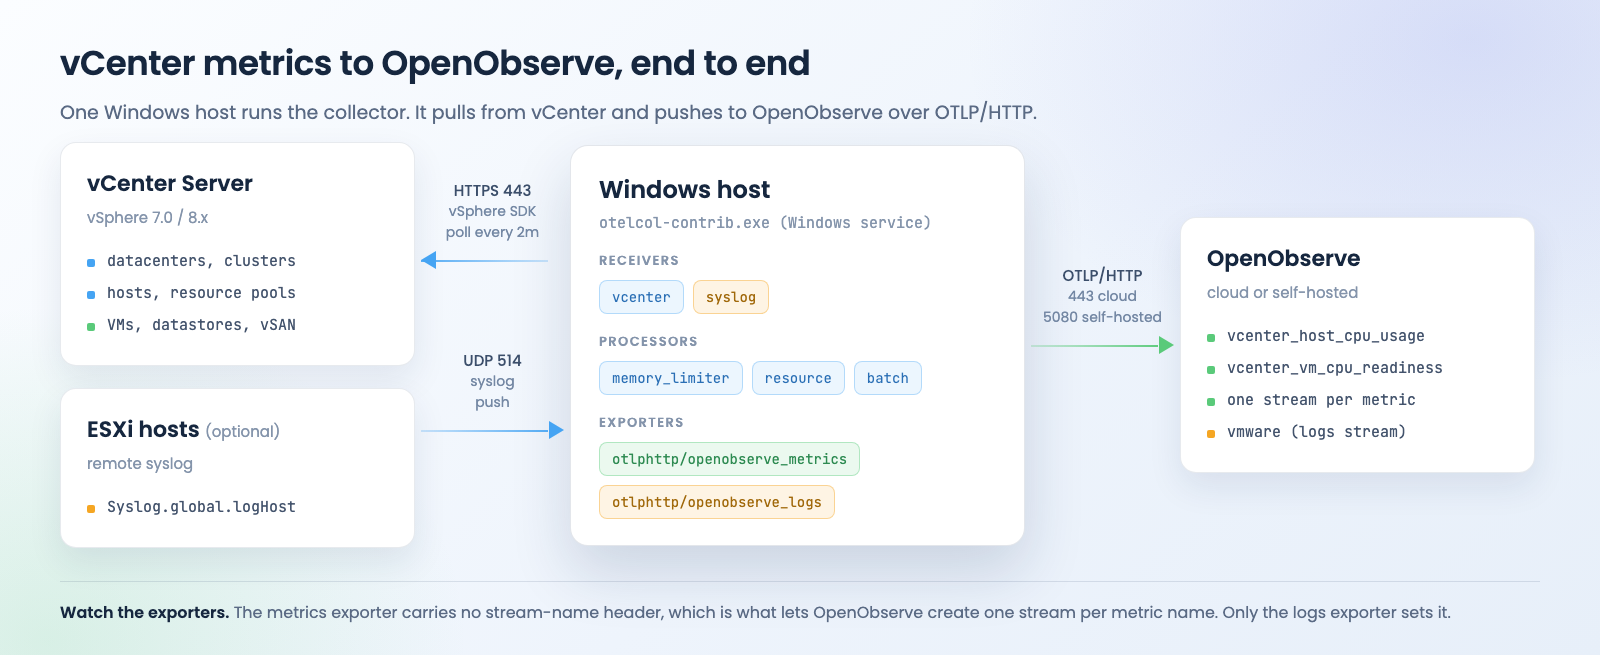
A few things worth knowing before you touch any config:
- The
vcenterreceiver is a poll-based scraper. It authenticates to the vSphere SDK endpoint athttps://<vcenter>/sdkand pulls metrics for datacenters, clusters, hosts, resource pools, VMs, datastores, and vSAN on an interval you choose. - The collector runs anywhere with network reach to vCenter over 443. It does not need to run on the vCenter appliance. A Windows VM or jump host is fine.
- Metrics leave the collector through the
otlphttpexporter pointed at the OpenObserve OTLP HTTP ingestion endpoint, with Basic auth. - Metrics and logs use two separate exporter definitions pointed at the same endpoint. The only difference between them is whether the
stream-nameheader is present. That detail matters more than it looks, and it gets its own section below. - ESXi syslog is optional and completely independent of the metrics path.
If you have not worked with the collector before, the OpenTelemetry Collector glossary entry covers the receiver, processor, exporter model this config is built on.
What you need before you start
| Requirement | Detail |
|---|---|
| Windows host | Windows Server 2016 or later, or Windows 10/11, x64. 2 vCPU and 4 GB RAM covers most environments |
| Network | Outbound 443 to vCenter. Outbound 5080 (self-hosted) or 443 (cloud) to OpenObserve. Inbound UDP 514 only if you collect ESXi syslog |
| vSphere versions | The receiver is built and tested against vCenter and ESXi 7.0 and 8 |
| vCenter account | A dedicated read-only user with permissions propagated to every monitored object |
| OpenObserve | An organization, and ingestion credentials (user email plus an ingestion token). Streams get created on first ingest |
| Admin rights | Local Administrator on the Windows host, to install the service |
Preparing vCenter
Create a read-only monitoring user
- In the vSphere Client, go to Administration > Single Sign On > Users and Groups.
- Create a user, for example
otel-monitor@vsphere.local, with a strong password. - Go to Administration > Access Control > Global Permissions, or the root vCenter object then Permissions.
- Add the user with the built-in Read-only role and check Propagate to children.
The receiver only reads inventory and performance data. It never needs write, console, or datastore browse permissions, so there is no reason to grant them.
Check your performance counter statistics levels
Several metrics depend on vCenter statistics levels, found under Administration > vCenter Server Settings > Statistics, or Configure > General > Statistics on the vCenter object:
| Statistics level | Metrics that need it |
|---|---|
| Level 1 (default) | Most capacity and usage metrics: CPU, memory, counts, datastore |
| Level 2 | vcenter.host.disk.latency.avg, vcenter.vm.disk.latency.avg, vcenter.vm.disk.throughput |
| Level 3 | vcenter.host.disk.latency.max |
| Level 4 | vcenter.host.disk.throughput |
If disk latency or throughput series are missing in OpenObserve, this is almost always why. Raise the level on the shortest interval (5 minutes) only. Raising every interval bloats the vCenter statistics database and buys you nothing.
Two related gotchas worth checking at the same time:
- Powered-off VMs emit no performance counters. Inventory metrics such as
vcenter.datacenter.vm.countstill include them, but CPU, memory, disk, and network series will not exist for them. - Hosts in maintenance mode or in a disconnected state drop out of performance collection while staying in the inventory. If a whole cluster looks like names without numbers, check host connection state first.
TLS
By default the receiver rejects self-signed vCenter certificates. Your options, best first:
- Use a vCenter with a CA-signed certificate, in which case there is nothing to configure.
- Export the vCenter CA certificate and reference it with
tls.ca_file. - Set
tls.insecure_skip_verify: true. Acceptable for a proof of concept, avoid it in production.
Installing the OpenTelemetry Collector Contrib on Windows
The vcenter receiver ships only in the Contrib distribution. The core otelcol build does not include it.
Download
Grab the latest Windows amd64 release from the collector releases page. In PowerShell, running as Administrator:
# Pin the version you want, and check the releases page for the current one
$version = "0.135.0"

New-Item -ItemType Directory -Force -Path "C:\otelcol" | Out-Null

Invoke-WebRequest `
  -Uri "https://github.com/open-telemetry/opentelemetry-collector-releases/releases/download/v$version/otelcol-contrib_${version}_windows_amd64.tar.gz" `
  -OutFile "C:\otelcol\otelcol-contrib.tar.gz"

tar -xzf C:\otelcol\otelcol-contrib.tar.gz -C C:\otelcol
You should now have C:\otelcol\otelcol-contrib.exe.
Releases also publish an MSI (otelcol-contrib_<version>_windows_x64.msi) that installs the binary and registers a Windows service named otelcol-contrib in one step:
msiexec /i "otelcol-contrib_0.135.0_windows_x64.msi" /qn COLLECTOR_SVC_ARGS='--config "C:\otelcol\config.yaml"'
Verify you got the right build
C:\otelcol\otelcol-contrib.exe components | Select-String "vcenter"
You should see vcenter listed under receivers. If nothing comes back, you downloaded the core distribution by mistake.
Directory layout used here
C:\otelcol\
  otelcol-contrib.exe
  config.yaml
  logs\            (optional, the collector's own file logs)
Finding your OpenObserve endpoint and credentials
In OpenObserve, go to Data Sources (Ingestion) > Custom > Metrics > OTLP HTTP, or the Traces and Logs tabs for their endpoints. The UI shows a ready-made endpoint plus an Authorization: Basic <base64> header value for your organization. Copy both. They are exactly what the collector needs.
Endpoint patterns
| Deployment | OTLP HTTP base endpoint |
|---|---|
| Self-hosted, single node | http://<host>:5080/api/<org_name> |
| Self-hosted behind TLS or a load balancer | https://o2.yourcompany.com/api/<org_name> |
| OpenObserve Cloud | https://api.openobserve.ai/api/<org_id> |
The otlphttp exporter appends /v1/metrics, /v1/logs, and /v1/traces to the base endpoint on its own, so configure only the base path shown above. Appending the signal path yourself is a common source of 404s.
One warning about localhost. Use http://localhost:5080/api/default only when OpenObserve and the collector run on the same machine. If you browse the OpenObserve UI at localhost:5080 from your desktop but the collector runs on a different Windows host, the collector needs the real hostname or IP of the OpenObserve machine. The default organization on a fresh self-hosted install is default.
Building the Basic auth token by hand
The token is base64(email:ingestion_password):
$pair = "you@company.com:YOUR_INGESTION_TOKEN"
[Convert]::ToBase64String([Text.Encoding]::UTF8.GetBytes($pair))
Use the resulting string as Basic <value> in the exporter headers.
The full collector config
Save this as C:\otelcol\config.yaml. It is a complete, production-oriented config: the vcenter receiver, a health check, memory protection, resource tagging, batching, retry and queueing on the exporter, and the collector's own telemetry.
Read the exporter section carefully. otlphttp/openobserve_metrics deliberately carries no stream-name header, which is what lets OpenObserve create one stream per metric name and populate the Metrics explorer normally. otlphttp/openobserve_logs carries the header and is used only by the logs pipeline further down. Do not add stream-name to the metrics exporter.
receivers:
  vcenter:
    endpoint: https://vcenter.yourcompany.local
    username: otel-monitor@vsphere.local
    password: ${env:VCENTER_PASSWORD}
    collection_interval: 2m
    initial_delay: 1s
    timeout: 90s
    tls:
      # Preferred: point at your vCenter CA bundle
      # ca_file: C:\otelcol\vcenter-ca.pem
      # Proof of concept only:
      insecure_skip_verify: true
    metrics:
      # Defaults are all on. Enable the optional extras below if you want them.
      vcenter.host.memory.capacity:
        enabled: true
      vcenter.vm.memory.granted:
        enabled: true
      vcenter.vm.cpu.time:
        enabled: true
      vcenter.vm.network.broadcast.packet.rate:
        enabled: true
      vcenter.vm.network.multicast.packet.rate:
        enabled: true

processors:
  memory_limiter:
    check_interval: 1s
    limit_mib: 1024
    spike_limit_mib: 256

  resource:
    attributes:
      - key: deployment.environment
        value: production
        action: upsert
      - key: service.name
        value: vmware-vcenter
        action: upsert
      - key: vcenter.instance
        value: vcenter.yourcompany.local
        action: upsert

  batch:
    send_batch_size: 8192
    send_batch_max_size: 16384
    timeout: 10s

exporters:
  # METRICS. No stream-name header. OpenObserve creates one stream per metric name.
  otlphttp/openobserve_metrics:
    endpoint: https://api.openobserve.ai/api/your_org_id
    # Self-hosted example:
    # endpoint: http://openobserve.internal:5080/api/default
    headers:
      Authorization: "Basic ${env:O2_AUTH_TOKEN}"
    compression: gzip
    timeout: 30s
    retry_on_failure:
      enabled: true
      initial_interval: 5s
      max_interval: 60s
      max_elapsed_time: 10m
    sending_queue:
      enabled: true
      num_consumers: 4
      queue_size: 5000

  # LOGS ONLY. Used by the syslog pipeline below. Safe to delete if you are not
  # collecting ESXi logs.
  otlphttp/openobserve_logs:
    endpoint: https://api.openobserve.ai/api/your_org_id
    headers:
      Authorization: "Basic ${env:O2_AUTH_TOKEN}"
      stream-name: vmware
    compression: gzip
    timeout: 30s
    retry_on_failure:
      enabled: true
      initial_interval: 5s
      max_interval: 60s
      max_elapsed_time: 10m
    sending_queue:
      enabled: true
      num_consumers: 4
      queue_size: 5000

  # Handy while validating, remove in production
  debug:
    verbosity: basic
    sampling_initial: 2
    sampling_thereafter: 100

extensions:
  health_check:
    endpoint: 127.0.0.1:13133

service:
  extensions: [health_check]
  pipelines:
    metrics/vmware:
      receivers: [vcenter]
      processors: [memory_limiter, resource, batch]
      exporters: [otlphttp/openobserve_metrics]
  telemetry:
    logs:
      level: info
    metrics:
      level: basic
      readers:
        - pull:
            exporter:
              prometheus:
                host: 127.0.0.1
                port: 8888
A few notes on the choices above:
collection_interval: 2mis a sane default. For very large vCenters with thousands of VMs, start at5mand confirm scrapes finish inside the interval.${env:...}substitution keeps secrets out of the file. Set them as machine-level environment variables so the service account can read them.- The
stream-nameheader names the target logs stream. Leaving it off the metrics exporter is intentional and required. - Do not leave both
debugand a production exporter on the same pipeline long term. The debug exporter is chatty.
Running the collector as a Windows service
Set secrets as machine environment variables
Run this in an elevated PowerShell so the service account can see them:
[System.Environment]::SetEnvironmentVariable("VCENTER_PASSWORD", "YourVCenterPassword", "Machine")
[System.Environment]::SetEnvironmentVariable("O2_AUTH_TOKEN", "PASTE_YOUR_BASE64_TOKEN_HERE", "Machine")
O2_AUTH_TOKEN holds only the base64 part. The config prefixes it with Basic .
Test run in the foreground first
Before creating the service, always dry-run:
$env:VCENTER_PASSWORD = "YourVCenterPassword"
$env:O2_AUTH_TOKEN = "PASTE_YOUR_BASE64_TOKEN_HERE"
C:\otelcol\otelcol-contrib.exe --config C:\otelcol\config.yaml
A healthy startup ends with Everything is ready. Begin running and processing data. The first vcenter scrape fires after initial_delay plus connection setup, so expect the first metric batch within one collection interval.
Create the service
New-Service -Name "otelcol-contrib" `
  -DisplayName "OpenTelemetry Collector Contrib" `
  -Description "Collects VMware vCenter metrics and ships to OpenObserve" `
  -BinaryPathName '"C:\otelcol\otelcol-contrib.exe" --config "C:\otelcol\config.yaml"' `
  -StartupType Automatic

Start-Service otelcol-contrib
Get-Service otelcol-contrib
If you installed via the MSI the service already exists, so just edit config.yaml and restart:
Restart-Service otelcol-contrib
Auto-restart on crash
sc.exe failure otelcol-contrib reset= 86400 actions= restart/5000/restart/10000/restart/30000
Where the collector's own logs go
Running as a service, the collector writes to the Windows Event Log, in the Application log under source otelcol-contrib:
Get-WinEvent -ProviderName "otelcol-contrib" -MaxEvents 50 | Format-List TimeCreated, Message
Firewall
Only needed if you enable the syslog receiver:
New-NetFirewallRule -DisplayName "OTel Syslog UDP 514" -Direction Inbound -Protocol UDP -LocalPort 514 -Action Allow
This is the same service pattern used for Windows host and event log monitoring, so if you already run a collector for Windows telemetry you can fold the vcenter receiver into that config instead of standing up a second one.
Optional: sending ESXi syslog to OpenObserve
The vcenter receiver is metrics only. For ESXi host logs, point each host's remote syslog at the same collector and add a logs pipeline.
Configure the ESXi hosts
On each host, under Host > Configure > System > Advanced System Settings:
Syslog.global.logHost=udp://<windows-collector-ip>:514
Then open the syslog firewall rule on the host under Configure > Firewall > Edit, or via esxcli:
esxcli system syslog config set --loghost='udp://<collector-ip>:514'
esxcli network firewall ruleset set --ruleset-id=syslog --enabled=true
esxcli system syslog reload
Add the pipeline to the collector
Note that this pipeline uses otlphttp/openobserve_logs, the exporter that carries the stream-name header. The metrics pipeline is unchanged and keeps using otlphttp/openobserve_metrics.
receivers:
  syslog:
    udp:
      listen_address: "0.0.0.0:514"
    protocol: rfc3164
    location: UTC
    operators:
      - type: add
        field: attributes.source
        value: esxi-syslog

service:
  pipelines:
    metrics/vmware:
      receivers: [vcenter]
      processors: [memory_limiter, resource, batch]
      exporters: [otlphttp/openobserve_metrics]

    logs/esxi:
      receivers: [syslog]
      processors: [memory_limiter, resource, batch]
      exporters: [otlphttp/openobserve_logs]
Logs land in OpenObserve under the stream named by the stream-name header, in this case vmware. To split logs into multiple named streams, define additional otlphttp exporters with different stream-name values and assign one per pipeline.
Which VMware metrics does the vcenter receiver emit?
Units follow OpenTelemetry conventions: By bytes, MiBy mebibytes, MHz megahertz, % percent, ms milliseconds, us microseconds, {KiBy/s} kibibytes per second.
Datacenter metrics (on by default)
| Metric | Unit | Type | Description | Attributes |
|---|---|---|---|---|
vcenter.datacenter.cluster.count |
{clusters} |
Sum | Number of clusters in the datacenter | status (red/yellow/green/gray) |
vcenter.datacenter.cpu.limit |
MHz |
Sum | Total CPU available to the datacenter | |
vcenter.datacenter.datastore.count |
{datastores} |
Sum | Number of datastores in the datacenter | |
vcenter.datacenter.disk.space |
By |
Sum | Available and used disk space | disk_state (available/used) |
vcenter.datacenter.host.count |
{hosts} |
Sum | Number of hosts in the datacenter | status, power_state |
vcenter.datacenter.memory.limit |
By |
Sum | Total memory available to the datacenter | |
vcenter.datacenter.vm.count |
{virtual_machines} |
Sum | Number of VMs in the datacenter | status, power_state |
Cluster metrics (on by default)
| Metric | Unit | Type | Description | Attributes |
|---|---|---|---|---|
vcenter.cluster.cpu.effective |
MHz |
Sum | Effective CPU available, excluding hosts in maintenance or unresponsive | |
vcenter.cluster.cpu.limit |
MHz |
Sum | Total CPU available to the cluster | |
vcenter.cluster.host.count |
{hosts} |
Sum | Number of hosts in the cluster | effective (bool) |
vcenter.cluster.memory.effective |
By |
Sum | Effective available memory | |
vcenter.cluster.memory.limit |
By |
Sum | Total available memory of the cluster | |
vcenter.cluster.vm.count |
{virtual_machines} |
Sum | Number of VMs in the cluster | power_state |
vcenter.cluster.vm_template.count |
{virtual_machine_templates} |
Sum | Number of VM templates | |
vcenter.cluster.vsan.congestions |
{congestions/s} |
Gauge | vSAN client IO congestions | |
vcenter.cluster.vsan.latency.avg |
us |
Gauge | Cluster latency accessing vSAN storage | type (read/write) |
vcenter.cluster.vsan.operations |
{operations/s} |
Gauge | vSAN IOPS of the cluster | type (read/write/unmap) |
vcenter.cluster.vsan.throughput |
By/s |
Gauge | vSAN throughput of the cluster | direction |
Host (ESXi) metrics (on by default)
| Metric | Unit | Type | Description | Attributes |
|---|---|---|---|---|
vcenter.host.cpu.capacity |
MHz |
Sum | Total CPU capacity of the host | |
vcenter.host.cpu.reserved |
MHz |
Sum | CPU reserved for VMs | cpu_reservation_type |
vcenter.host.cpu.usage |
MHz |
Sum | CPU used by the host | |
vcenter.host.cpu.utilization |
% |
Gauge | Host CPU utilization | |
vcenter.host.memory.usage |
MiBy |
Sum | Memory used by the host | |
vcenter.host.memory.utilization |
% |
Gauge | Host memory utilization | |
vcenter.host.disk.latency.avg |
ms |
Gauge | Device plus kernel read/write latency (needs Level 2) | direction, object |
vcenter.host.disk.latency.max |
ms |
Gauge | Highest latency across host disks, 20s window (needs Level 3) | object |
vcenter.host.disk.throughput |
{KiBy/s} |
Sum | Aggregated disk IO rate, 20s window (needs Level 4) | direction, object |
vcenter.host.network.usage |
{KiBy/s} |
Sum | Sum of tx and rx across all NICs | object |
vcenter.host.network.throughput |
{KiBy/s} |
Sum | Data transmitted and received, 20s window | direction, object |
vcenter.host.network.packet.rate |
{packets/s} |
Gauge | Packet rate per physical NIC, 20s window | direction, object |
vcenter.host.network.packet.error.rate |
{errors/s} |
Gauge | Packet error rate, 20s window | direction, object |
vcenter.host.network.packet.drop.rate |
{packets/s} |
Gauge | Packet drop rate per physical NIC, 20s window | direction, object |
vcenter.host.vsan.cache.hit_rate |
% |
Gauge | Read IOs served by local client cache, 5m window | |
vcenter.host.vsan.congestions |
{congestions/s} |
Gauge | vSAN client IO congestions on the host, 5m window | |
vcenter.host.vsan.latency.avg |
us |
Gauge | Host latency accessing vSAN storage, 5m window | type |
vcenter.host.vsan.operations |
{operations/s} |
Gauge | vSAN IOPS of the host, 5m window | type |
vcenter.host.vsan.throughput |
By/s |
Gauge | vSAN throughput of the host, 5m window | direction |
Virtual machine metrics (on by default)
| Metric | Unit | Type | Description | Attributes |
|---|---|---|---|---|
vcenter.vm.cpu.usage |
MHz |
Sum | CPU used by the VM | |
vcenter.vm.cpu.utilization |
% |
Gauge | VM CPU utilization | |
vcenter.vm.cpu.readiness |
% |
Gauge | Time the VM was ready but not scheduled on a physical CPU | |
vcenter.vm.memory.usage |
MiBy |
Sum | Memory used by the VM | |
vcenter.vm.memory.utilization |
% |
Gauge | VM memory utilization | |
vcenter.vm.memory.ballooned |
MiBy |
Sum | Memory ballooned due to virtualization | |
vcenter.vm.memory.swapped |
MiBy |
Sum | Memory granted from host swap space | |
vcenter.vm.memory.swapped_ssd |
KiBy |
Sum | Memory swapped to a fast device such as SSD | |
vcenter.vm.disk.usage |
By |
Sum | Storage used by the VM | disk_state |
vcenter.vm.disk.utilization |
% |
Gauge | Storage utilization on the VM | |
vcenter.vm.disk.latency.avg |
ms |
Gauge | Disk operation latency, 20s window (needs Level 2) | direction, disk_type, object |
vcenter.vm.disk.latency.max |
ms |
Gauge | Highest total latency over 20s | object |
vcenter.vm.disk.throughput |
{KiBy/s} |
Gauge | Virtual disk KiB/s, 20s window (needs Level 2) | direction, object |
vcenter.vm.network.usage |
{KiBy/s} |
Sum | Combined tx and rx rate, 20s window | object |
vcenter.vm.network.throughput |
By/s |
Sum | Data transmitted and received, 20s window | direction, object |
vcenter.vm.network.packet.rate |
{packets/s} |
Gauge | Packet rate per vNIC, 20s window | direction, object |
vcenter.vm.network.packet.drop.rate |
{packets/s} |
Gauge | Dropped packet rate per vNIC, 20s window | direction, object |
vcenter.vm.vsan.latency.avg |
us |
Gauge | VM latency accessing vSAN storage | type |
vcenter.vm.vsan.operations |
{operations/s} |
Gauge | vSAN IOPS of the VM | type |
vcenter.vm.vsan.throughput |
By/s |
Gauge | vSAN throughput of the VM | direction |
vcenter.vm.cpu.readiness deserves special mention. It is the single best early signal of CPU contention on an overcommitted cluster, and it shows up long before guest-level CPU metrics look unhealthy.
Resource pool metrics (on by default)
| Metric | Unit | Type | Description | Attributes |
|---|---|---|---|---|
vcenter.resource_pool.cpu.shares |
{shares} |
Sum | CPU shares in the resource pool | |
vcenter.resource_pool.cpu.usage |
MHz |
Sum | CPU used by the resource pool | |
vcenter.resource_pool.memory.shares |
{shares} |
Sum | Memory shares in the resource pool | |
vcenter.resource_pool.memory.usage |
MiBy |
Sum | Memory used by the resource pool | type, behind a feature gate |
vcenter.resource_pool.memory.ballooned |
MiBy |
Sum | Ballooned memory in the pool | |
vcenter.resource_pool.memory.granted |
MiBy |
Sum | Memory granted to VMs in the pool | type (private/shared) |
vcenter.resource_pool.memory.swapped |
MiBy |
Sum | Memory granted from host swap space |
Datastore metrics (on by default)
| Metric | Unit | Type | Description | Attributes |
|---|---|---|---|---|
vcenter.datastore.disk.usage |
By |
Sum | Space in the datastore | disk_state (available/used) |
vcenter.datastore.disk.utilization |
% |
Gauge | Datastore utilization |
Optional metrics (off by default)
| Metric | Unit | Type | Description | Attributes |
|---|---|---|---|---|
vcenter.host.memory.capacity |
MiBy |
Sum | Total memory capacity of the host | |
vcenter.vm.memory.granted |
MiBy |
Sum | Memory granted to a VM | |
vcenter.vm.cpu.time |
% |
Gauge | CPU time in idle, ready, or wait state, 20s window | cpu_state, object |
vcenter.vm.network.broadcast.packet.rate |
{packets/s} |
Gauge | Broadcast packet rate per vNIC, 20s window | direction, object |
vcenter.vm.network.multicast.packet.rate |
{packets/s} |
Gauge | Multicast packet rate per vNIC, 20s window | direction, object |
Enable any of these with:
receivers:
  vcenter:
    metrics:
      vcenter.host.memory.capacity:
        enabled: true
Disable any default metric the same way with enabled: false. That is the main lever for cutting cardinality on the object-attributed disk and network series in large fleets.
Resource attributes
Every series carries resource attributes identifying its scope. These become labels and dimensions in OpenObserve.
| Attribute | Description |
|---|---|
vcenter.datacenter.name |
Datacenter name |
vcenter.cluster.name |
Cluster name |
vcenter.host.name |
ESXi host name |
vcenter.datastore.name |
Datastore name |
vcenter.resource_pool.name |
Resource pool name |
vcenter.resource_pool.inventory_path |
Full inventory path of the pool |
vcenter.virtual_app.name |
vApp name |
vcenter.virtual_app.inventory_path |
vApp inventory path |
vcenter.vm.name |
VM name |
vcenter.vm.id |
VM instance UUID |
vcenter.vm_template.name |
VM template name |
vcenter.vm_template.id |
Template instance UUID |
On top of those you get whatever you upsert in the resource processor, which in the config above is service.name, deployment.environment, and vcenter.instance.
One naming detail that trips people up in queries: in OpenObserve, dots in attribute names are normalized to underscores. Query them as vcenter_vm_name and vcenter_host_name, not vcenter.vm.name.
How do you validate that metrics are actually arriving?
Work through these in order. The first three confirm the collector is healthy. The rest confirm OpenObserve is storing and displaying the data.
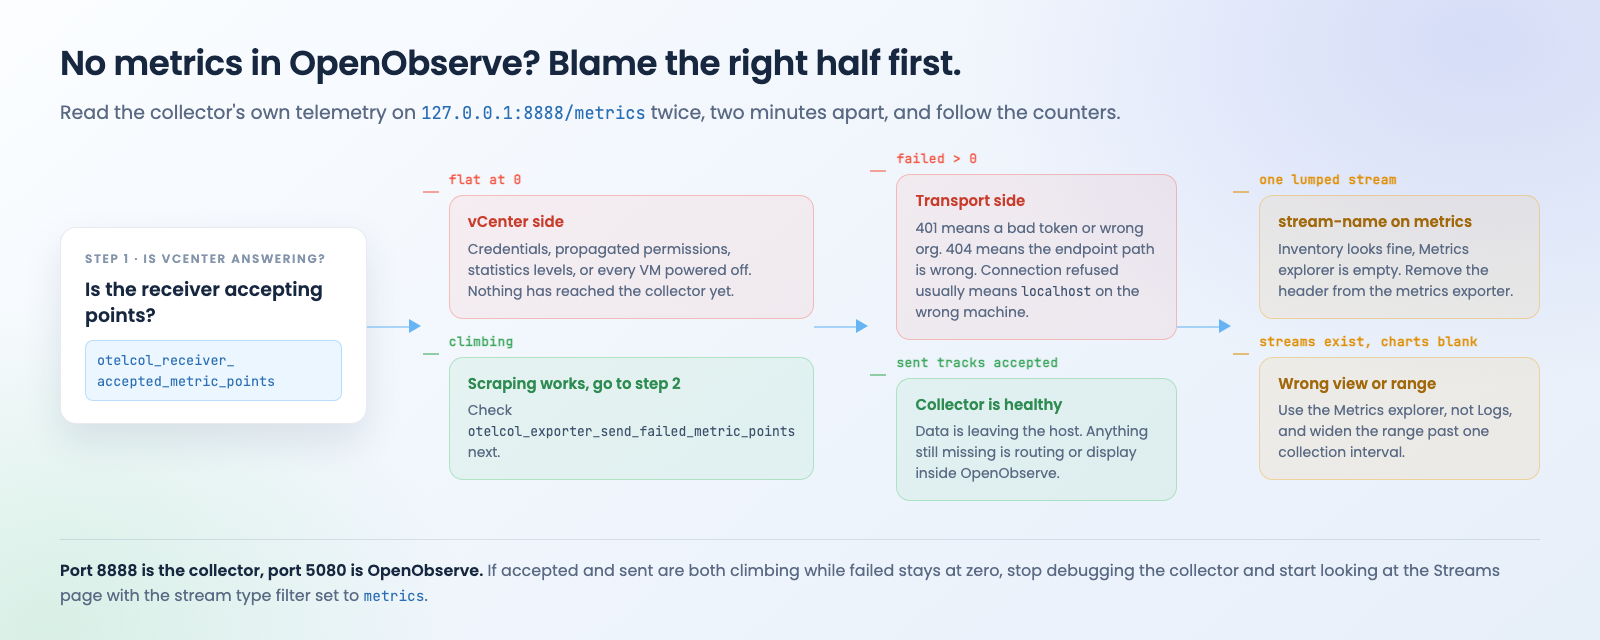
Collector side
1. Watch the foreground run, or the Event Log. Lines like Exporting failed are bad. Silence after startup is good, because the otlphttp exporter says nothing on success. The debug exporter prints Metrics {"resource metrics": N, "metrics": M, "data points": K} per batch.
2. Hit the health check endpoint.
Invoke-WebRequest http://127.0.0.1:13133/ | Select-Object StatusCode
3. Read the collector's own self-metrics. This is the single most useful check in the whole guide, because it sits upstream of OpenObserve and tells you which half of the pipeline to blame.
(Invoke-WebRequest http://127.0.0.1:8888/metrics).Content |
  Select-String "otelcol_receiver_accepted_metric_points|otelcol_exporter_sent_metric_points|otelcol_exporter_send_failed_metric_points|otelcol_scraper_errored_metric_points"
Run it twice, roughly two minutes apart, and compare:
| Reading | Meaning |
|---|---|
otelcol_receiver_accepted_metric_points climbing |
vCenter scraping works |
otelcol_receiver_accepted_metric_points flat at 0 |
The problem is on the vCenter side: credentials, permissions, statistics levels, or powered-off inventory |
otelcol_exporter_sent_metric_points tracking accepted |
Shipping to OpenObserve works |
otelcol_exporter_send_failed_metric_points above 0 |
Endpoint, auth, or network problem. Check the Event Log for the HTTP status |
otelcol_scraper_errored_metric_points above 0 |
Partial vCenter scrape failures, often permissions on a subset of objects |
Port 8888 is the collector's own telemetry endpoint, not OpenObserve. It is defined under service.telemetry.metrics in the config. Port 5080 is OpenObserve. If accepted and sent are both climbing and failed is flat at zero, the collector is doing its job and anything still missing is a display or routing problem in OpenObserve.
OpenObserve side
4. Check the Streams page, with the stream type filter set to metrics, not logs. You should see many streams, one per metric name: vcenter_host_cpu_usage, vcenter_vm_memory_utilization, and so on. OpenObserve converts OTLP metric names by replacing dots with underscores.
If instead you see a single stream, often named vmware, containing fields like vcenter_host_name and vcenter_cluster_name, your metrics are being written as one lumped stream. That is the stream-name header problem covered in the troubleshooting section below.
5. Query in the Metrics explorer, not the Logs view. Metrics and logs are separate areas of the UI. Browsing the Logs view will show you inventory attributes and never a metric chart. Set the time range to the last hour, then run:
vcenter_host_cpu_usage
6. Confirm with an aggregate.
topk(10, vcenter_vm_cpu_utilization)
Dashboards and queries worth building
PromQL examples for OpenObserve dashboard panels.
Capacity overview:
# Cluster CPU headroom (MHz)
vcenter_cluster_cpu_effective - scalar(sum(vcenter_host_cpu_usage))

# Cluster memory utilization %
100 * sum(vcenter_host_memory_usage) by (vcenter_cluster_name)
  / (sum(vcenter_cluster_memory_effective) by (vcenter_cluster_name) / 1024 / 1024)
Noisy neighbours and contention:
# Top 10 VMs by CPU readiness. Anything sustained above 5 percent hurts.
topk(10, vcenter_vm_cpu_readiness)

# VMs actively ballooning or swapping, which means memory pressure
vcenter_vm_memory_ballooned > 0
vcenter_vm_memory_swapped > 0
Storage:
# Datastores over 80 percent
vcenter_datastore_disk_utilization > 80

# Worst VM disk latency (read)
topk(10, vcenter_vm_disk_latency_avg{direction="read"})
Network health:
# Host NIC packet errors
sum(vcenter_host_network_packet_error_rate) by (vcenter_host_name, direction)

# VM packet drops
topk(10, vcenter_vm_network_packet_drop_rate)
Inventory tiles for stat panels:
sum(vcenter_datacenter_vm_count{power_state="on"})
sum(vcenter_datacenter_host_count)
sum(vcenter_cluster_vm_template_count)
A layout that works well in practice:
- Row 1: stat tiles for VMs on and off, hosts, clusters, datastores, templates.
- Row 2: cluster CPU and memory, effective versus usage, as time series.
- Row 3: top-N VM CPU readiness, VM CPU utilization, VM memory utilization.
- Row 4: datastore utilization bar gauge, VM disk latency top-N.
- Row 5: host network throughput, packet error and drop rates.
- Row 6 for vSAN shops: cluster vSAN IOPS, latency, congestion.
Once the dashboards are in place, the datastore utilization and VM CPU readiness panels are the two best candidates for alerts, since both degrade gradually and give you real lead time.
Troubleshooting
Inventory appears but no metrics
This is the most common failure by a wide margin, so it gets its own section.
Symptom. OpenObserve shows hosts, clusters, and datacenters by name, so data is clearly arriving, but the Metrics explorer is empty and no vcenter_* metric streams exist.
Cause. The stream-name header is present on the exporter used by the metrics pipeline. OpenObserve treats it as a directive to write into that one named stream, so every metric collapses into a single stream instead of one stream per metric name. Resource attributes such as vcenter_host_name stay visible as fields, which is exactly why the inventory looks healthy.
Fix.
- Open
C:\otelcol\config.yamland remove or comment out thestream-nameline from the exporter used bymetrics/vmware. Better still, split into the two exporters shown earlier. - Validate and restart:
C:\otelcol\otelcol-contrib.exe validate --config C:\otelcol\config.yaml
Restart-Service otelcol-contrib
- Wait one full
collection_interval, which is 2 minutes with the config above. - Go to Streams, filter by stream type metrics, and confirm individual
vcenter_*streams now appear.
The old lumped stream stays behind and can be deleted from the Streams page once the new ones are populating.
If that is not it, the other explanation for the same symptom is that inventory metrics are arriving while performance counters are not. Inventory and capacity come from the vCenter configuration API, whereas CPU, memory, disk, and network come from performance counters. Check statistics levels, confirm VMs are powered on, and confirm hosts are connected and out of maintenance mode.
General reference
| Symptom | Cause | Fix |
|---|---|---|
| Inventory names visible, Metrics explorer empty | stream-name header applied to metrics |
See the section above |
| Data visible under Logs but nothing under Metrics | Looking in the wrong area of the UI | Metrics live in the Metrics explorer, and under stream type metrics on the Streams page |
x509: certificate signed by unknown authority at startup |
Self-signed vCenter certificate | Add ca_file with the vCenter CA, or insecure_skip_verify: true for testing |
ServerFaultCode: Cannot complete login due to an incorrect user name or password |
Bad credentials or SSO domain mismatch | Use the full UPN (user@vsphere.local), and verify the env var is visible to the service at machine scope, then restart |
ServerFaultCode: Permission to perform this operation was denied |
Role not propagated | Re-add Read-only at the top level with Propagate to children |
| Scrape works but disk latency and throughput metrics are absent | vCenter statistics level too low | Raise the level per the statistics table above |
| Some VMs have counts but no CPU or memory series | VMs powered off | Expected. Performance counters only exist for running VMs |
| A whole cluster shows names but no performance data | Hosts in maintenance mode or disconnected | Check host connection state in the vSphere Client |
context deadline exceeded in scraper errors |
Large inventory, scrape slower than the timeout | Raise timeout, raise collection_interval |
| Nothing in OpenObserve, exporter logs 401 | Wrong Basic token, or wrong org in the URL | Regenerate the token from the ingestion page, confirm the org segment in the endpoint |
| Exporter logs 404 | Endpoint path wrong, missing /api/<org> or /v1/metrics appended manually |
Set only the base /api/<org> path. The exporter appends signal paths itself |
| Connection refused reaching OpenObserve | localhost used but OpenObserve is on another machine |
Use the real hostname or IP in the exporter endpoint |
| Metrics visible but names differ from the docs | OpenObserve normalizes dots to underscores | Query vcenter_vm_cpu_usage, not vcenter.vm.cpu.usage |
| Metrics exist but charts are blank | Time range shorter than the collection interval | Widen the Metrics explorer range to at least the last hour |
| Service starts then stops immediately | Config parse error | Run otelcol-contrib.exe validate --config C:\otelcol\config.yaml |
| Env vars not resolving under the service | Set at user scope, or the service started before the vars existed | Set at machine scope and Restart-Service otelcol-contrib |
| High memory on the collector | Huge VM count with per-object disk and network attributes | Disable high-cardinality metrics, or filter with the filter processor |
| UDP syslog arrives but timestamps are wrong | ESXi sends local time, the receiver assumes UTC | Set location in the syslog receiver to the host timezone |
Validate any config change before restarting the service:
C:\otelcol\otelcol-contrib.exe validate --config C:\otelcol\config.yaml
Tuning for large environments
Interval versus inventory size. Each scrape enumerates every datacenter, cluster, host, resource pool, VM, and datastore. As a rough guide: under 500 VMs, 2m is fine. Between 500 and 2000 VMs, use 3m to 5m with timeout: 120s. Beyond that, 5m or more, and consider splitting per datacenter with multiple vcenter/<name> receiver instances, or one collector per vCenter.
Cardinality control. The biggest series multipliers are the object attribute, meaning per-disk and per-NIC, on the latency, throughput, and packet metrics. Disabling vcenter.vm.disk.latency.avg, vcenter.vm.network.packet.rate, and their host equivalents cuts datapoint volume dramatically if you only need capacity views.
Batching. Keep send_batch_size at 8192 or above. OpenObserve ingests OTLP efficiently in larger batches, and gzip compression on the exporter typically shrinks payloads by 8 to 10 times.
Multiple vCenters. Define one receiver per vCenter and tag each with the resource processor:
receivers:
  vcenter/dc1:
    endpoint: https://vcenter-dc1.company.local
    username: otel-monitor@vsphere.local
    password: ${env:VCENTER_DC1_PASSWORD}
    collection_interval: 3m
  vcenter/dc2:
    endpoint: https://vcenter-dc2.company.local
    username: otel-monitor@vsphere.local
    password: ${env:VCENTER_DC2_PASSWORD}
    collection_interval: 3m

service:
  pipelines:
    metrics/vmware:
      receivers: [vcenter/dc1, vcenter/dc2]
      processors: [memory_limiter, resource, batch]
      exporters: [otlphttp/openobserve_metrics]
Upgrades. Pin the collector version in your download script, read the vcenter receiver changelog before jumping versions, since metric names and attributes have shifted between releases historically, and always run validate after upgrading.
Quick reference
Binary:        C:\otelcol\otelcol-contrib.exe
Config:        C:\otelcol\config.yaml
Service:       otelcol-contrib (Automatic)
Health:        http://127.0.0.1:13133/
Self-metrics:  http://127.0.0.1:8888/metrics   (the collector's own telemetry)
Validate:      otelcol-contrib.exe validate --config C:\otelcol\config.yaml
Logs:          Windows Event Log > Application > otelcol-contrib
vCenter user:  otel-monitor@vsphere.local (Read-only, propagated)
O2 endpoint:   https://api.openobserve.ai/api/<org>  (cloud)
               http://<host>:5080/api/<org>          (self-hosted, default org is "default")
Auth header:   Authorization: Basic base64(email:token)
Metric naming: vcenter.vm.cpu.usage becomes vcenter_vm_cpu_usage in OpenObserve
stream-name:   Logs exporter only. Never on the metrics exporter.
Where to look: Metrics explorer for metrics, Logs view for syslog. The Streams
               page has a stream type filter, set it to "metrics".
Wrapping up
The VMware side of this is genuinely simple once the read-only user and statistics levels are right, and the collector side is a single YAML file. The part that costs people an afternoon is the exporter header, so if you take one thing away, take this: stream-name belongs on the logs exporter and nowhere near metrics.
OpenObserve is open source under AGPL-3.0, so you can run this whole pipeline self-hosted with no per-host licensing, which matters when you are monitoring a few thousand VMs. If you want to extend the same collector to other infrastructure, the OpenTelemetry integration guides cover the other receivers, and SNMP monitoring with OpenTelemetry is a good next step for the network gear sitting underneath your vSphere clusters.
Frequently Asked Questions
About the Author
Chaitanya Sistla

Chaitanya Sistla is a Principal Solutions Architect with 17X certifications across Cloud, Data, DevOps, and Cybersecurity. Leveraging extensive startup experience and a focus on MLOps, Chaitanya excels at designing scalable, innovative solutions that drive operational excellence and business transformation.
Follow OpenObserve on Google
Add OpenObserve as a preferred source to see more of our articles in Google Search and Top Stories.











