Monitoring CockroachDB Cluster with OpenObserve




Ready to get started?
Try OpenObserve Cloud today for more efficient and performant observability.

CockroachDB provides detailed metrics for SQL performance, storage, replication, and node health. In this guide, we will collect those metrics with Prometheus, send them to OpenObserve, and visualize them with ready-to-use CockroachDB dashboards.
You do not need prior experience with CockroachDB, Prometheus, or OpenObserve to follow this guide. Every command is written out in full, and each step explains what it does and why before you run it.
We will create a three-node CockroachDB cluster using Docker Compose. A cluster here just means several CockroachDB instances, called nodes, working together as one database. The same monitoring pipeline also works for a single, standalone CockroachDB server. For a standalone deployment, Prometheus watches one node instead of every node in the cluster.
At a high level, three pieces of software are involved, and each one has a single job:
- CockroachDB is the database. Each of its three nodes publishes a live page of its own internal metrics.
- Prometheus is the metrics collector. On a timer, it visits that page on every node and copies down the numbers, a process usually called "scraping."
- OpenObserve is where those numbers end up. Prometheus forwards, or "remote writes," everything it scrapes to OpenObserve, where you can query it and view it on dashboards.
That flow looks like this:
CockroachDB exposes Prometheus-compatible metrics from its built-in /_status/vars endpoint, so you do not need to install a separate exporter, a small helper program some databases require to make their metrics Prometheus-readable. CockroachDB does that translation itself.
Prerequisites
You need Docker with the Compose plugin installed. Docker Compose is a tool that starts several containers together from one configuration file, which is exactly what we need here: three database nodes plus Prometheus and OpenObserve. If docker compose version runs without an error in your terminal, you're ready.
You'll also need the following ports free on your machine, since each service listens on one of these:
5080for OpenObserve8080for the CockroachDB DB Console9090for Prometheus26257for CockroachDB SQL connections
This setup uses CockroachDB's insecure mode, which skips certificate setup and authentication so the example stays short. It is meant for local learning only. Do not use insecure mode for a production cluster.
1. Create the Docker Compose environment
Create a directory for the example and add the following docker-compose.yml file. It defines five containers: three CockroachDB nodes that will form the cluster, one OpenObserve container to store and visualize the metrics, and one Prometheus container to move data between them. Docker Compose starts all five with a single command, so you won't be running any of these by hand.
services:
  cockroach1:
    image: cockroachdb/cockroach:v24.3.10
    hostname: cockroach1
    command: >
      start --insecure
      --join=cockroach1,cockroach2,cockroach3
      --advertise-addr=cockroach1
      --http-addr=0.0.0.0:8080
    ports:
      - "26257:26257"
      - "8080:8080"
    volumes:
      - cockroach1-data:/cockroach/cockroach-data

  cockroach2:
    image: cockroachdb/cockroach:v24.3.10
    hostname: cockroach2
    command: >
      start --insecure
      --join=cockroach1,cockroach2,cockroach3
      --advertise-addr=cockroach2
      --http-addr=0.0.0.0:8080
    volumes:
      - cockroach2-data:/cockroach/cockroach-data

  cockroach3:
    image: cockroachdb/cockroach:v24.3.10
    hostname: cockroach3
    command: >
      start --insecure
      --join=cockroach1,cockroach2,cockroach3
      --advertise-addr=cockroach3
      --http-addr=0.0.0.0:8080
    volumes:
      - cockroach3-data:/cockroach/cockroach-data

  openobserve:
    image: o2cr.ai/openobserve/openobserve-enterprise:v1.0.0
    environment:
      ZO_ROOT_USER_EMAIL: root@example.com
      ZO_ROOT_USER_PASSWORD: replace-with-a-strong-password
      ZO_DATA_DIR: /data
    ports:
      - "5080:5080"
    volumes:
      - openobserve-data:/data

  prometheus:
    image: prom/prometheus:v3.5.0
    command:
      - --config.file=/etc/prometheus/prometheus.yml
    ports:
      - "9090:9090"
    volumes:
      - ./prometheus.yml:/etc/prometheus/prometheus.yml:ro
      - prometheus-data:/prometheus
    depends_on:
      - cockroach1
      - cockroach2
      - cockroach3
      - openobserve

volumes:
  cockroach1-data:
  cockroach2-data:
  cockroach3-data:
  openobserve-data:
  prometheus-data:
Use a stronger password for anything beyond a temporary local environment.
A quick look at what each service does:
cockroach1,cockroach2,cockroach3are the three database nodes. The--joinflag tells each one about the other two so they can form a single cluster instead of three separate databases.openobserveis where metrics will live once collected.ZO_ROOT_USER_EMAILandZO_ROOT_USER_PASSWORDset the login you'll use to open its web interface. This is the same single-binary build covered in the OpenObserve quickstart, just run here via Docker Compose instead of as a standalone binary.prometheusreads its own configuration fromprometheus.yml, a file we'll create next. It won't start correctly until that file exists.
2. Configure Prometheus
Prometheus needs to be told two things: where to collect metrics from, and where to send them once collected. Those two jobs are called scrape_configs and remote_write, and they map directly onto the two arrows in the diagram above.
Create prometheus.yml in the same directory:
global:
  scrape_interval: 15s

scrape_configs:
  - job_name: cockroachdb-cluster
    metrics_path: /_status/vars
    static_configs:
      - targets:
          - cockroach1:8080
          - cockroach2:8080
          - cockroach3:8080

remote_write:
  - url: http://openobserve:5080/api/default/prometheus/api/v1/write
    basic_auth:
      username: root@example.com
      password: replace-with-a-strong-password
Reading this file top to bottom: scrape_configs tells Prometheus to visit /_status/vars on all three CockroachDB nodes every 15 seconds (scrape_interval: 15s) and pull down whatever metrics it finds there. remote_write then tells Prometheus to immediately forward everything it just collected to OpenObserve's API, authenticating with the same username and password you set for OpenObserve in docker-compose.yml.
The credentials must match the OpenObserve values in docker-compose.yml. The default part of the remote-write URL is the OpenObserve organization name, essentially a namespace for your data. See the Prometheus remote write ingestion docs for more configuration options.
The cockroachdb-cluster job name is important because the cluster dashboard uses it in its PromQL queries later. If you choose another name, update the dashboard's job filters after importing it.
3. Start and initialize the cluster
With both files in place, start all five containers:
docker compose up -d
The -d flag runs everything in the background ("detached") so your terminal stays free. Give it a few seconds, and you can check that all five containers are running with docker compose ps.

CockroachDB nodes don't automatically know they should form a cluster; you have to tell them once. Run this against any one of the three nodes:
docker compose exec cockroach1 \
  cockroach init --insecure --host=cockroach1:26257
This is a one-time step. Once the cluster is initialized, all three nodes stay joined together even if you restart the containers later.
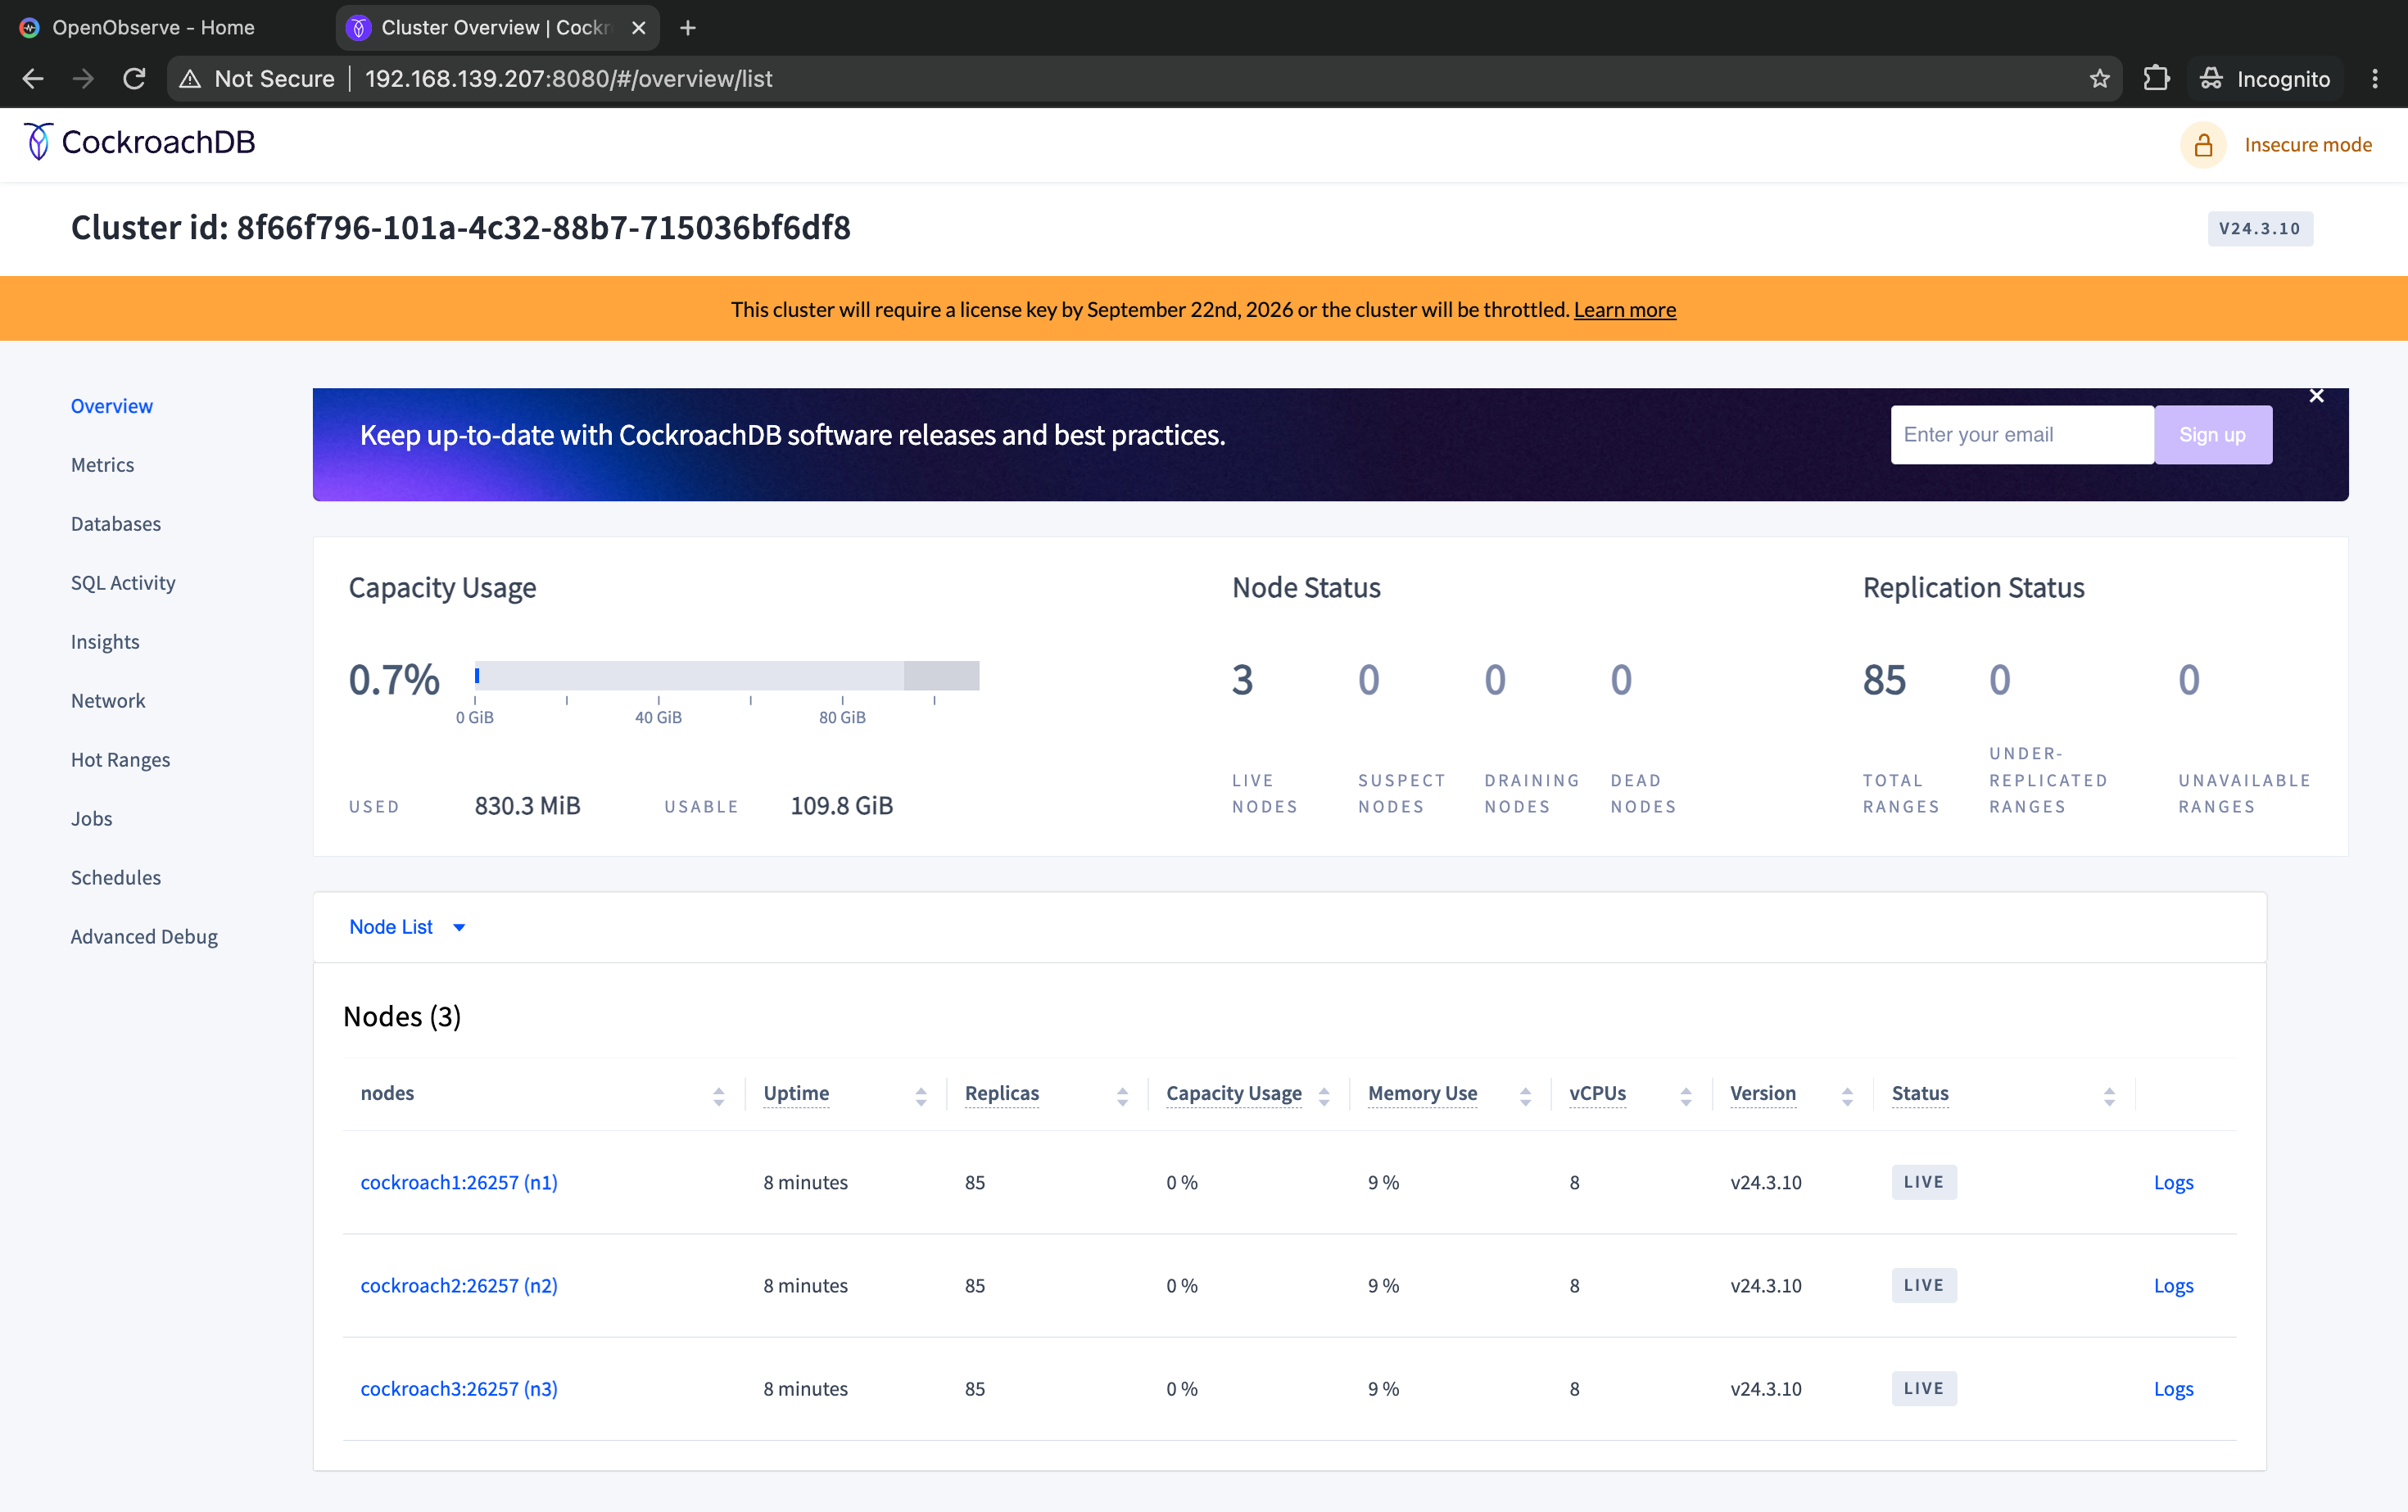
Open the CockroachDB DB Console at http://localhost:8080 in your browser. The cluster overview should show three live nodes, which confirms the cluster came up correctly.
You can also confirm that CockroachDB is exposing metrics by opening:
http://localhost:8080/_status/vars
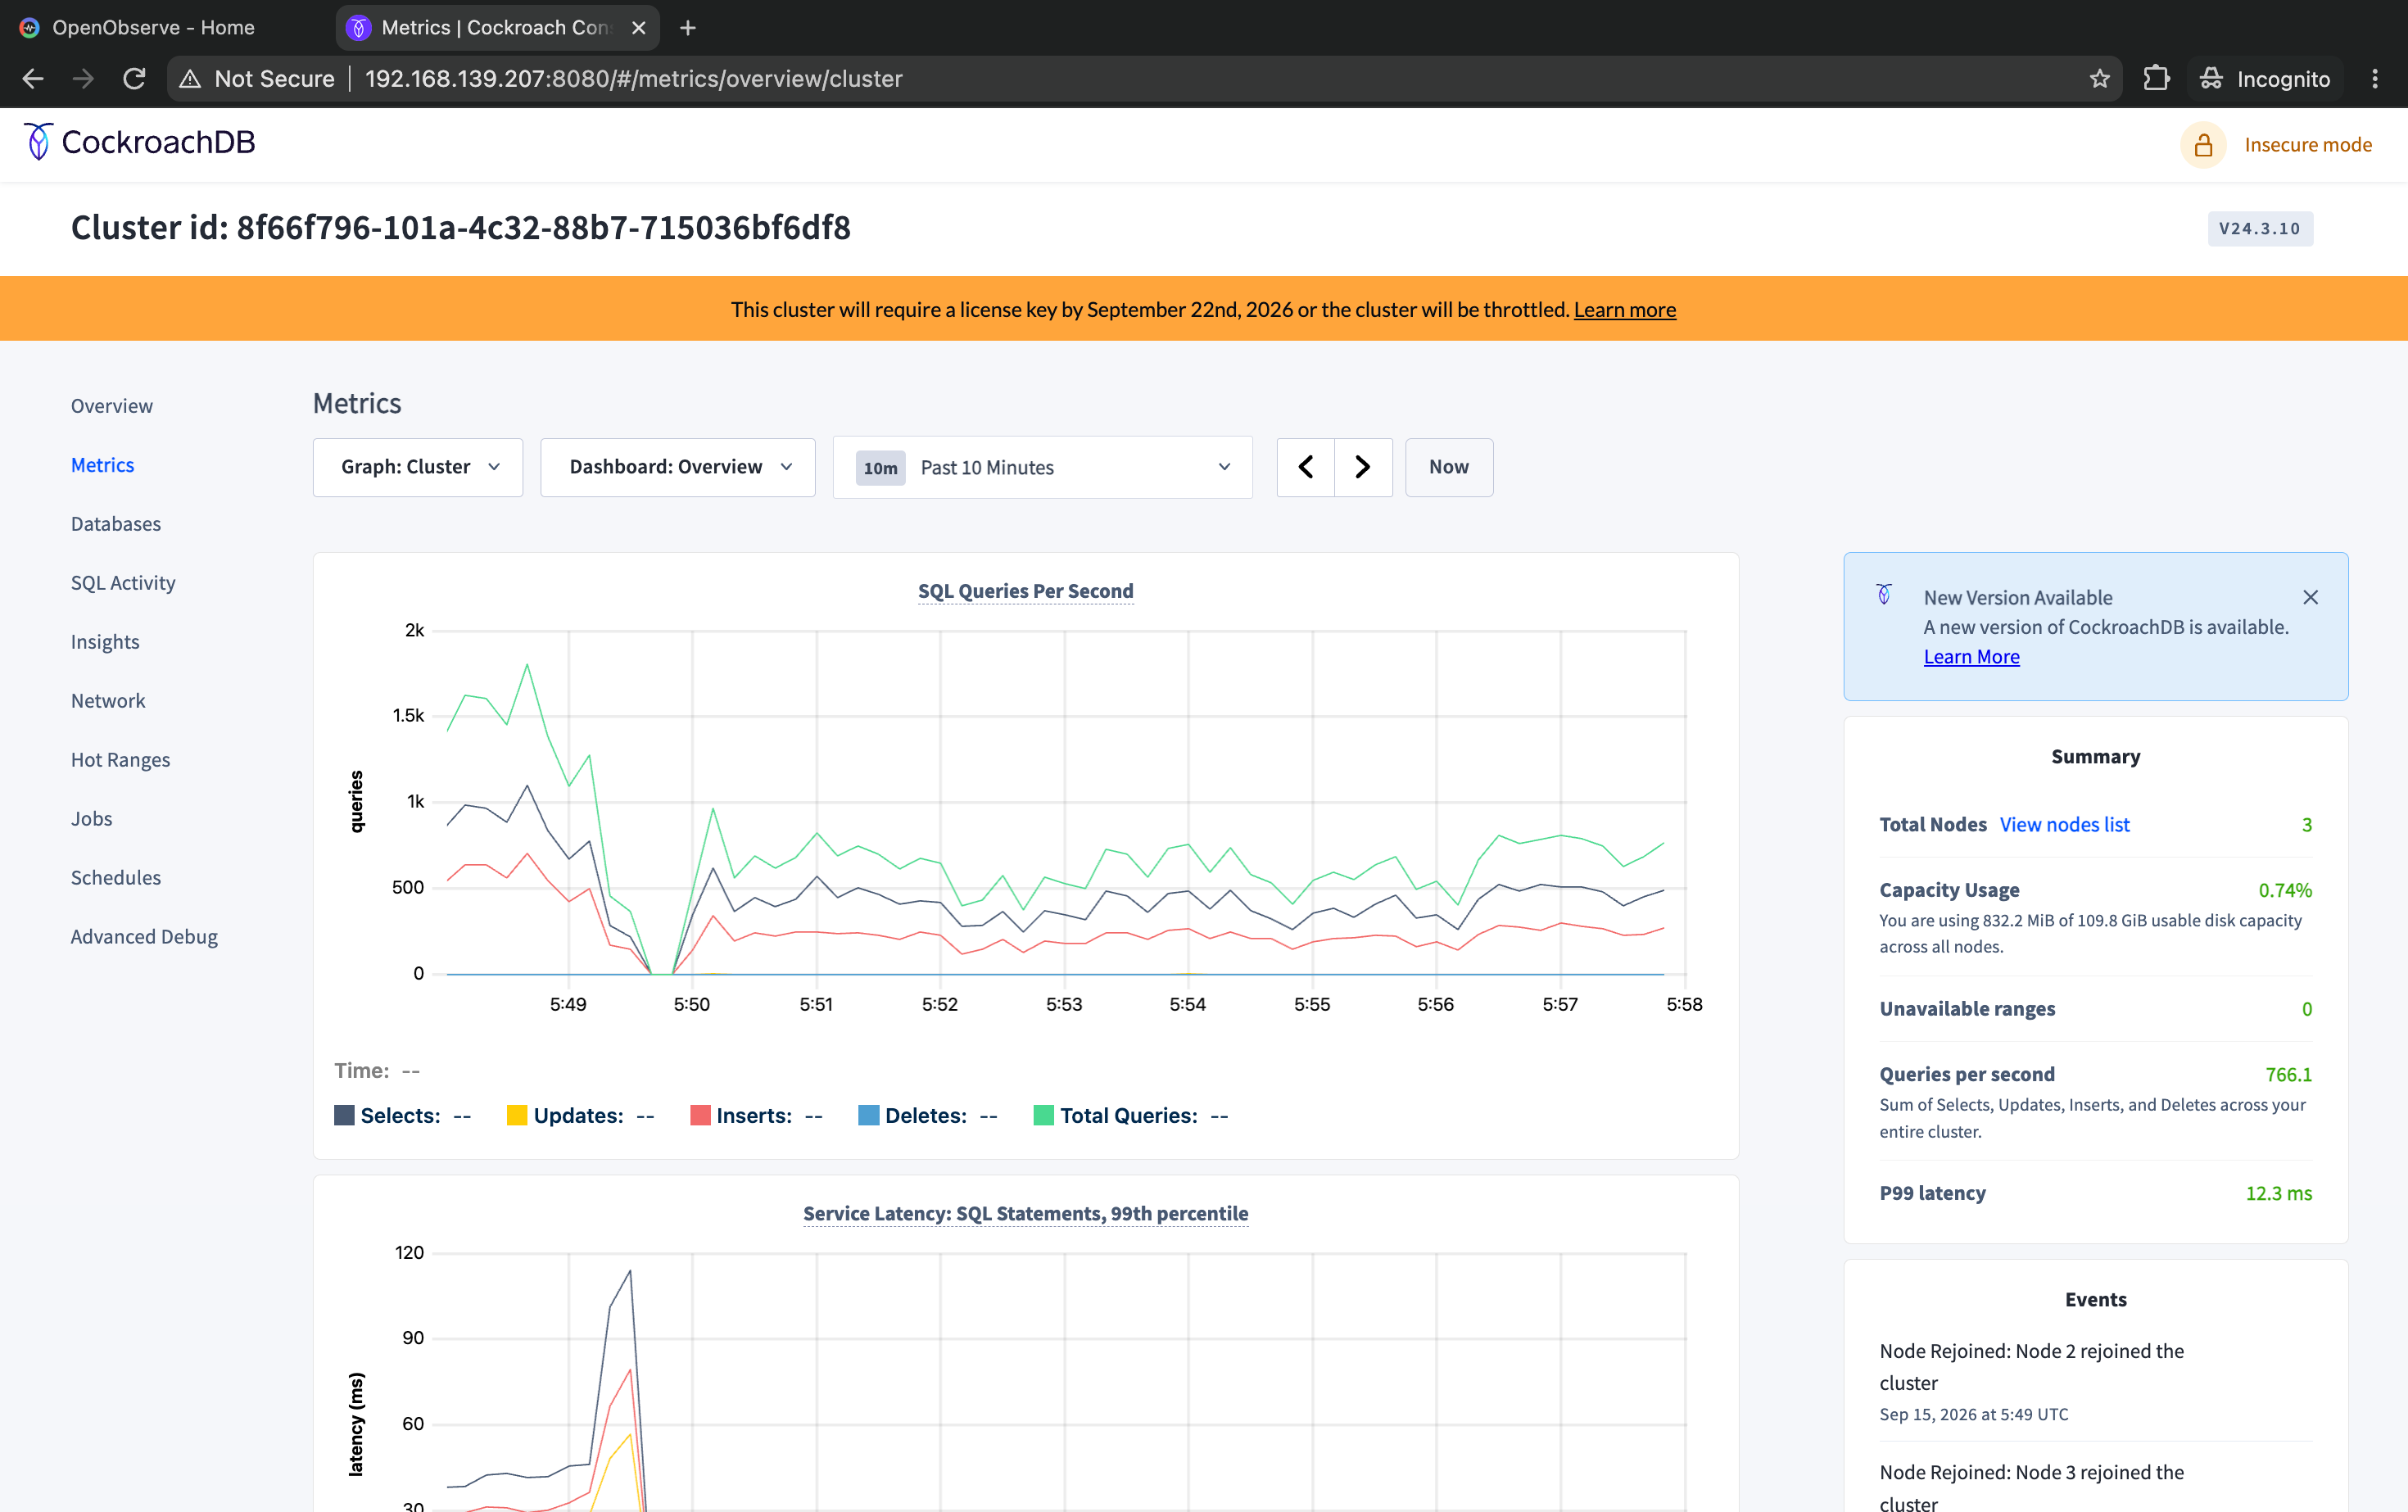
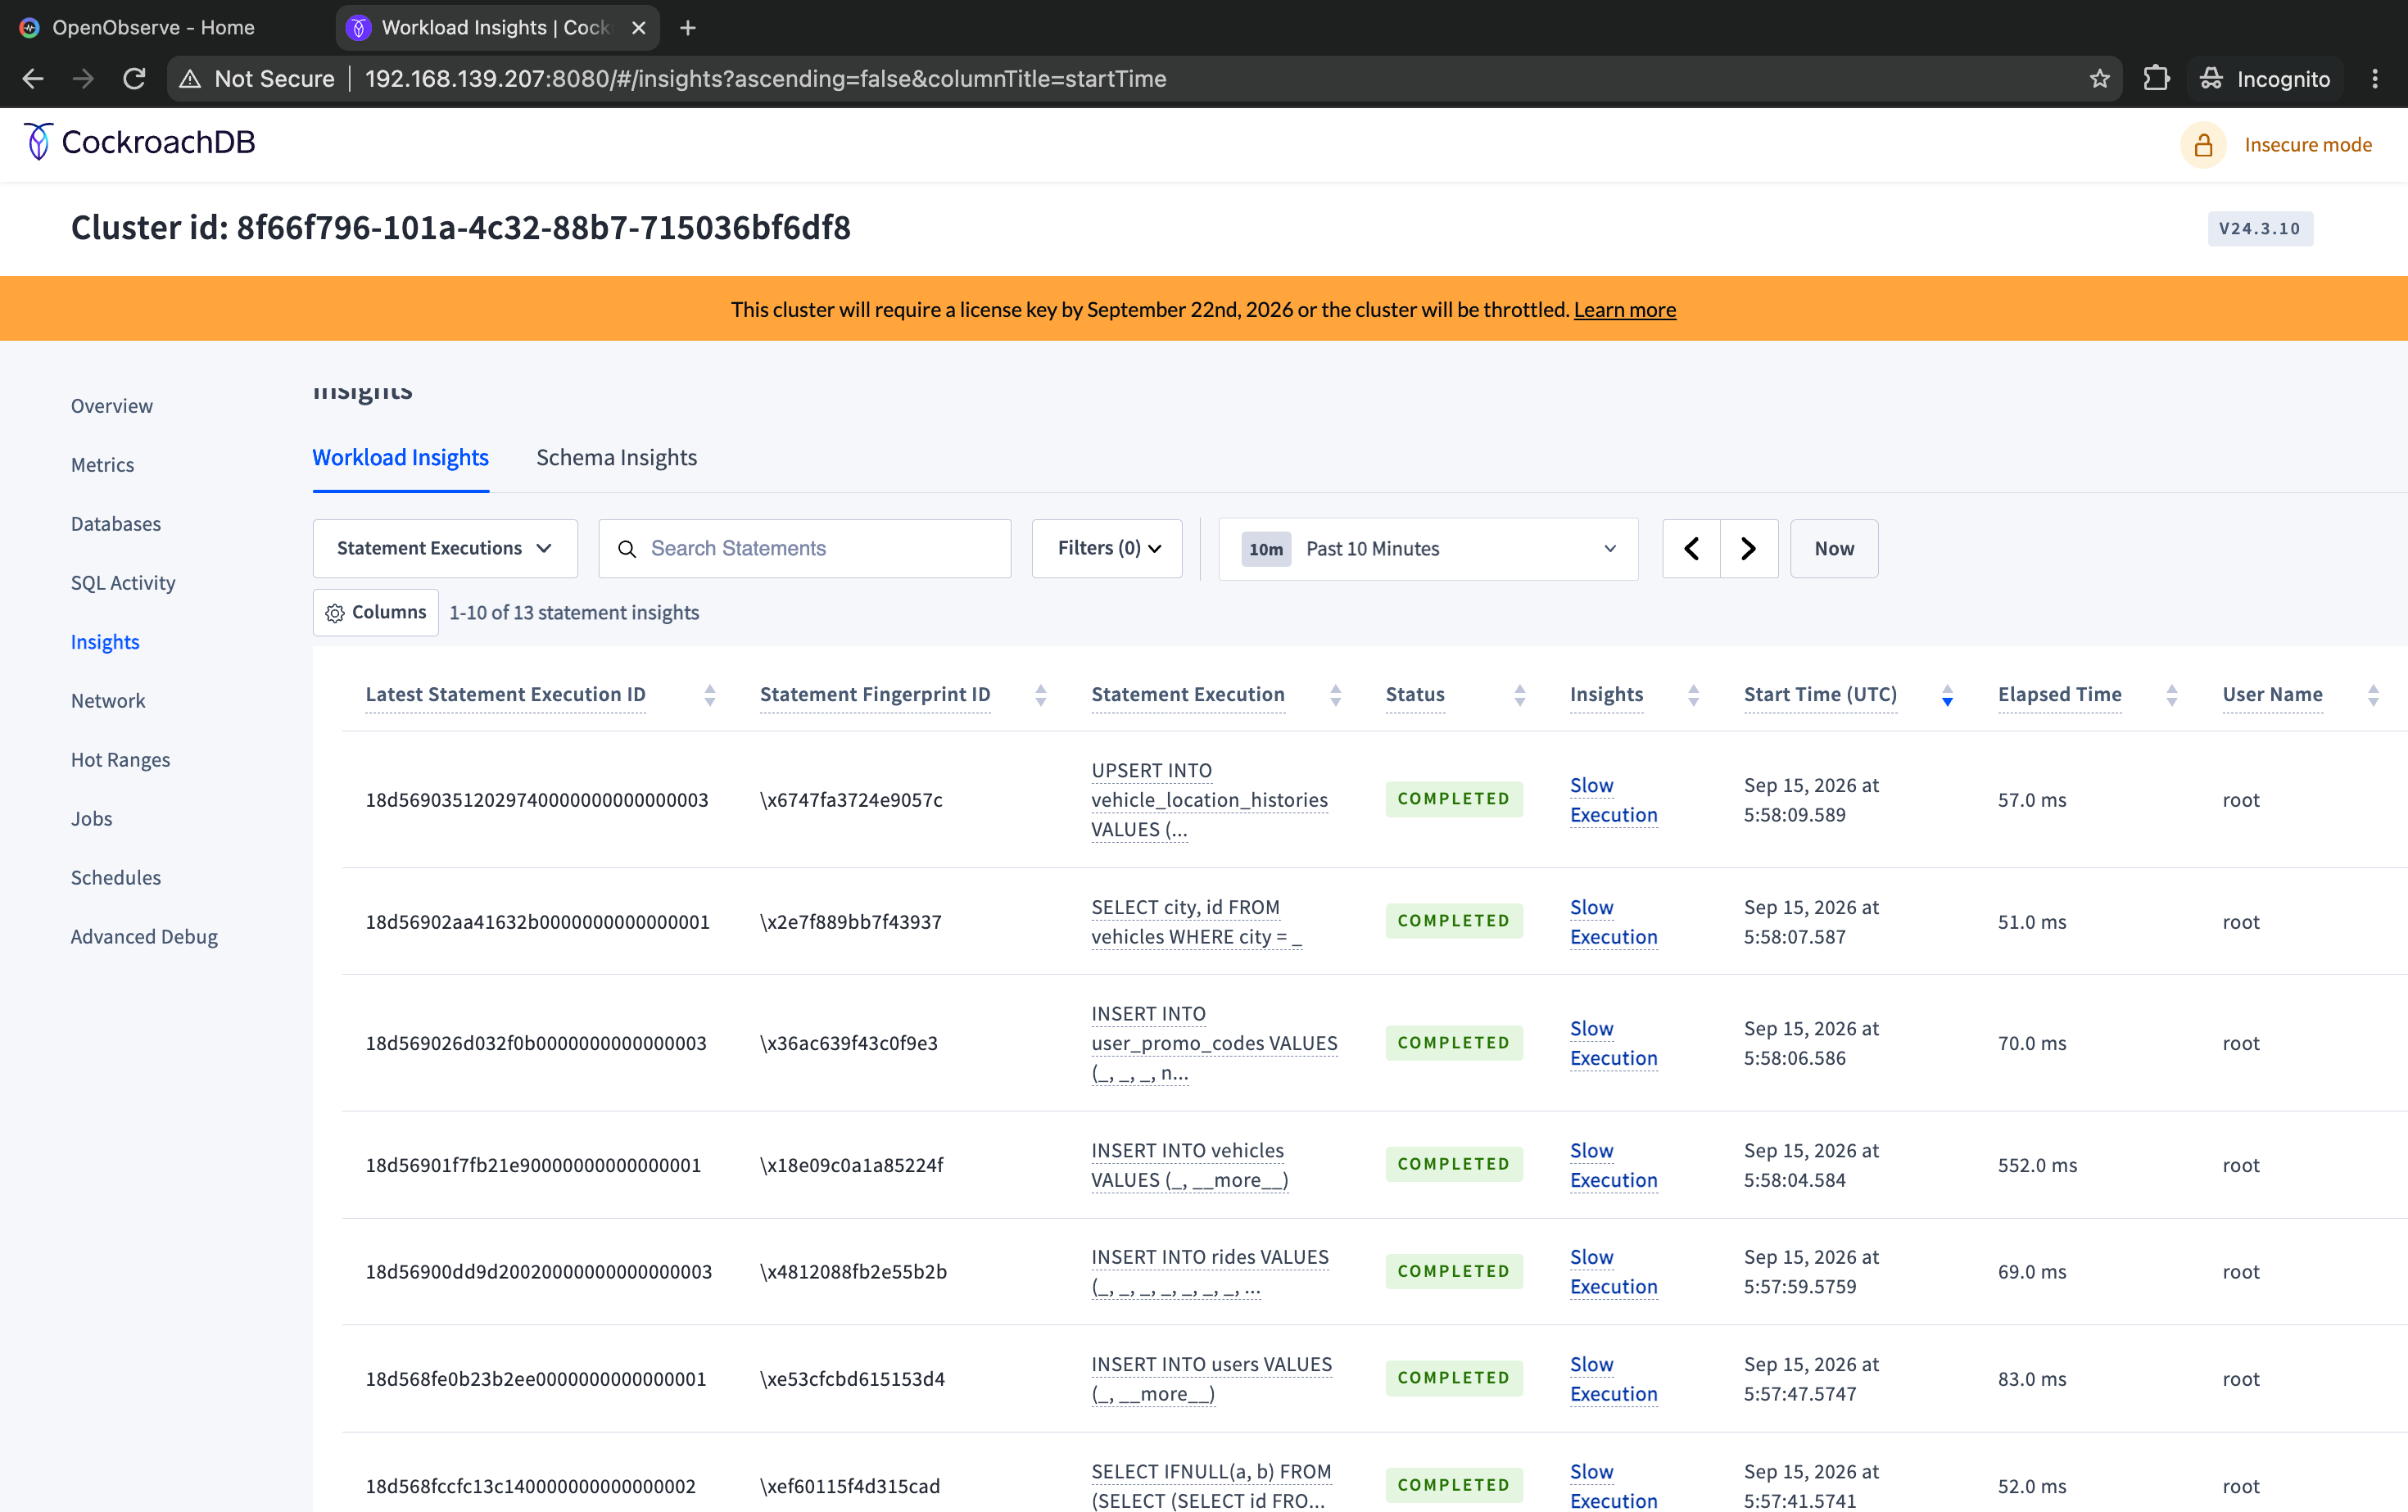
The response contains metrics such as sql_query_count, liveness_livenodes, ranges_underreplicated, and capacity_used.
4. Generate sample activity
An idle cluster still produces system metrics like memory and disk usage, but the SQL charts on the dashboard stay flat with nothing to show unless the database is actually handling queries. CockroachDB ships with a few built-in sample workloads for exactly this reason. movr simulates a ride-sharing app and is safe to run against a throwaway cluster like this one; it doesn't touch anything outside this Docker Compose environment.
Initialize and run the movr workload:
docker compose exec cockroach1 \
  cockroach workload init movr \
  'postgresql://root@cockroach1:26257/defaultdb?sslmode=disable'

docker compose exec -d cockroach1 \
  cockroach workload run movr --concurrency=8 \
  'postgresql://root@cockroach1:26257/defaultdb?sslmode=disable'
Prometheus will scrape each node every 15 seconds and forward the samples to OpenObserve.
5. Verify metrics in OpenObserve
Before checking OpenObserve, confirm Prometheus itself can see all three nodes. Open the Prometheus targets page at http://localhost:9090/targets. All three targets in the cockroachdb-cluster job should show as UP. If any show DOWN, fix that first, since nothing downstream will have data otherwise.
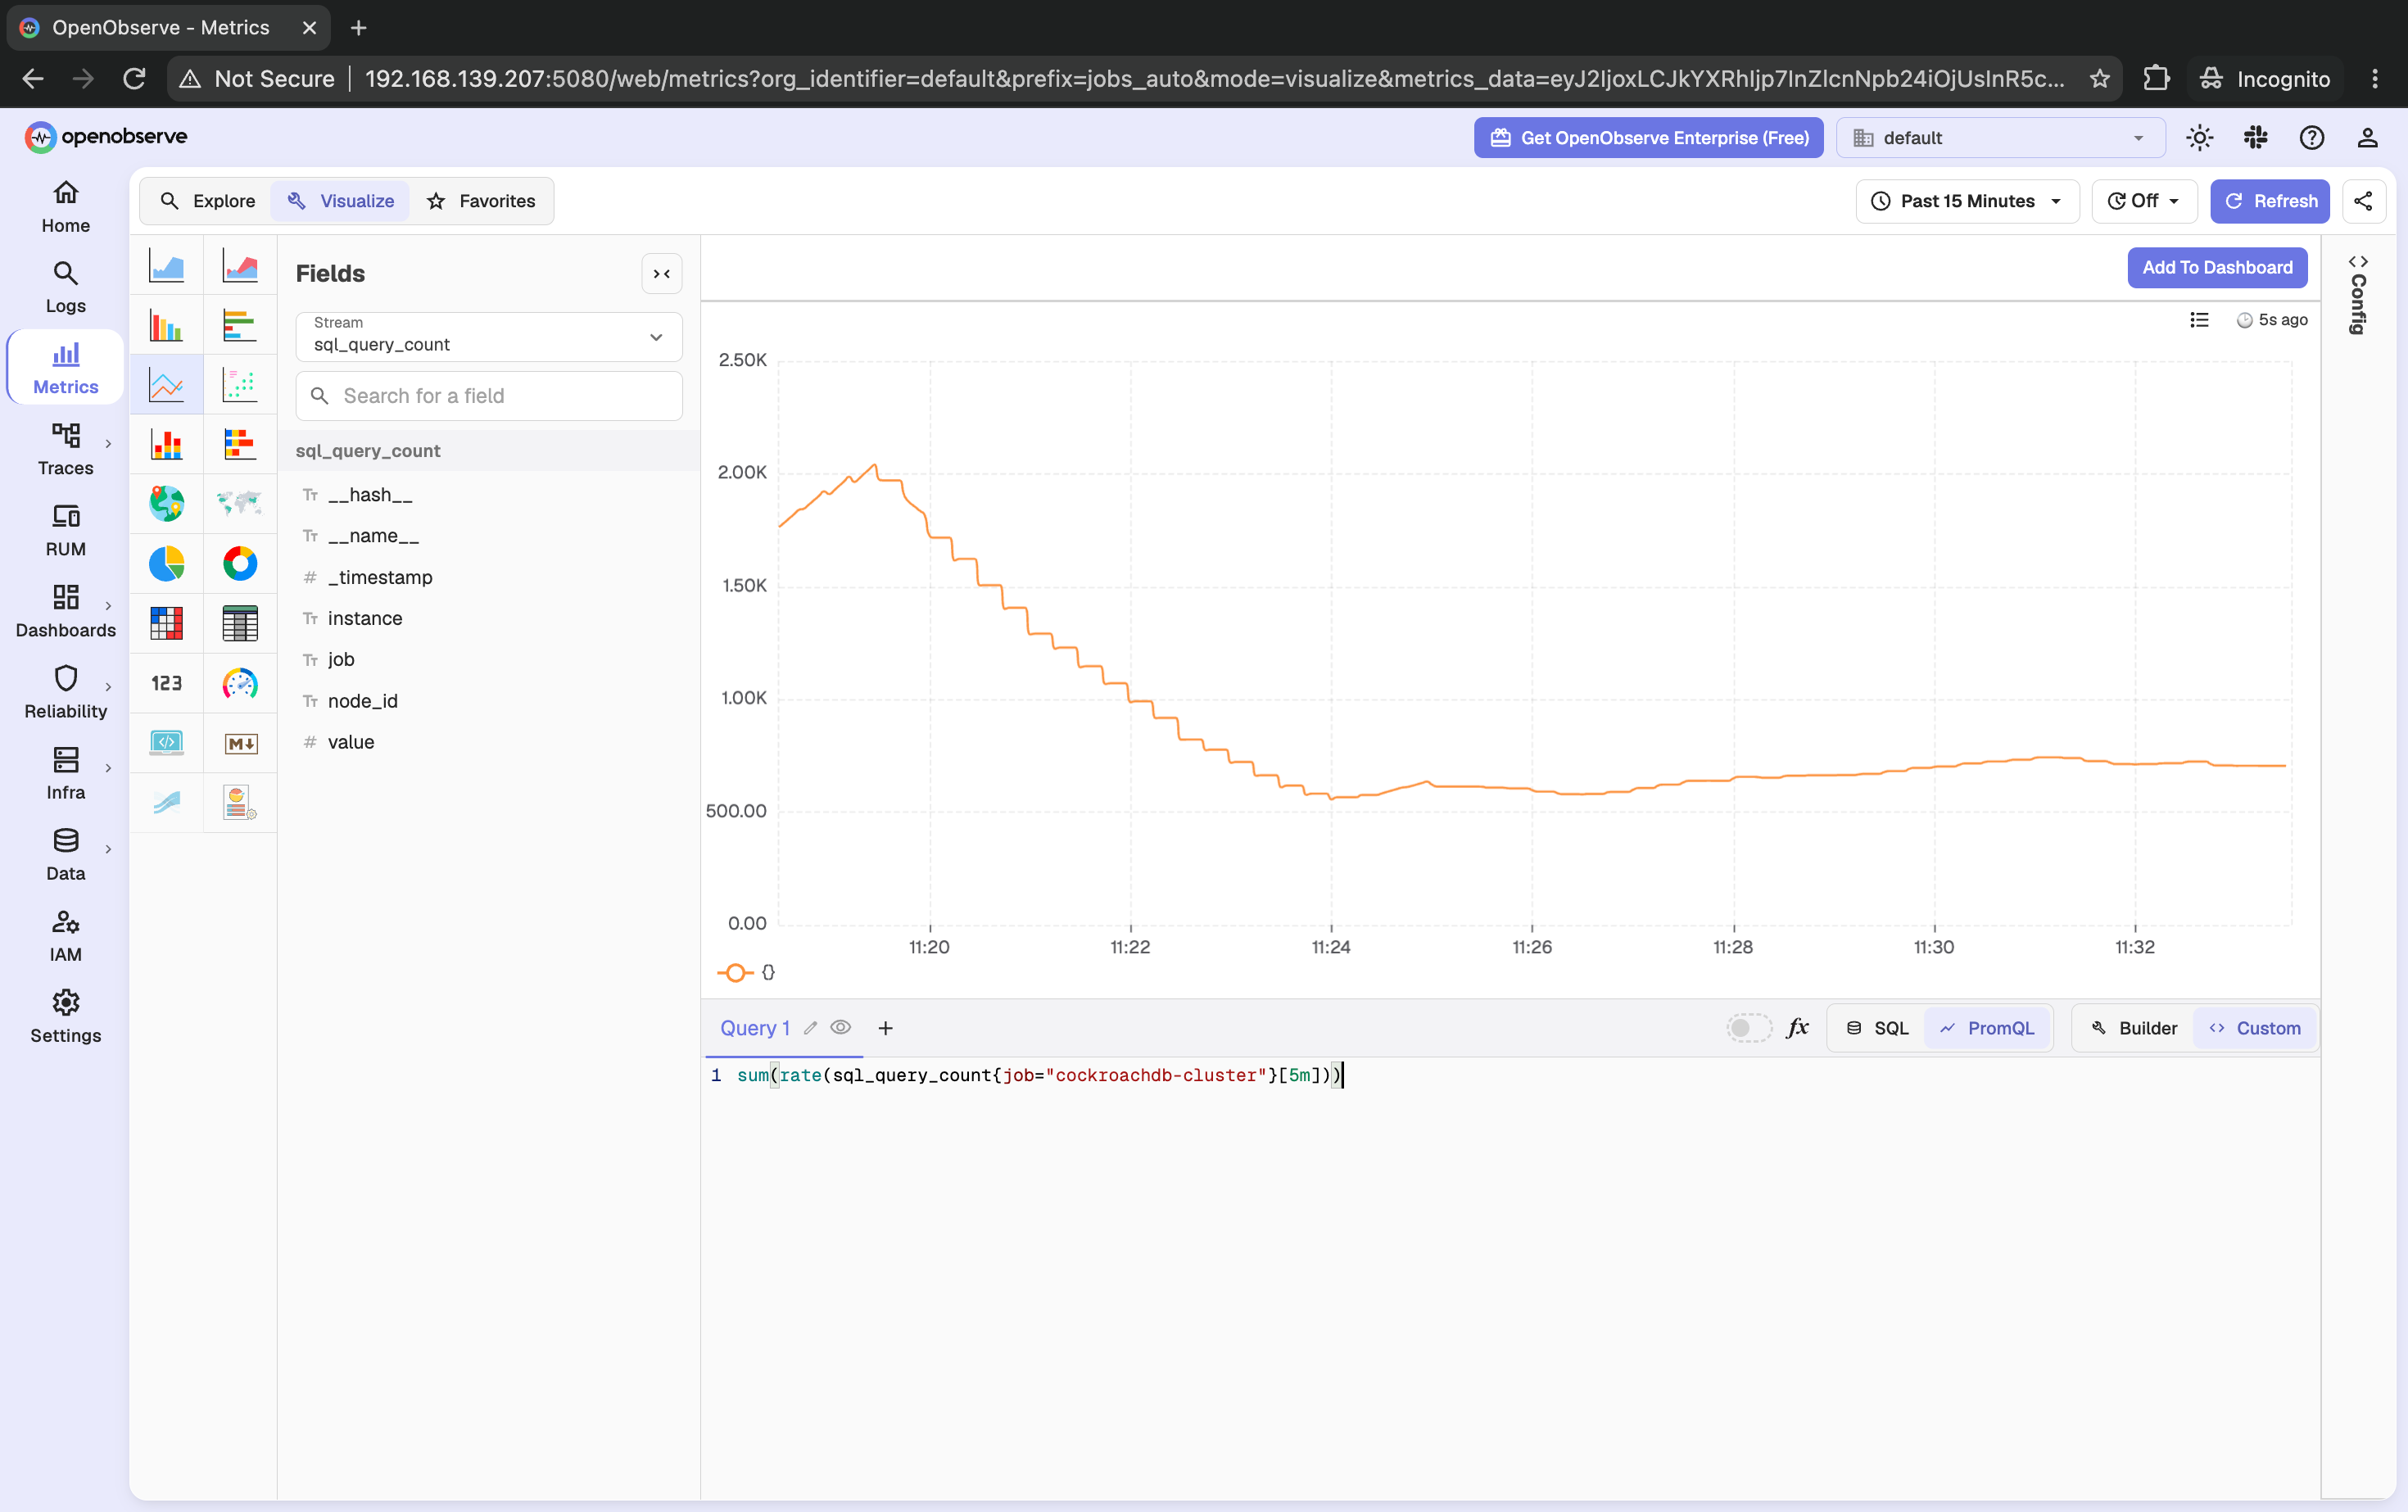
Next, open http://localhost:5080 and sign in with the OpenObserve credentials from the Compose file. Go to the Metrics interface, where you can query the data Prometheus has been sending over. Run:
sum(rate(sql_query_count{job="cockroachdb-cluster"}[5m]))
In plain terms, this query asks: "across every node, how many SQL queries per second has the cluster handled, averaged over the last 5 minutes?" If the movr workload from the previous step is still running, you should see a number greater than zero.
To compare query activity across nodes instead of seeing one combined total, run:
sum by (node_id, instance) (
  rate(sql_query_count{job="cockroachdb-cluster"}[5m])
)
This is the same calculation, but broken out per node so you can spot whether one node is handling noticeably more or less traffic than the others.
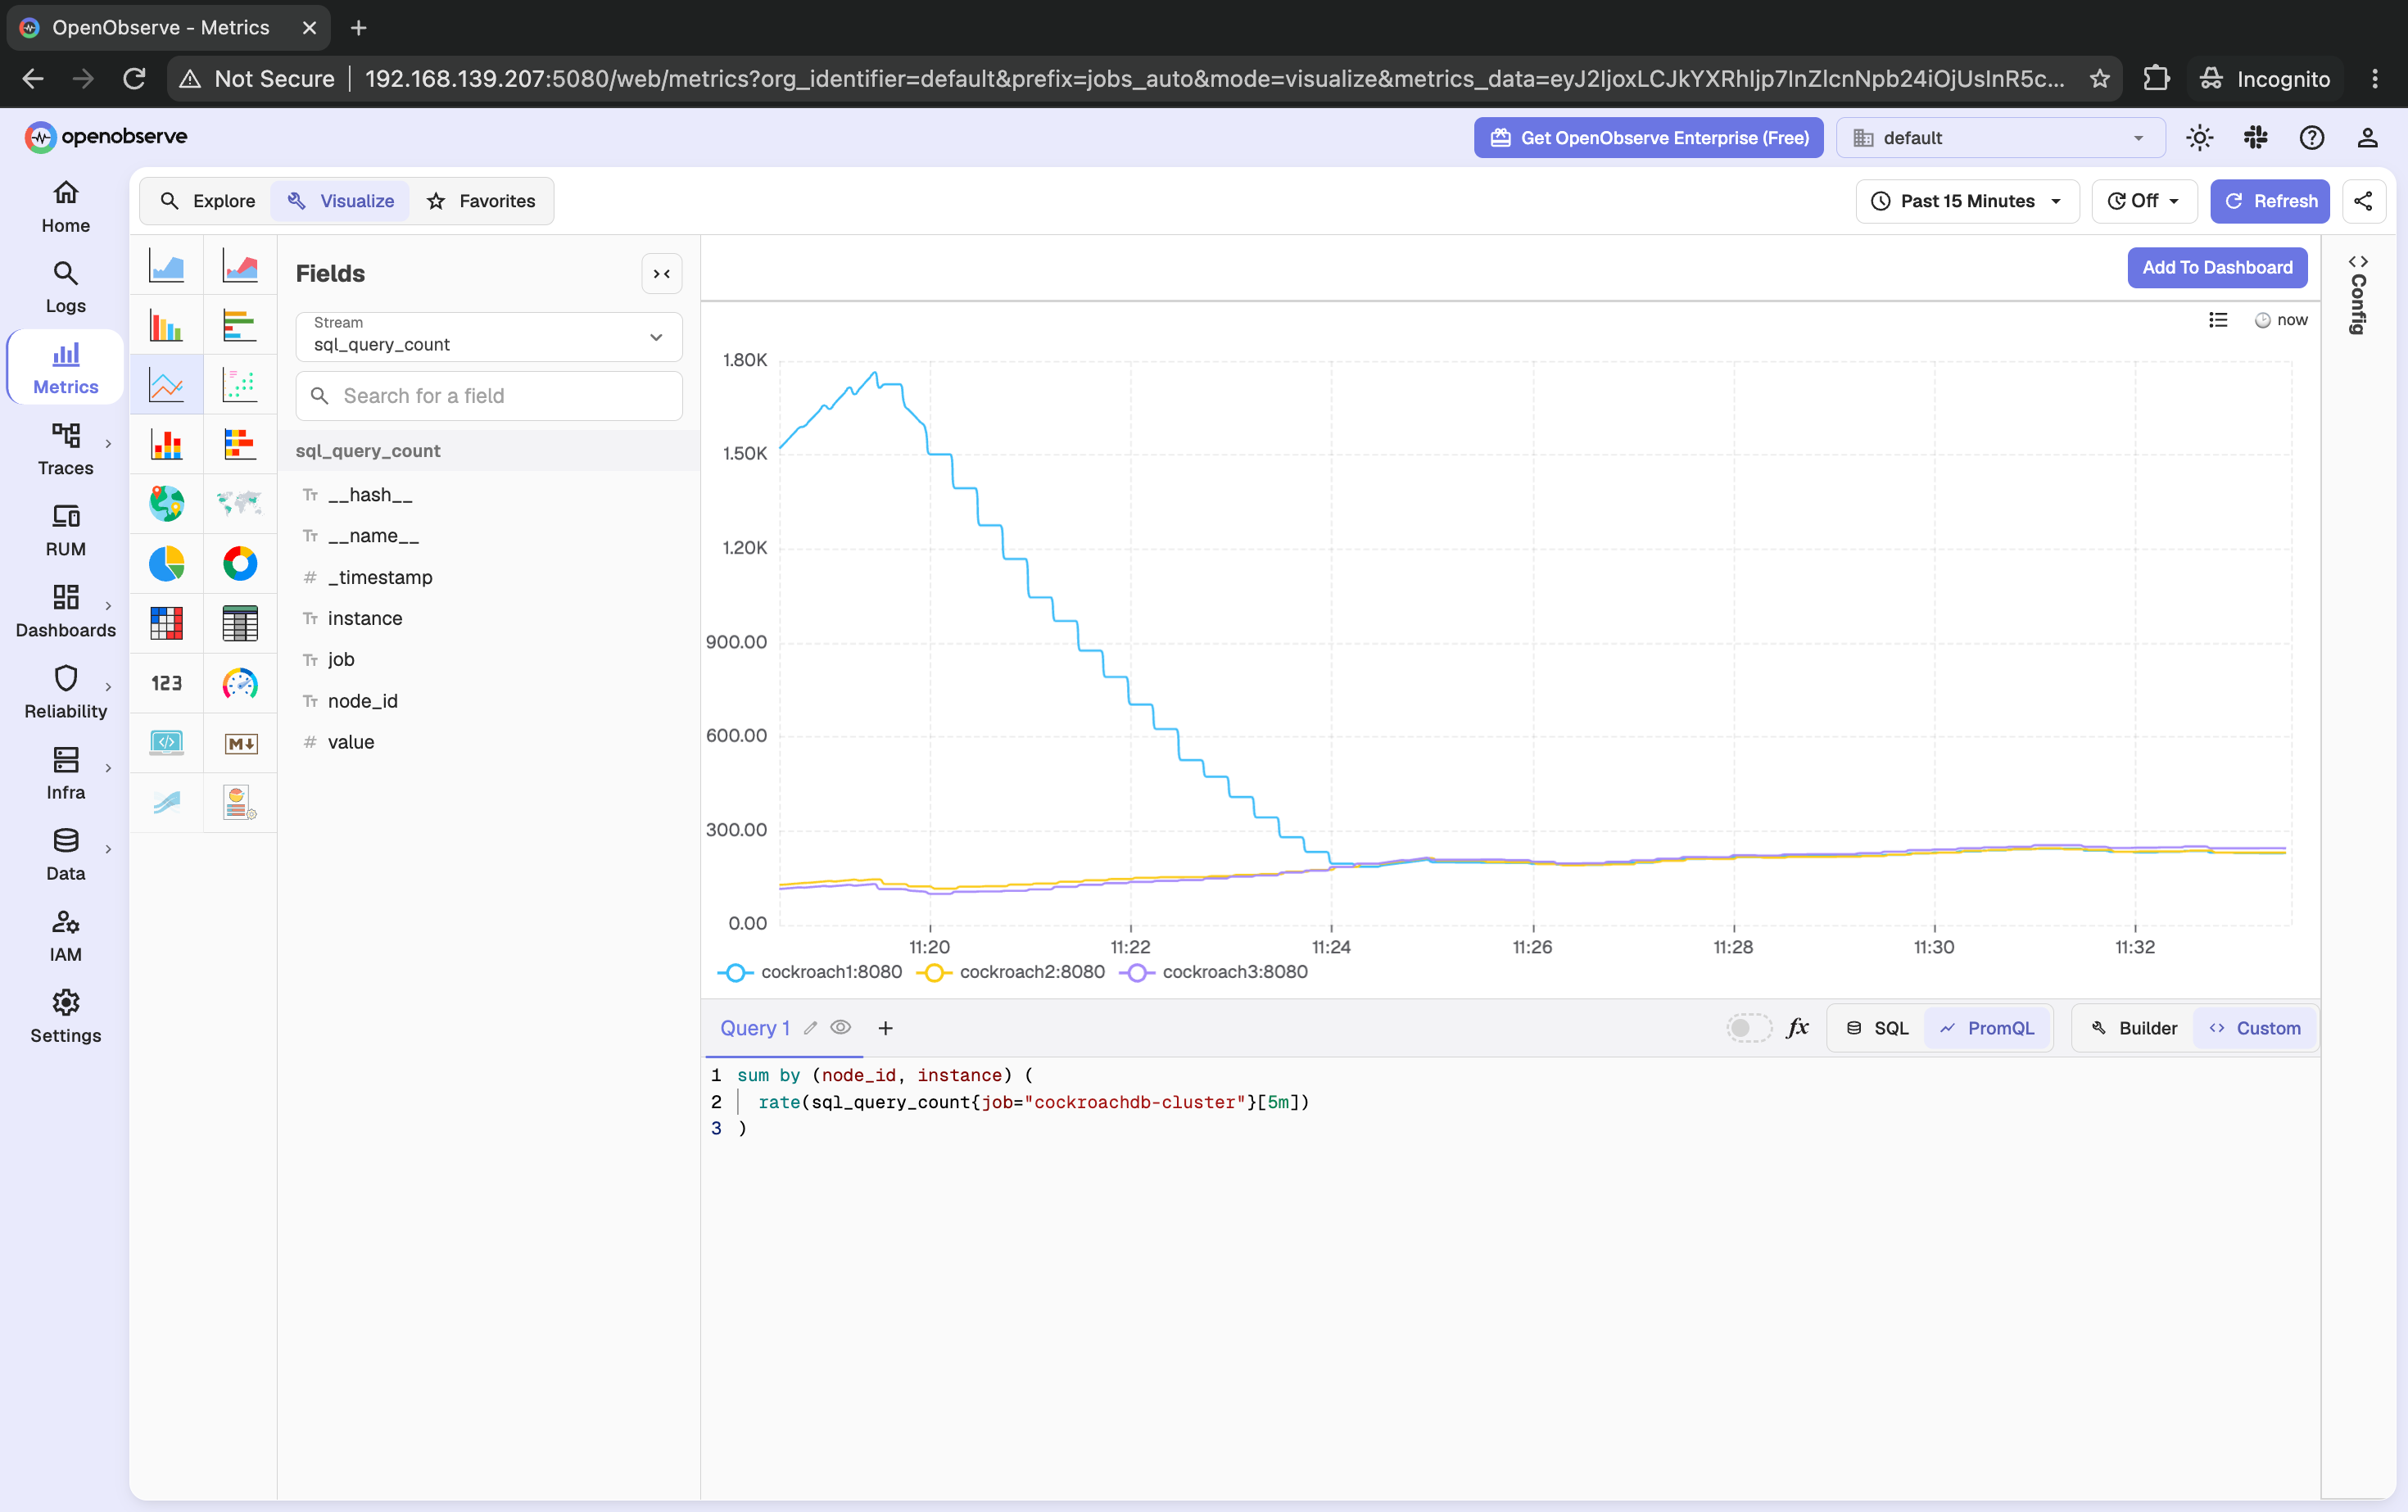
If these queries return data, the complete metrics pipeline, from CockroachDB, through Prometheus, into OpenObserve, is working end to end.
6. Import the CockroachDB cluster dashboard
Running SQL queries by hand is useful for checking that data is flowing, but you don't want to write a new query every time you want to check cluster health. A dashboard turns a set of these queries into charts you can glance at instead. Rather than building one from scratch, you can import a ready-made one.
Download CockroachDB Cluster Operations.dashboard.json from the CockroachDB directory in the OpenObserve dashboards repository.
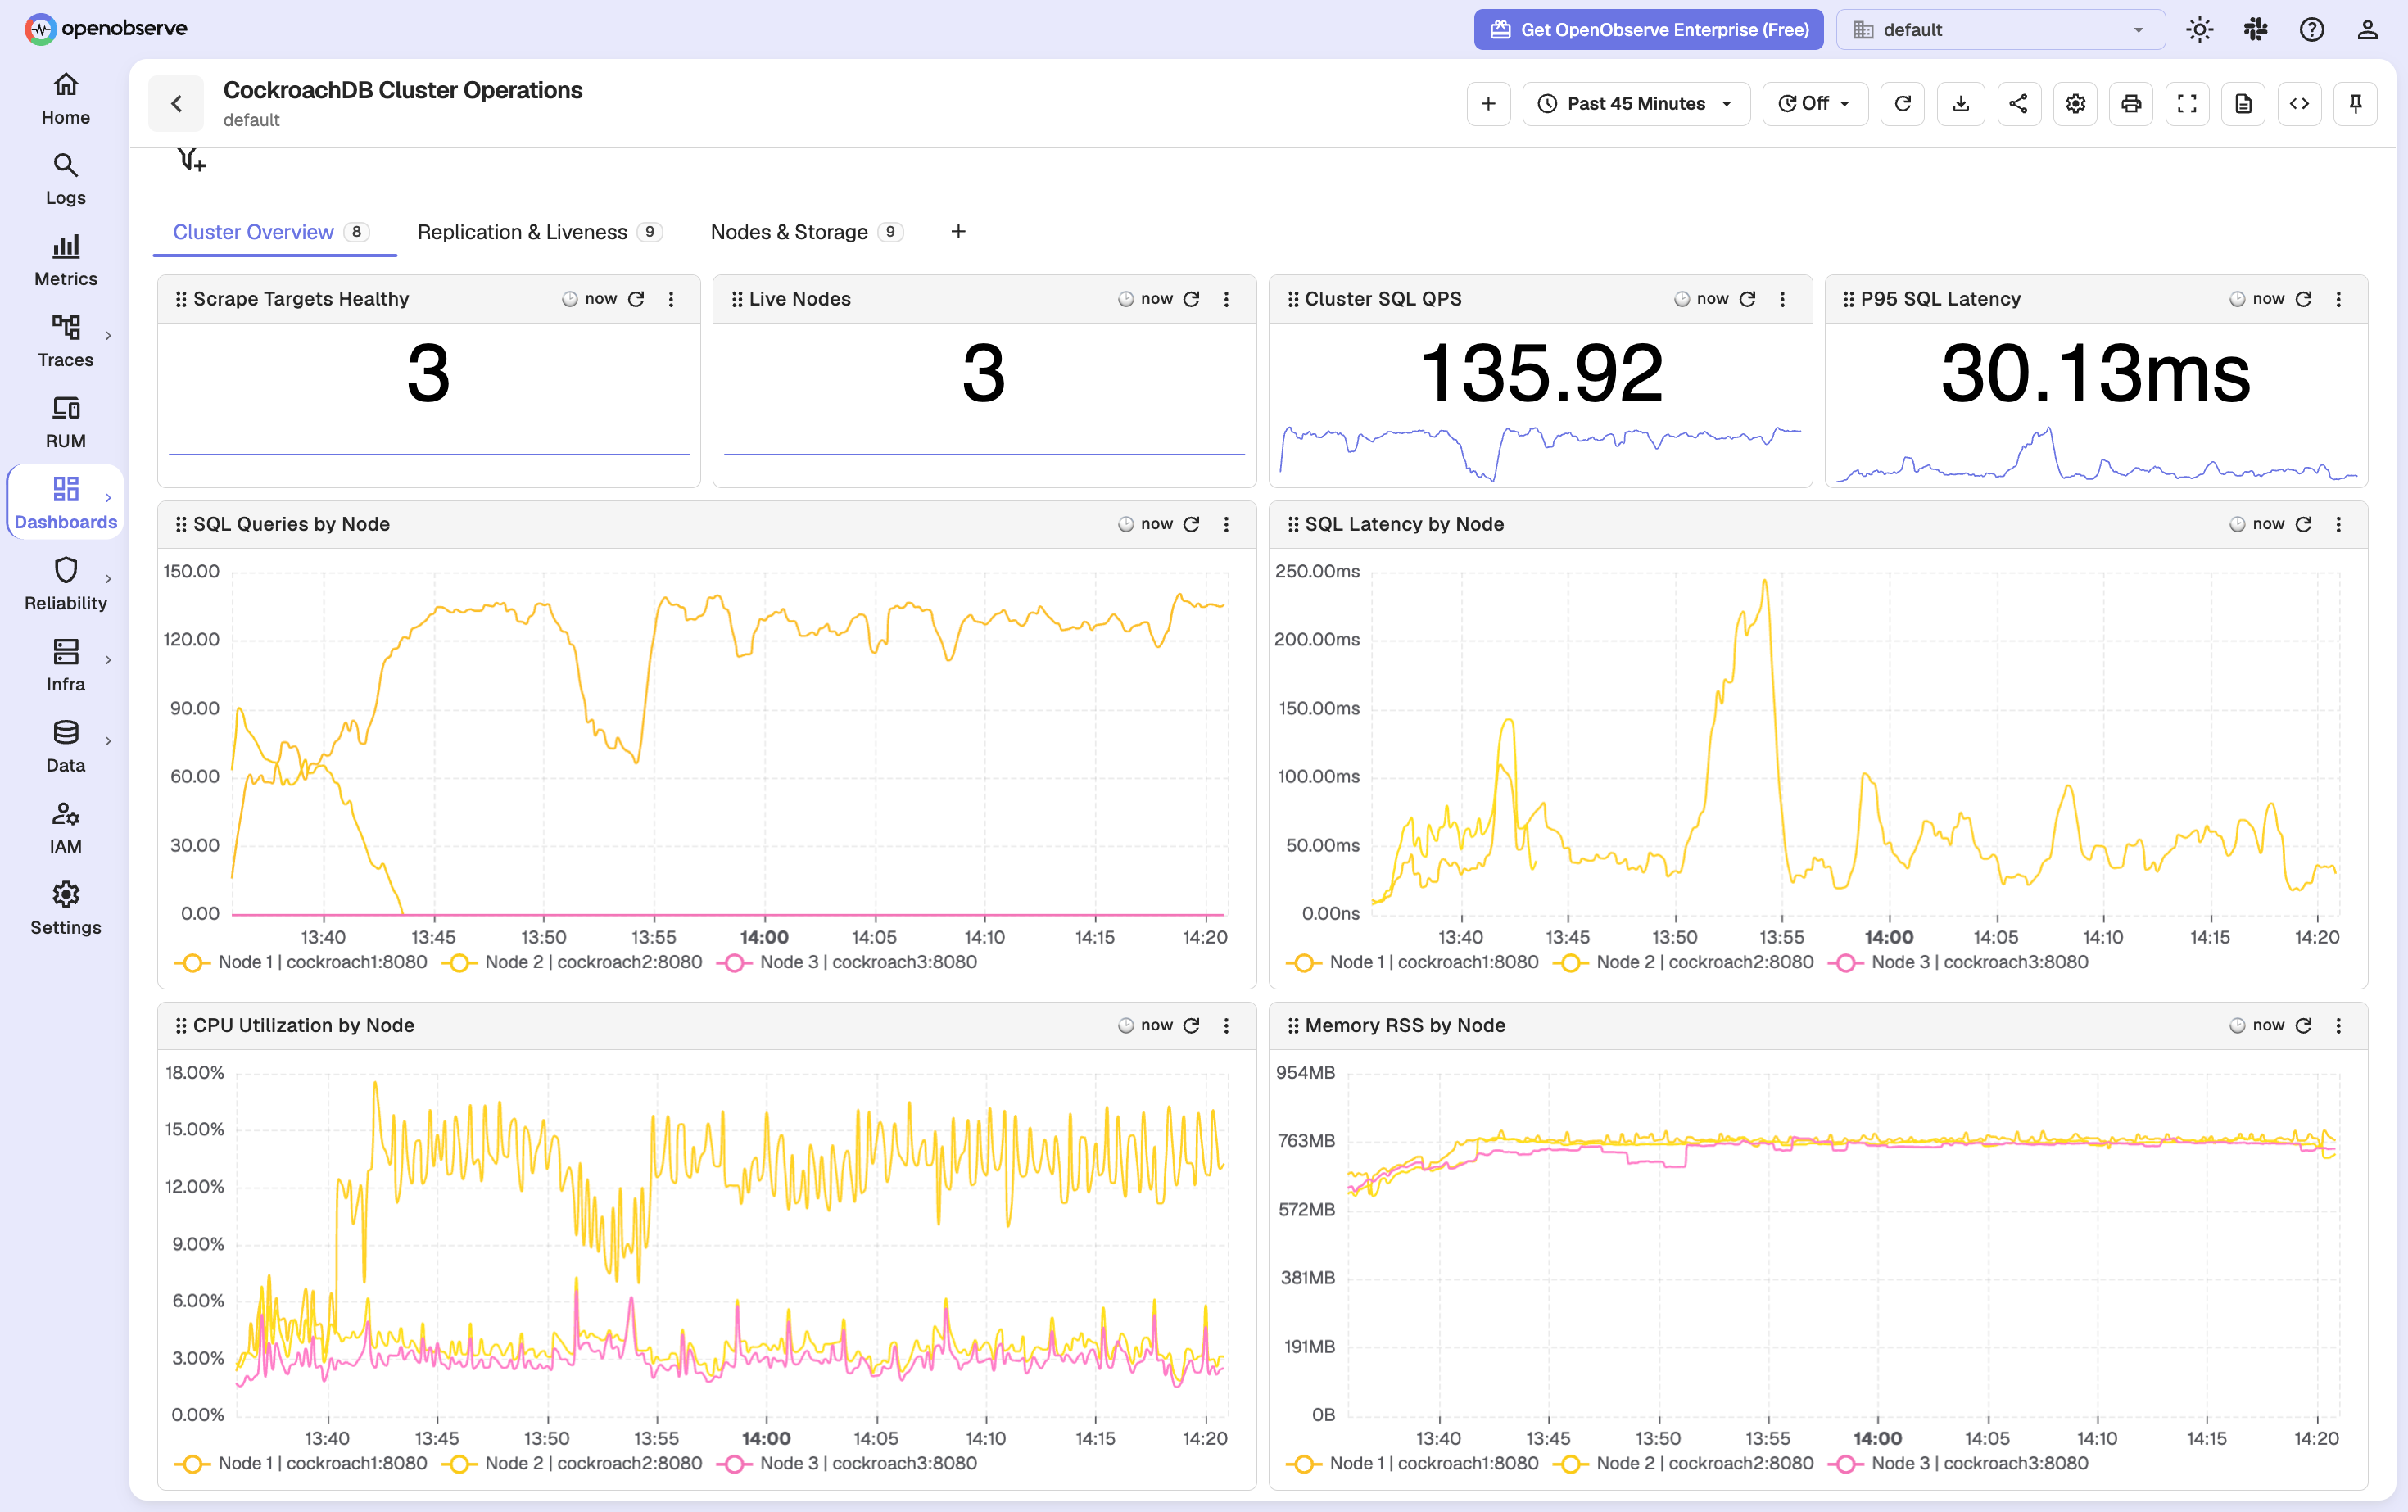
In OpenObserve, open Dashboards in the left-hand navigation, select Import, and upload the JSON file you just downloaded. Once it's imported, open the dashboard and choose a recent time range (for example, "Last 15 minutes") so the panels have data to display.
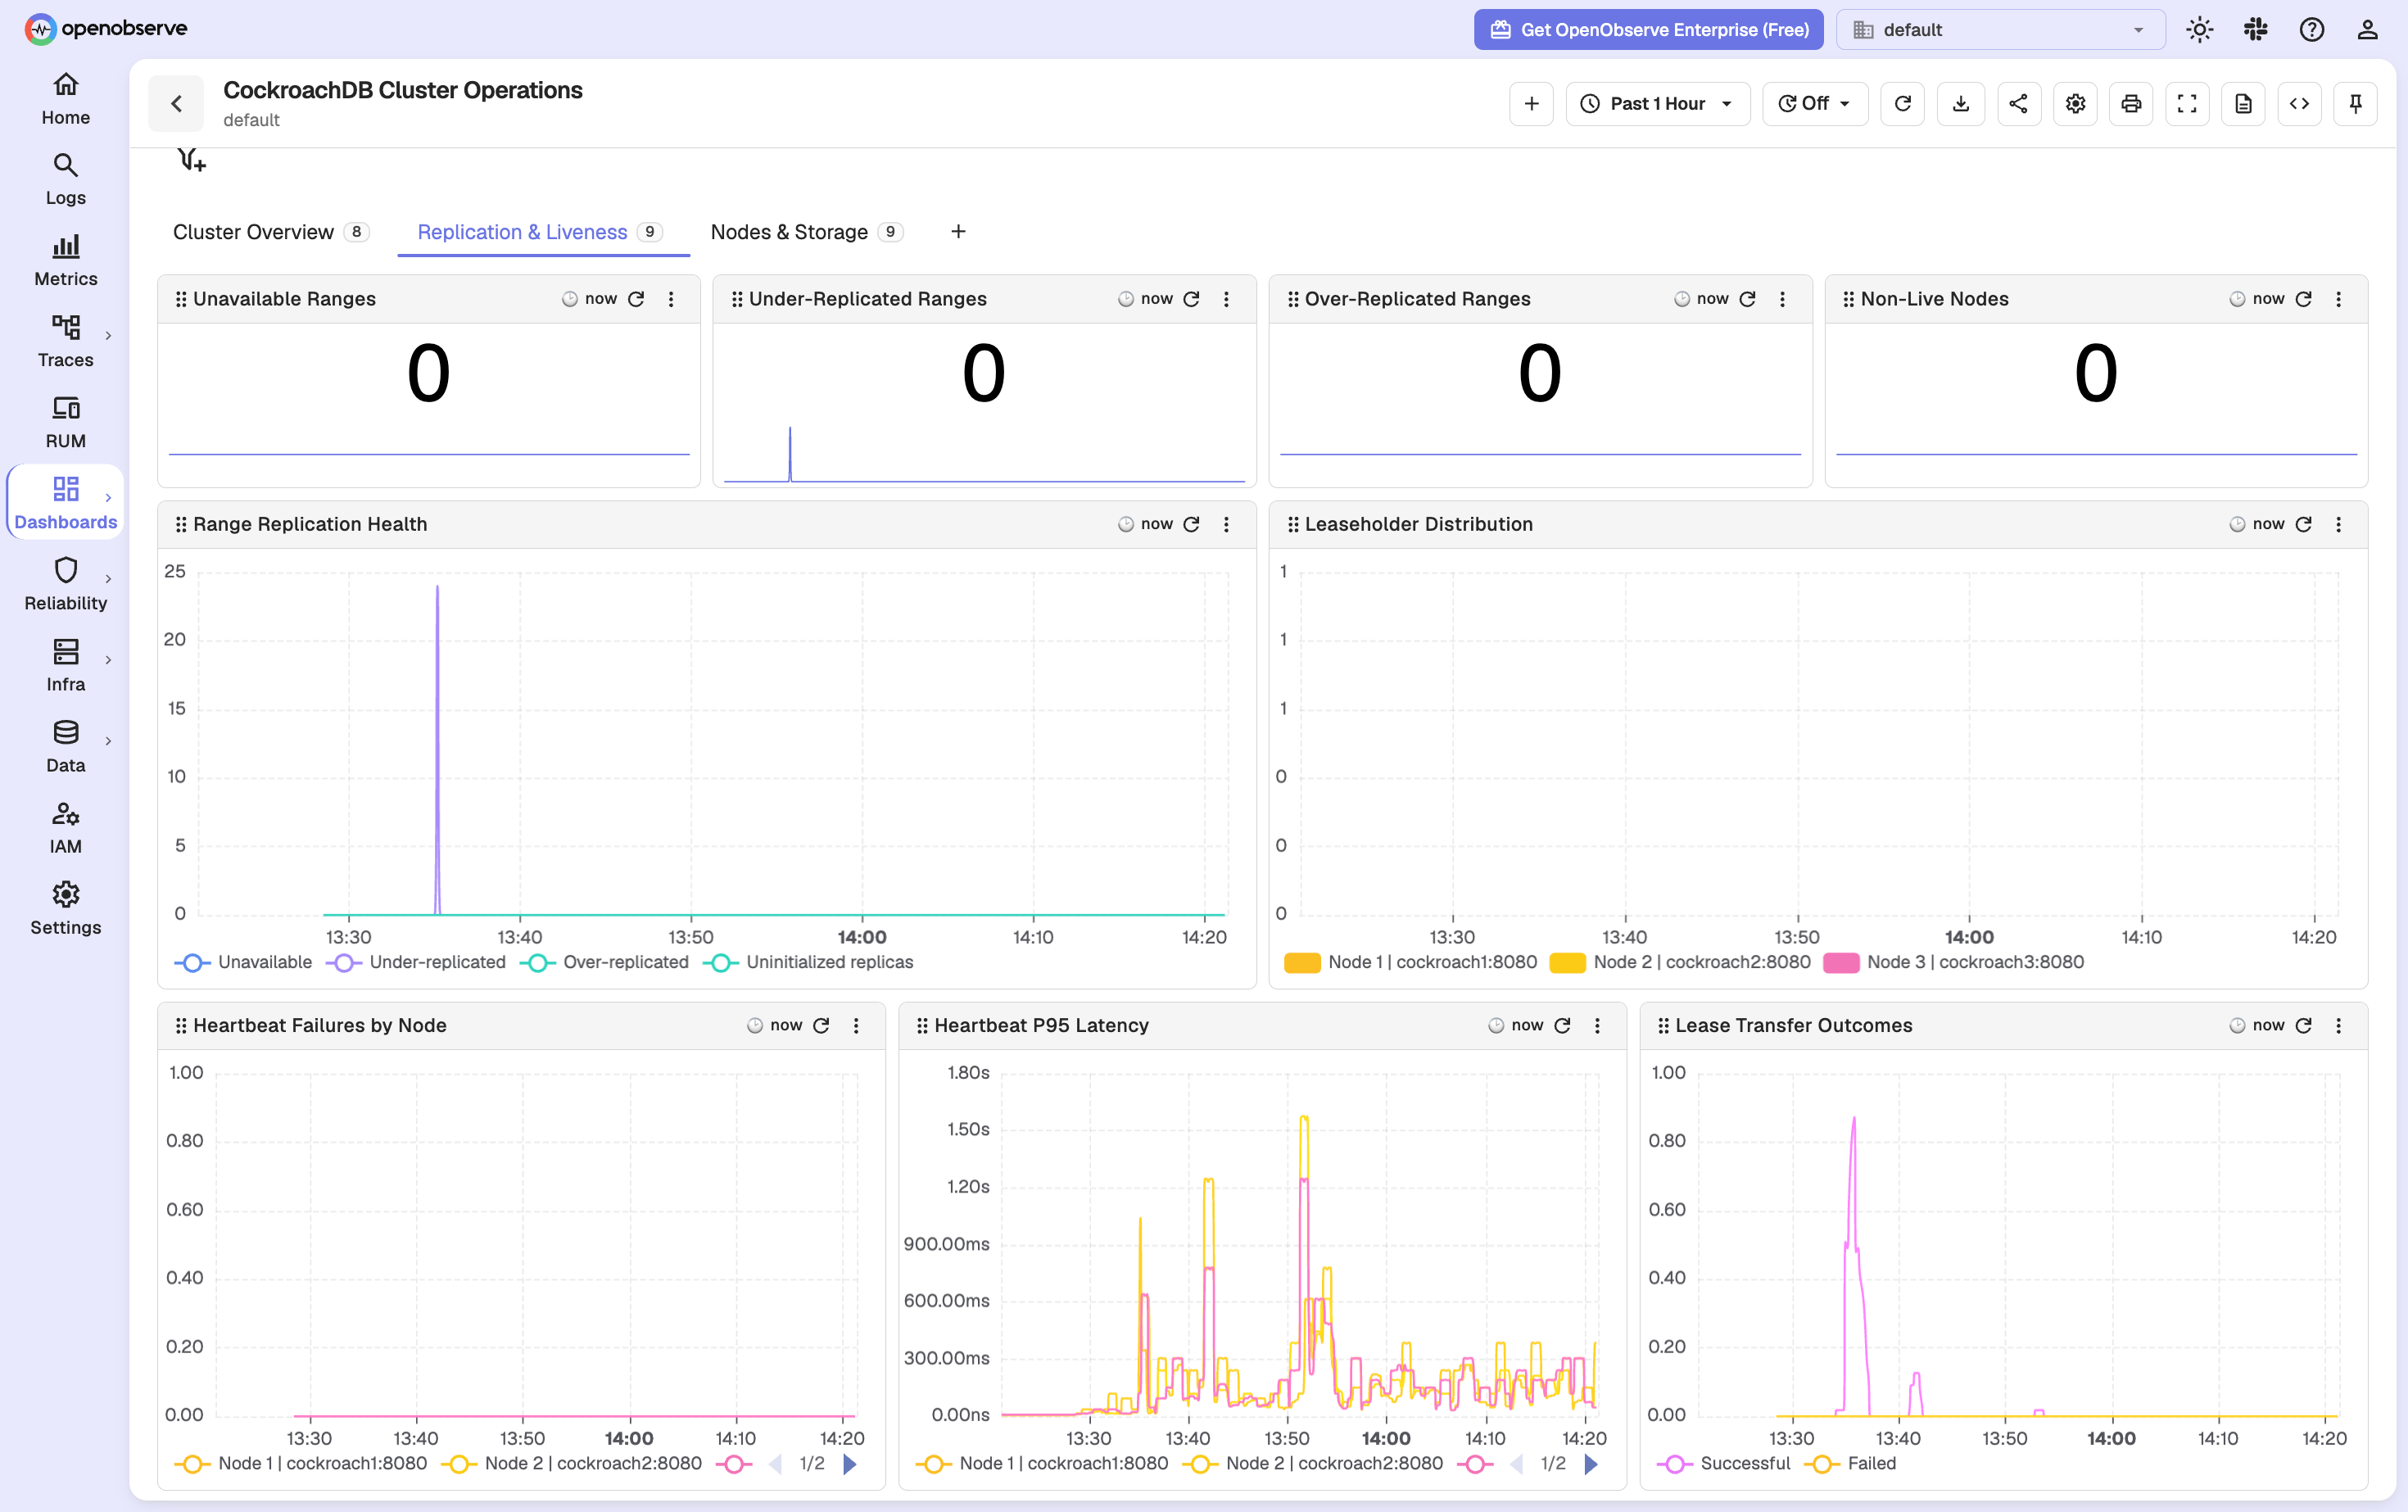
The dashboard provides three views:
- Cluster Overview covers SQL throughput, latency, CPU, memory, and node health.
- Replication & Liveness covers unavailable or under-replicated ranges, live nodes, heartbeats, leaseholders, and lease transfers.
- Nodes & Storage compares storage capacity, SQL connections, CPU, and memory across nodes.
CockroachDB cluster overview in OpenObserve
CockroachDB replication and liveness metrics
Monitoring a standalone CockroachDB server
The standalone setup uses the same CockroachDB metrics endpoint and OpenObserve remote-write configuration. Only the Prometheus job and target list need to change:
scrape_configs:
  - job_name: cockroachdb-standalone
    metrics_path: /_status/vars
    static_configs:
      - targets:
          - cockroachdb:8080
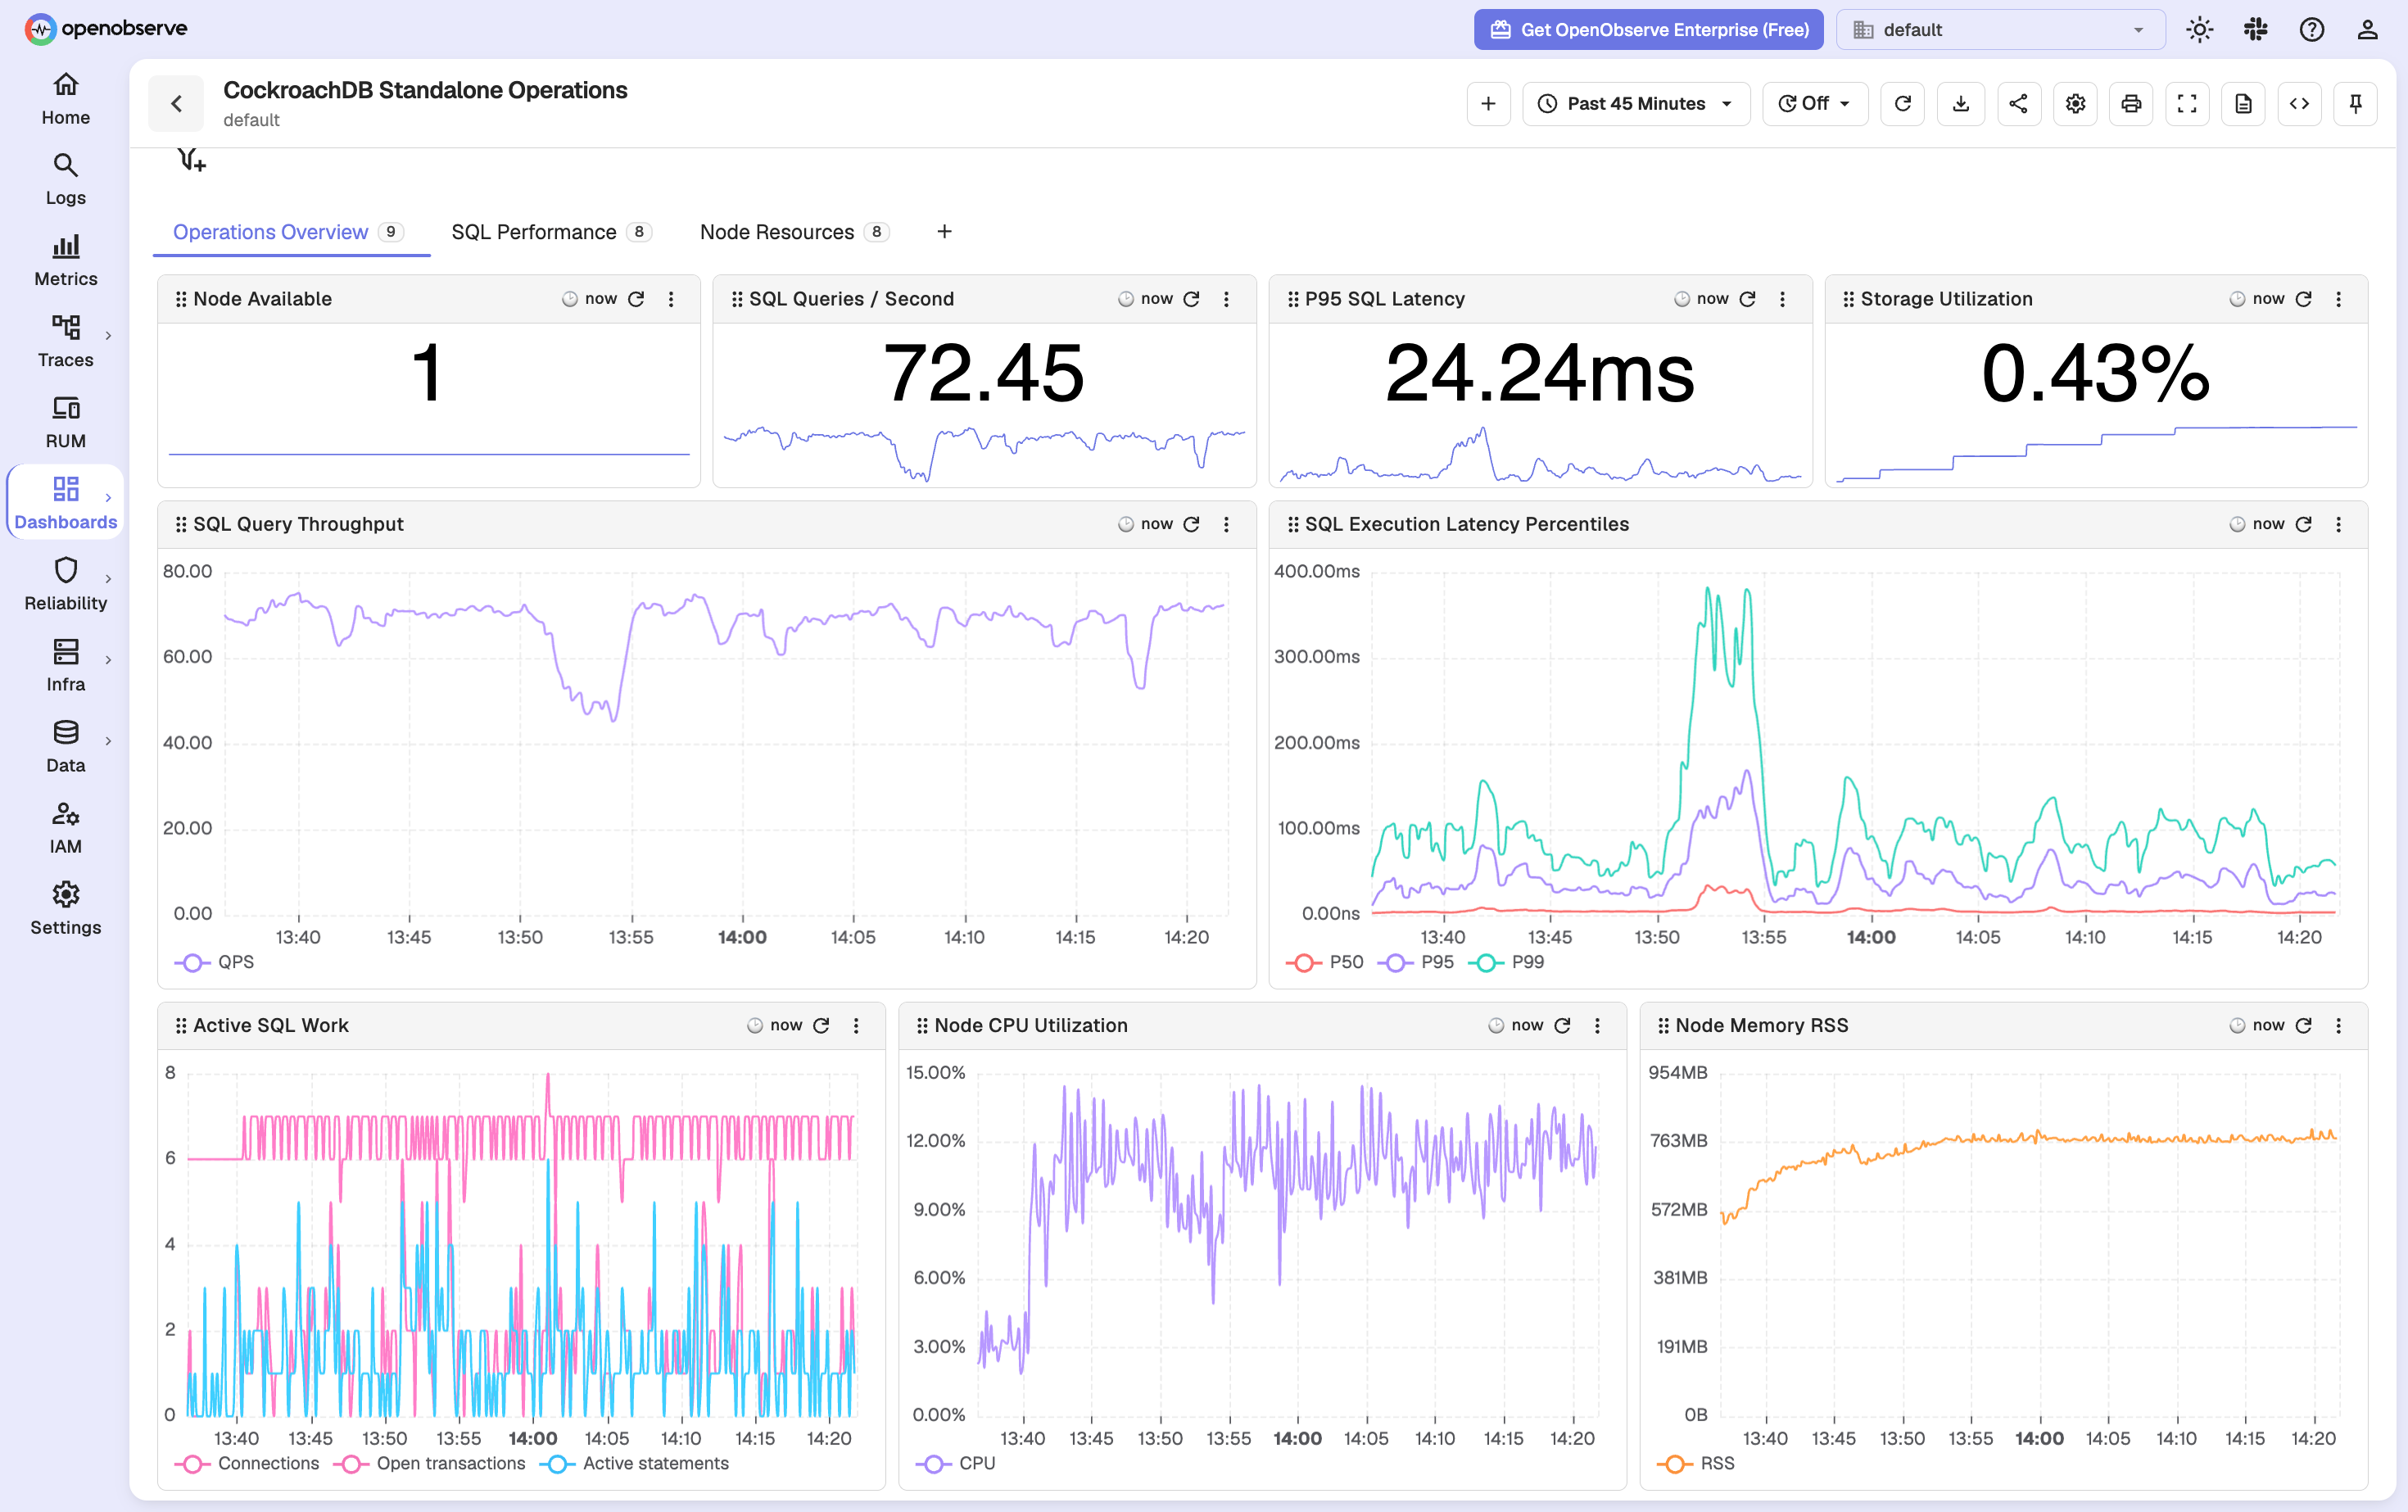
Import CockroachDB Standalone Operations.dashboard.json instead of the cluster dashboard. It focuses on SQL performance, connections, storage, CPU, memory, and process health for one server.
CockroachDB standalone operations in OpenObserve
Troubleshooting
If something isn't working, work through these in order, since later problems often only show up once earlier ones are fixed.
- Prometheus target is down: Check the CockroachDB container status and confirm that
/_status/varsis reachable from the Prometheus container. - OpenObserve has no metrics: Confirm the remote-write URL, organization name, username, and password. Check the Prometheus logs for remote-write errors.
- Dashboard panels are empty: Confirm that the Prometheus job name is exactly
cockroachdb-clusterorcockroachdb-standalone. - SQL panels have little activity: Run a workload or select a time range that contains application traffic.
- Only one cluster node appears: Make sure every CockroachDB node is listed as a separate Prometheus target.
Once the dashboard is reliably populated, it's worth setting up alerts on a couple of these panels (unavailable ranges, non-live nodes) so you find out about a replication problem before it shows up as an outage.
Clean up
Stop the containers and remove the local data volumes when you finish the example:
docker compose down -v
Conclusion
CockroachDB's native metrics endpoint, Prometheus remote write, and OpenObserve provide a straightforward monitoring pipeline without an additional exporter. The cluster dashboard adds distributed database signals such as node liveness, range replication, and leaseholder distribution, while the standalone dashboard applies the same approach to a single server. From here, the same pattern (an OpenTelemetry- or Prometheus-compatible endpoint, remote written into OpenObserve, visualized with an imported dashboard) carries over directly if you're monitoring other data stores alongside CockroachDB. See Monitoring MongoDB with OpenTelemetry, Monitoring Redis with OpenTelemetry, and Monitoring Apache Cassandra with OpenTelemetry for the equivalent walkthroughs on those databases.
Try It on OpenObserve Cloud
OpenObserve Cloud gives you a Prometheus remote-write endpoint ready to accept metrics with no infrastructure to provision, so you can skip the local openobserve container in this guide and point Prometheus straight at your Cloud org instead. The same dashboards, SQL and PromQL queries, and alerting are available from day one.
Frequently Asked Questions
About the Author
Anurag Vishwakarma


I am a DevOps engineer who enjoys building smooth, reliable delivery pipelines and keeping infrastructure fast and stable. Outside of work, a lot of time goes into homelab experiments and side projects, exploring new ways to run and optimize systems.
Follow OpenObserve on Google
Add OpenObserve as a preferred source to see more of our articles in Google Search and Top Stories.