Replacing the Grafana LGTM Stack with a Unified Platform




Ready to get started?
Try OpenObserve Cloud today for more efficient and performant observability.

OpenObserve is an open-source (AGPL-3.0) observability platform that replaces the Grafana LGTM stack (Loki, Grafana, Tempo, Mimir) with one system. Logs, metrics, and traces are ingested natively over OpenTelemetry, stored in one engine, and queried with SQL (plus PromQL for metrics), with dashboards, alerts, RUM, SLOs, incidents, and AI built in instead of bolted on.
This guide is written for teams evaluating a move off LGTM. It starts with the problems that usually trigger the search, then compares the LGTM stack and OpenObserve feature by feature and covers a migration plan.
TL;DR
- Best unified replacement for LGTM: OpenObserve: it consolidates Loki, Tempo, and Mimir's ingestion and storage into one system and replaces Grafana's dashboards with a built-in visualization layer, so there is one deployment to run instead of four.
- Best for teams hitting Loki cardinality limits: OpenObserve: columnar storage indexes logs without the label-cardinality constraints that slow Loki down.
- Best for reducing query language sprawl: OpenObserve: SQL for logs and traces, PromQL for metrics, so teams drop LogQL and TraceQL.
- Best for a low-risk migration: OpenObserve: native OTLP and Prometheus remote write let existing collectors fan out to OpenObserve alongside LGTM, with no instrumentation rewrite.
- Best for consolidating beyond LGTM's scope: OpenObserve: pipelines, RUM, synthetics, alerts, incidents, SLOs, AI SRE, AI Assistant, MCP server, LLM observability, database monitoring, and BYOB live in the same platform.
- Best for deployment choice: OpenObserve: use it as managed SaaS with OpenObserve Cloud, or self-host it on your own infrastructure.
What is the Grafana LGTM stack?
LGTM is shorthand for four separate Grafana Labs projects that are commonly deployed together to cover the three core observability signals:
- Loki: log aggregation, indexes metadata labels rather than full log content, queried with LogQL.
- Grafana: the visualization and alerting layer, connects to Loki, Tempo, Mimir, and other data sources as a front end.
- Tempo: distributed tracing backend, queried with TraceQL, usually correlated with logs and metrics via trace IDs.
- Mimir: long-term Prometheus-compatible metrics storage, queried with PromQL.
Each of these is its own project with its own release cadence, its own storage backend (object storage plus a compactor/ingester tier), and its own scaling model. Grafana itself does not store any telemetry; it is purely the query and visualization front end for the other three.
The LGTM stack gives you Grafana's dashboards, but Grafana does not ingest or store logs, metrics, or traces itself. Loki, Tempo, and Mimir have to be deployed, scaled, and upgraded independently for the stack to function.
Why are teams replacing the Grafana LGTM stack?
Four systems, four operational surfaces
Running LGTM in production means running Loki's ingester/querier/compactor components, Tempo's distributor/ingester/compactor components, and Mimir's equivalent set, each with its own object storage buckets, retention configuration, and upgrade path. A change to one component (say, a Loki version bump) can require re-validating compatibility with the Grafana data source in use. Teams report multi-week ramp-up time just to get all four components production-ready with high availability.
Three query languages to maintain
LogQL for logs, PromQL for metrics, TraceQL for traces: three distinct syntaxes with different mental models for filtering, aggregating, and joining data. Correlating a trace with its logs typically means copying a trace ID from one view into a query against another store, since there is no native join across the two.
Loki's high-cardinality ceiling
Loki indexes log labels, not log content, intentionally, to keep it lightweight. In practice, adding a high-cardinality label (user ID, request ID, pod name with dynamic suffixes) can blow up the index and degrade query performance, pushing teams toward restrictive labeling schemes that limit what they can search on later.
Mimir's scaling complexity
Mimir is a capable long-term Prometheus store, but its microservices architecture (distributor, ingester, querier, store-gateway, compactor) means a production deployment is itself a small distributed system to operate, monitor, and capacity-plan for, on top of the three other components in the stack.
The stack stops at L, G, T, and M
The self-hosted LGTM stack covers logs, metrics, traces, and dashboards. Almost everything a modern on-call team needs beyond that is either a Grafana Cloud product or another tool to run: SLO management, incident response and on-call, synthetic checks, frontend monitoring backends, AI-assisted investigation, and LLM observability. Every one of those adds a contract, a UI, or a deployment to the "four systems" problem above.
The alternative: OpenObserve at a glance
OpenObserve was built to collapse that sprawl into one platform:
- One binary handles ingestion, storage, query, dashboards, and alerting. Run it as a single node or scale it out with the Kubernetes Helm chart.
- One storage engine keeps logs, metrics, and traces in columnar Parquet on object storage (S3, GCS, Azure Blob, MinIO).
- One query model: SQL across every signal, plus native PromQL for metrics.
- OpenTelemetry-native ingestion over OTLP, plus Prometheus remote write, Fluent Bit, Vector, and other common shippers.
- Everything else built in: pipelines, RUM, synthetics, alerts, incidents, SLOs, and AI features share the same data, the same RBAC, and the same UI.
LGTM stack vs. OpenObserve: side-by-side feature comparison
The table compares Grafana (the LGTM stack) with OpenObserve. Features that are only available in Grafana Cloud, or only in OpenObserve Enterprise or OpenObserve Cloud, are marked.
| Capability | Grafana | OpenObserve |
|---|---|---|
| Logs | Loki: label-indexed, LogQL, high-cardinality labels degrade performance | Native, full-text and SQL search, columnar storage without label-cardinality limits |
| Metrics | Mimir: Prometheus-compatible, PromQL, multi-component deployment | Native, PromQL-compatible, Prometheus remote write, also queryable with SQL |
| Traces | Tempo: TraceQL, correlated to logs via trace IDs across stores | Native OTLP traces, SQL-queryable, service graph, one-click pivot to logs and metrics |
| Dashboards | Grafana: separate front end wired to each backend | Built in: 19 chart types plus custom ECharts, SQL/PromQL, drilldowns, variables |
| Prebuilt dashboards | Large community dashboard library | Prebuilt dashboards for common sources, plus a Dashboard Migrator that converts Grafana JSON |
| Pipelines | Processing happens in the collector (Grafana Alloy / OTel Collector) before data reaches each backend | Built-in real-time and scheduled pipelines: VRL functions, enrichment tables, redaction, routing |
| RUM (real user monitoring) | Faro Web SDK collects browser telemetry; RUM views and session replay via Frontend Observability (Grafana Cloud only) | Native RUM: session replay, Core Web Vitals, error tracking, correlated to backend traces |
| Synthetic monitoring | Blackbox exporter for HTTP, TCP, ICMP, and DNS probes; managed k6-based Synthetic Monitoring (Grafana Cloud only) | Built-in API, TLS, and Playwright browser checks from multiple regions, plus status pages |
| Alerts | Grafana Alerting plus Loki and Mimir rulers | SQL and PromQL alerts, real-time and scheduled, deduplication |
| Incidents | Grafana IRM for incident response and on-call (Grafana Cloud only) | Automatic alert correlation into incidents, alert graph, correlated telemetry, activity timeline |
| SLOs | Grafana SLO (Grafana Cloud only); self-hosted teams generate recording rules with tools like Sloth or Pyrra | Native SLOs with error budgets, multi-window burn-rate alerts, per-dimension SLIs |
| AI SRE | AI investigation features (Grafana Cloud only) | AI SRE agent investigates the moment an alert fires, writes an evidence-backed RCA, bring your own LLM |
| AI Assistant | Grafana Assistant (Grafana Cloud only) | AI Assistant turns plain English into queries, dashboards, and alerts on your data |
| MCP server | Open-source Grafana MCP server queries through Grafana data sources | Built-in MCP server with RBAC-scoped, audited access to logs, metrics, and traces |
| AI / LLM observability | AI Observability (Grafana Cloud only) | LLM and agent tracing with token cost per span; online and offline evaluations and datasets |
| Database monitoring | Prometheus exporters plus community dashboards; Database Observability (Grafana Cloud only) | Integrations for PostgreSQL, MySQL, MongoDB, Redis, Oracle, and more, with prebuilt dashboards and alerts |
| Bring Your Own Bucket | Self-hosted: your own buckets, one set per backend (Loki, Mimir, Tempo); Grafana Cloud stores data for you | Self-hosted: one bucket for all signals; OpenObserve Cloud Enterprise can keep data in your S3 or Azure account |
| Query languages | 3 (LogQL, PromQL, TraceQL) | SQL for everything, plus PromQL for metrics |
| Deployment units | 4 separate systems | 1 binary/container |
| License | AGPLv3 (Loki, Grafana, Tempo, Mimir) | AGPL-3.0 |
Grafana Cloud capabilities change frequently; check Grafana's documentation for current availability. The point for a buyer is structural: on LGTM, each capability past the core four signals is another product or another deployment, while in OpenObserve it is a menu item in the same UI, running on the same data.
Feature-by-feature: what you get when you replace LGTM
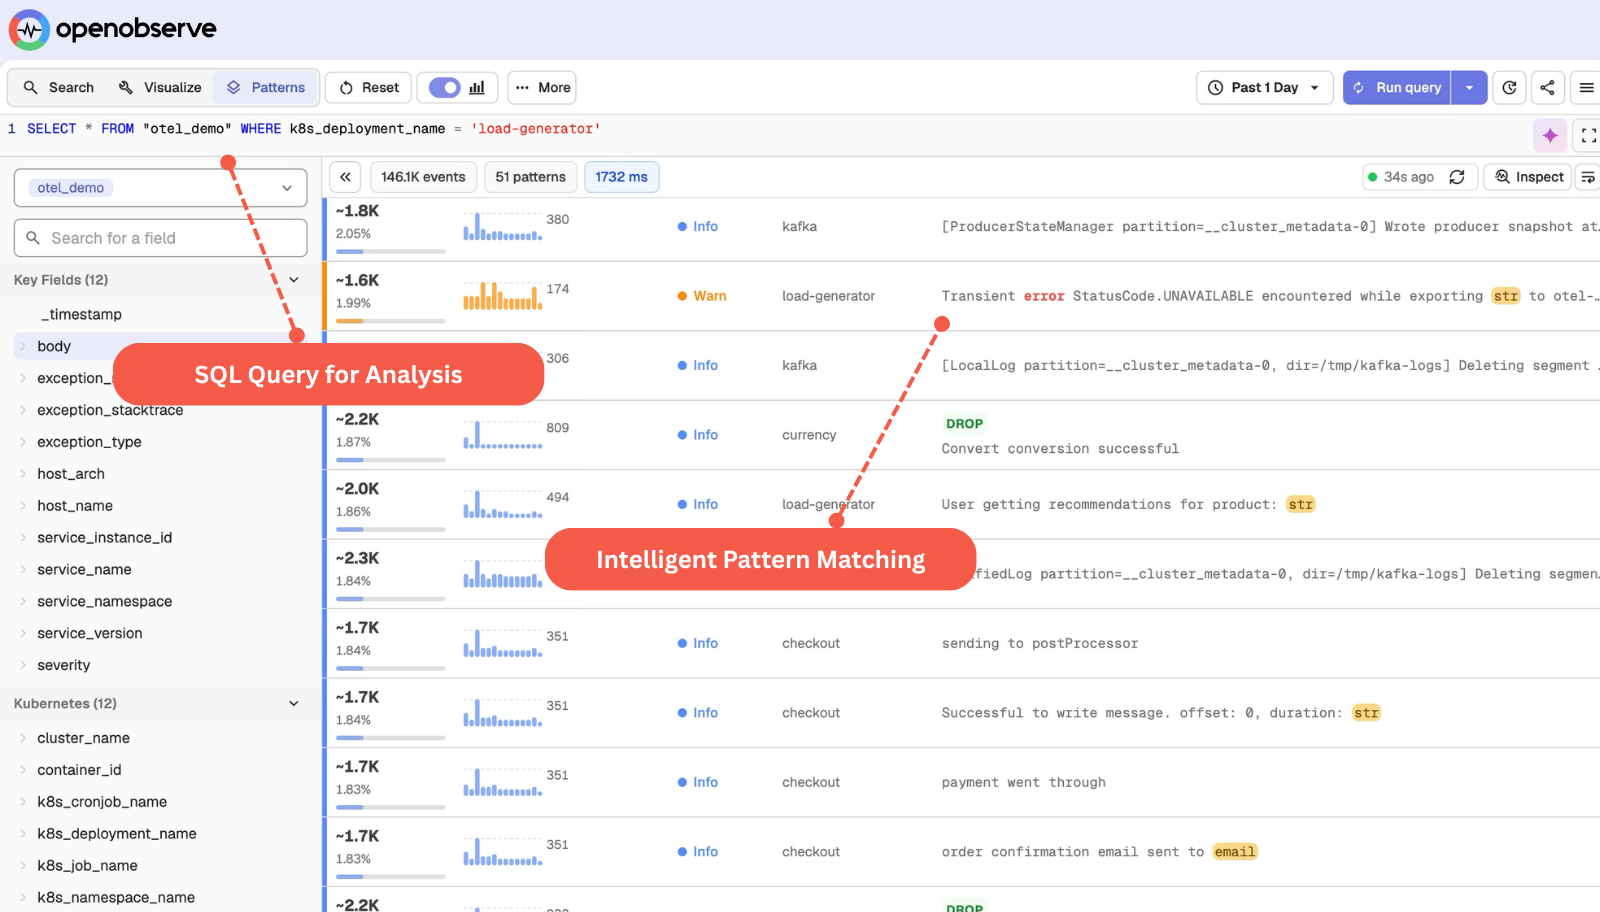
Logs: search everything, not just labels
OpenObserve stores logs in columnar format and lets you search them with full-text search or SQL, so you are not forced to decide up front which fields become labels. High-cardinality fields such as request IDs and user IDs are just columns. Learn more on the OpenObserve logs page or in the log search docs.
Metrics: keep PromQL, add SQL
PromQL support in OpenObserve is scoped to metrics. OpenObserve accepts Prometheus remote write and runs PromQL natively, so existing Prometheus and Mimir dashboards, recording rules, and alert expressions carry over largely unchanged. The same metrics are also queryable with SQL when an investigation needs joins or correlation with logs and traces. This mirrors how LGTM already splits things (PromQL was always Mimir's language, never Loki's or Tempo's), but OpenObserve replaces LogQL and TraceQL with a single SQL engine.
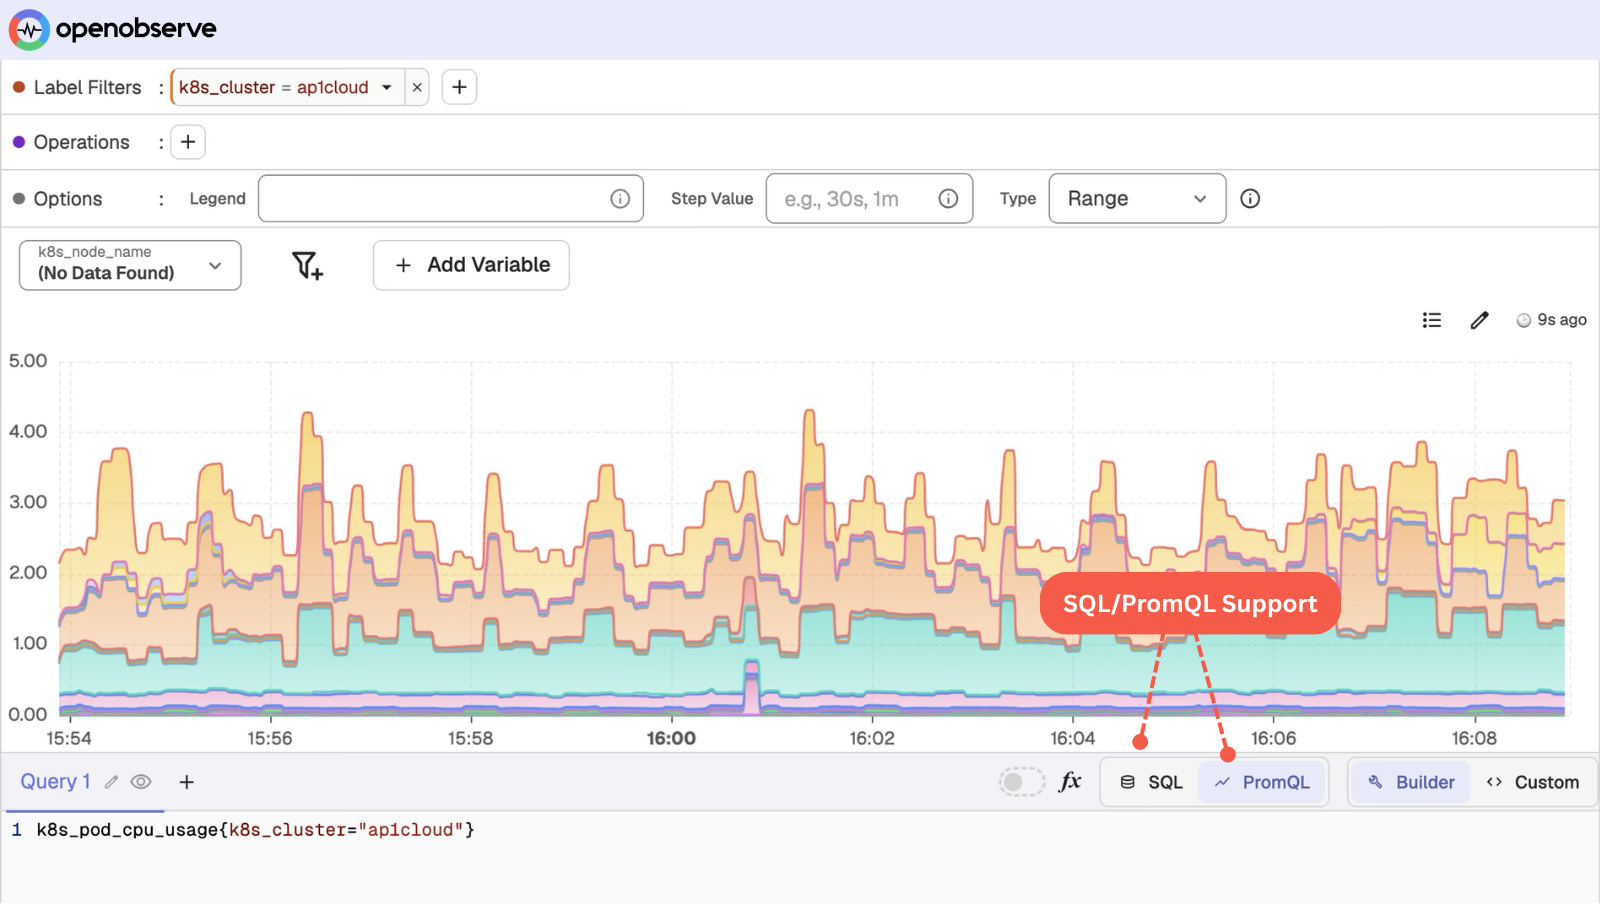
See the OpenObserve metrics platform or the benchmarked OpenObserve vs Prometheus and Mimir comparison.
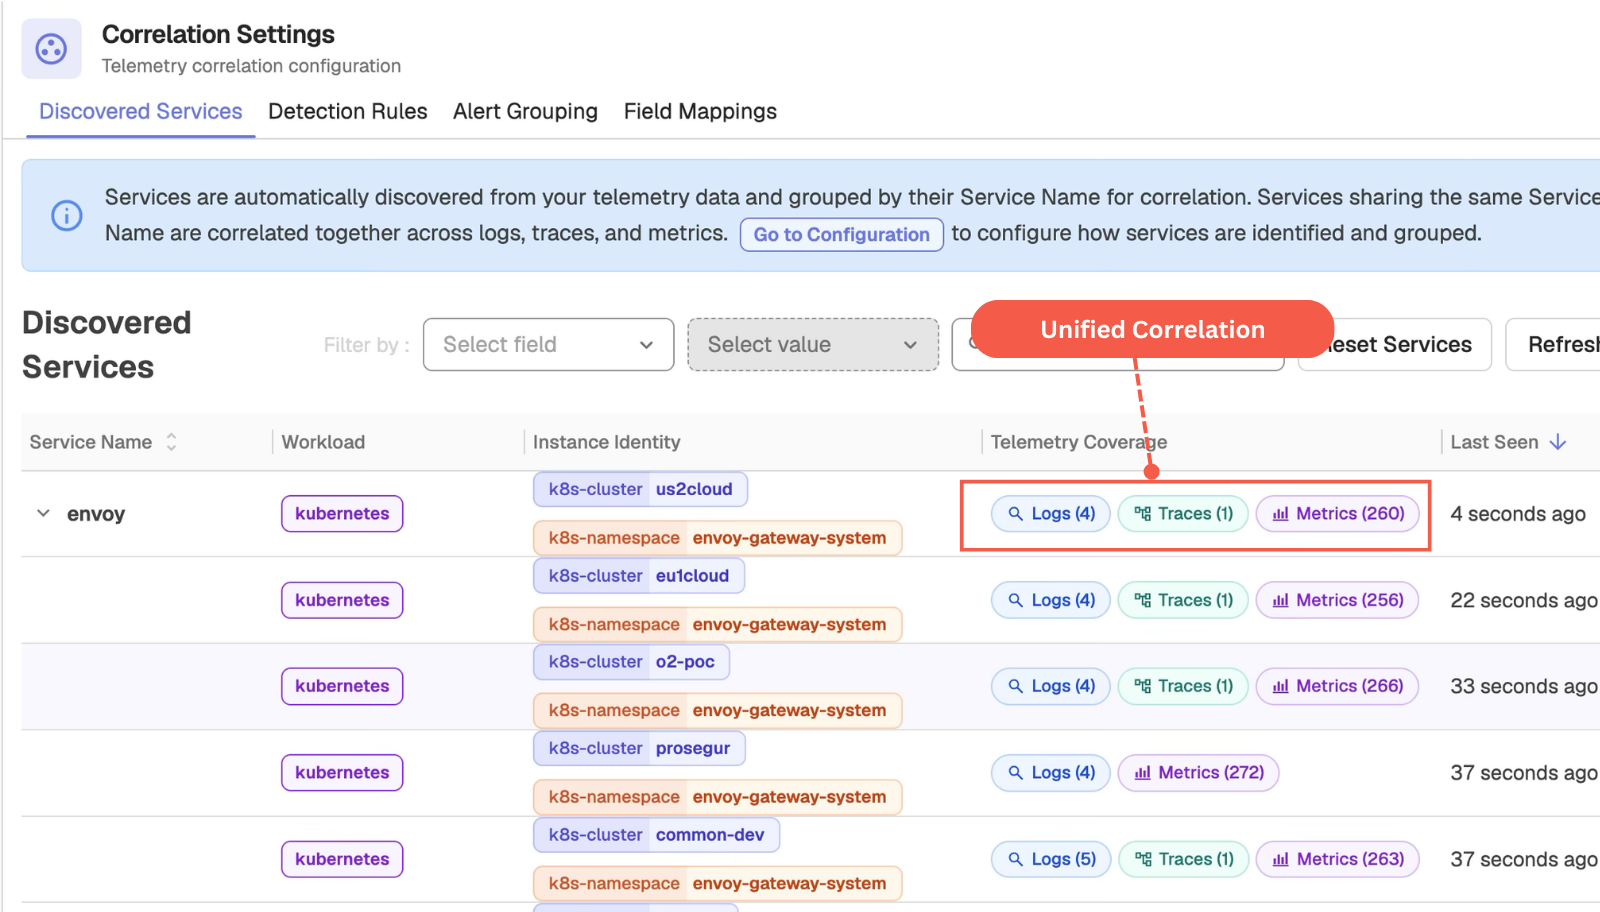
Traces: correlated with logs and metrics by default
Logs, metrics, and traces share one resource model in OpenObserve, so correlation works out of the box. From a slow trace, jump directly to the log lines and metrics from that same request, without copying a trace ID between separate UIs. Explore distributed tracing in OpenObserve or the traces docs.
Dashboards and prebuilt dashboards
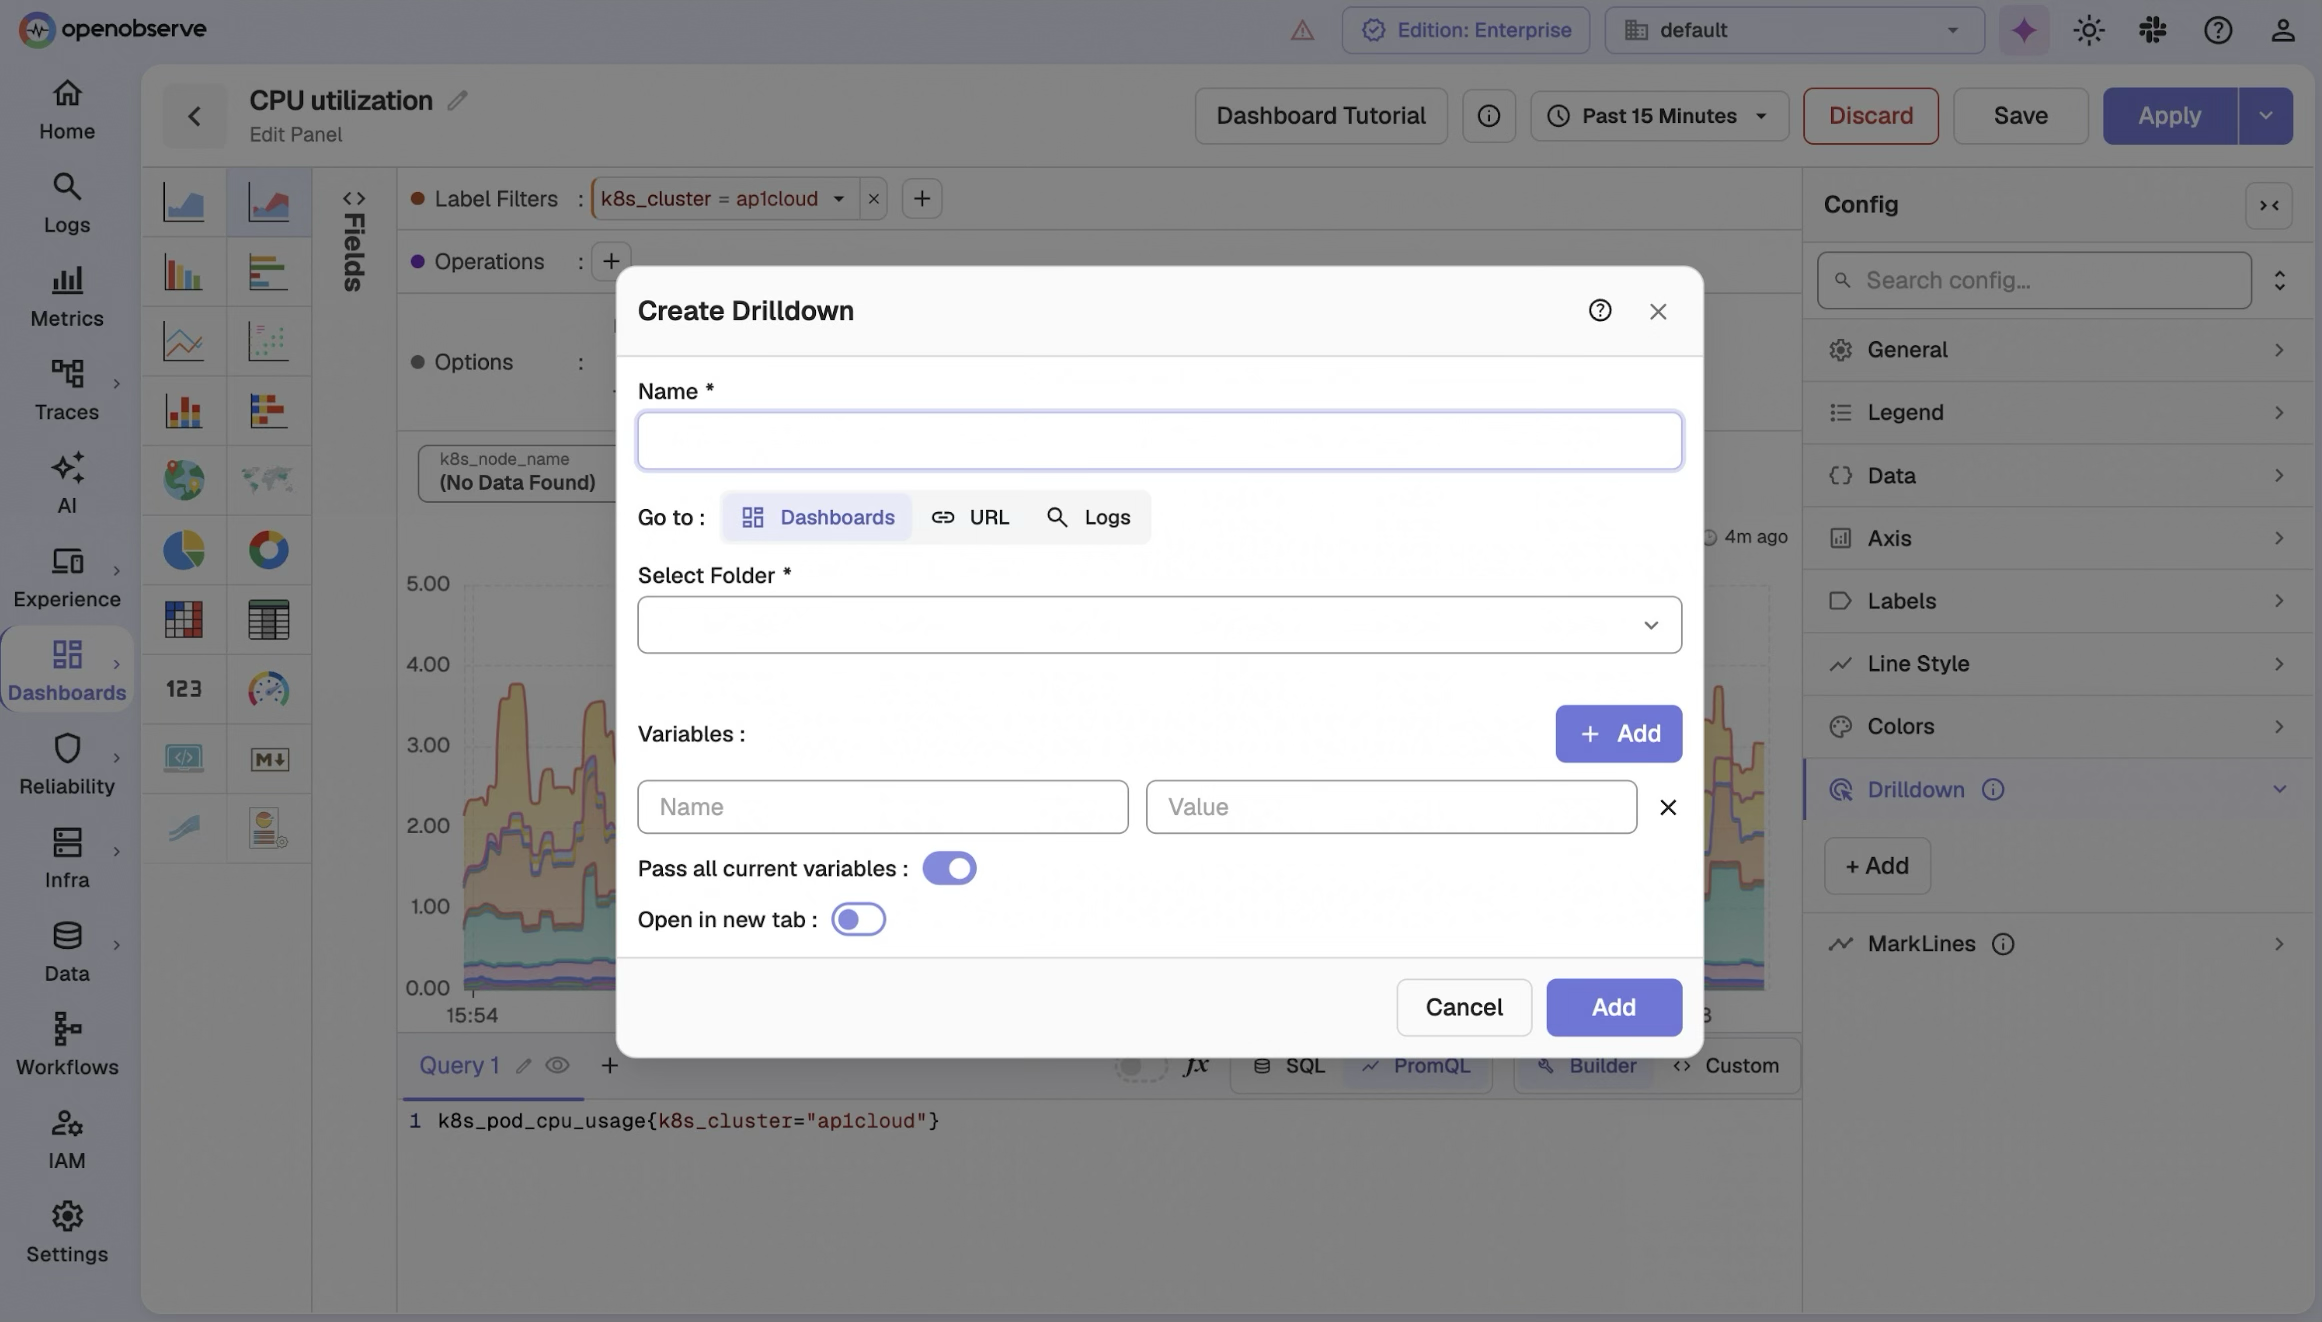
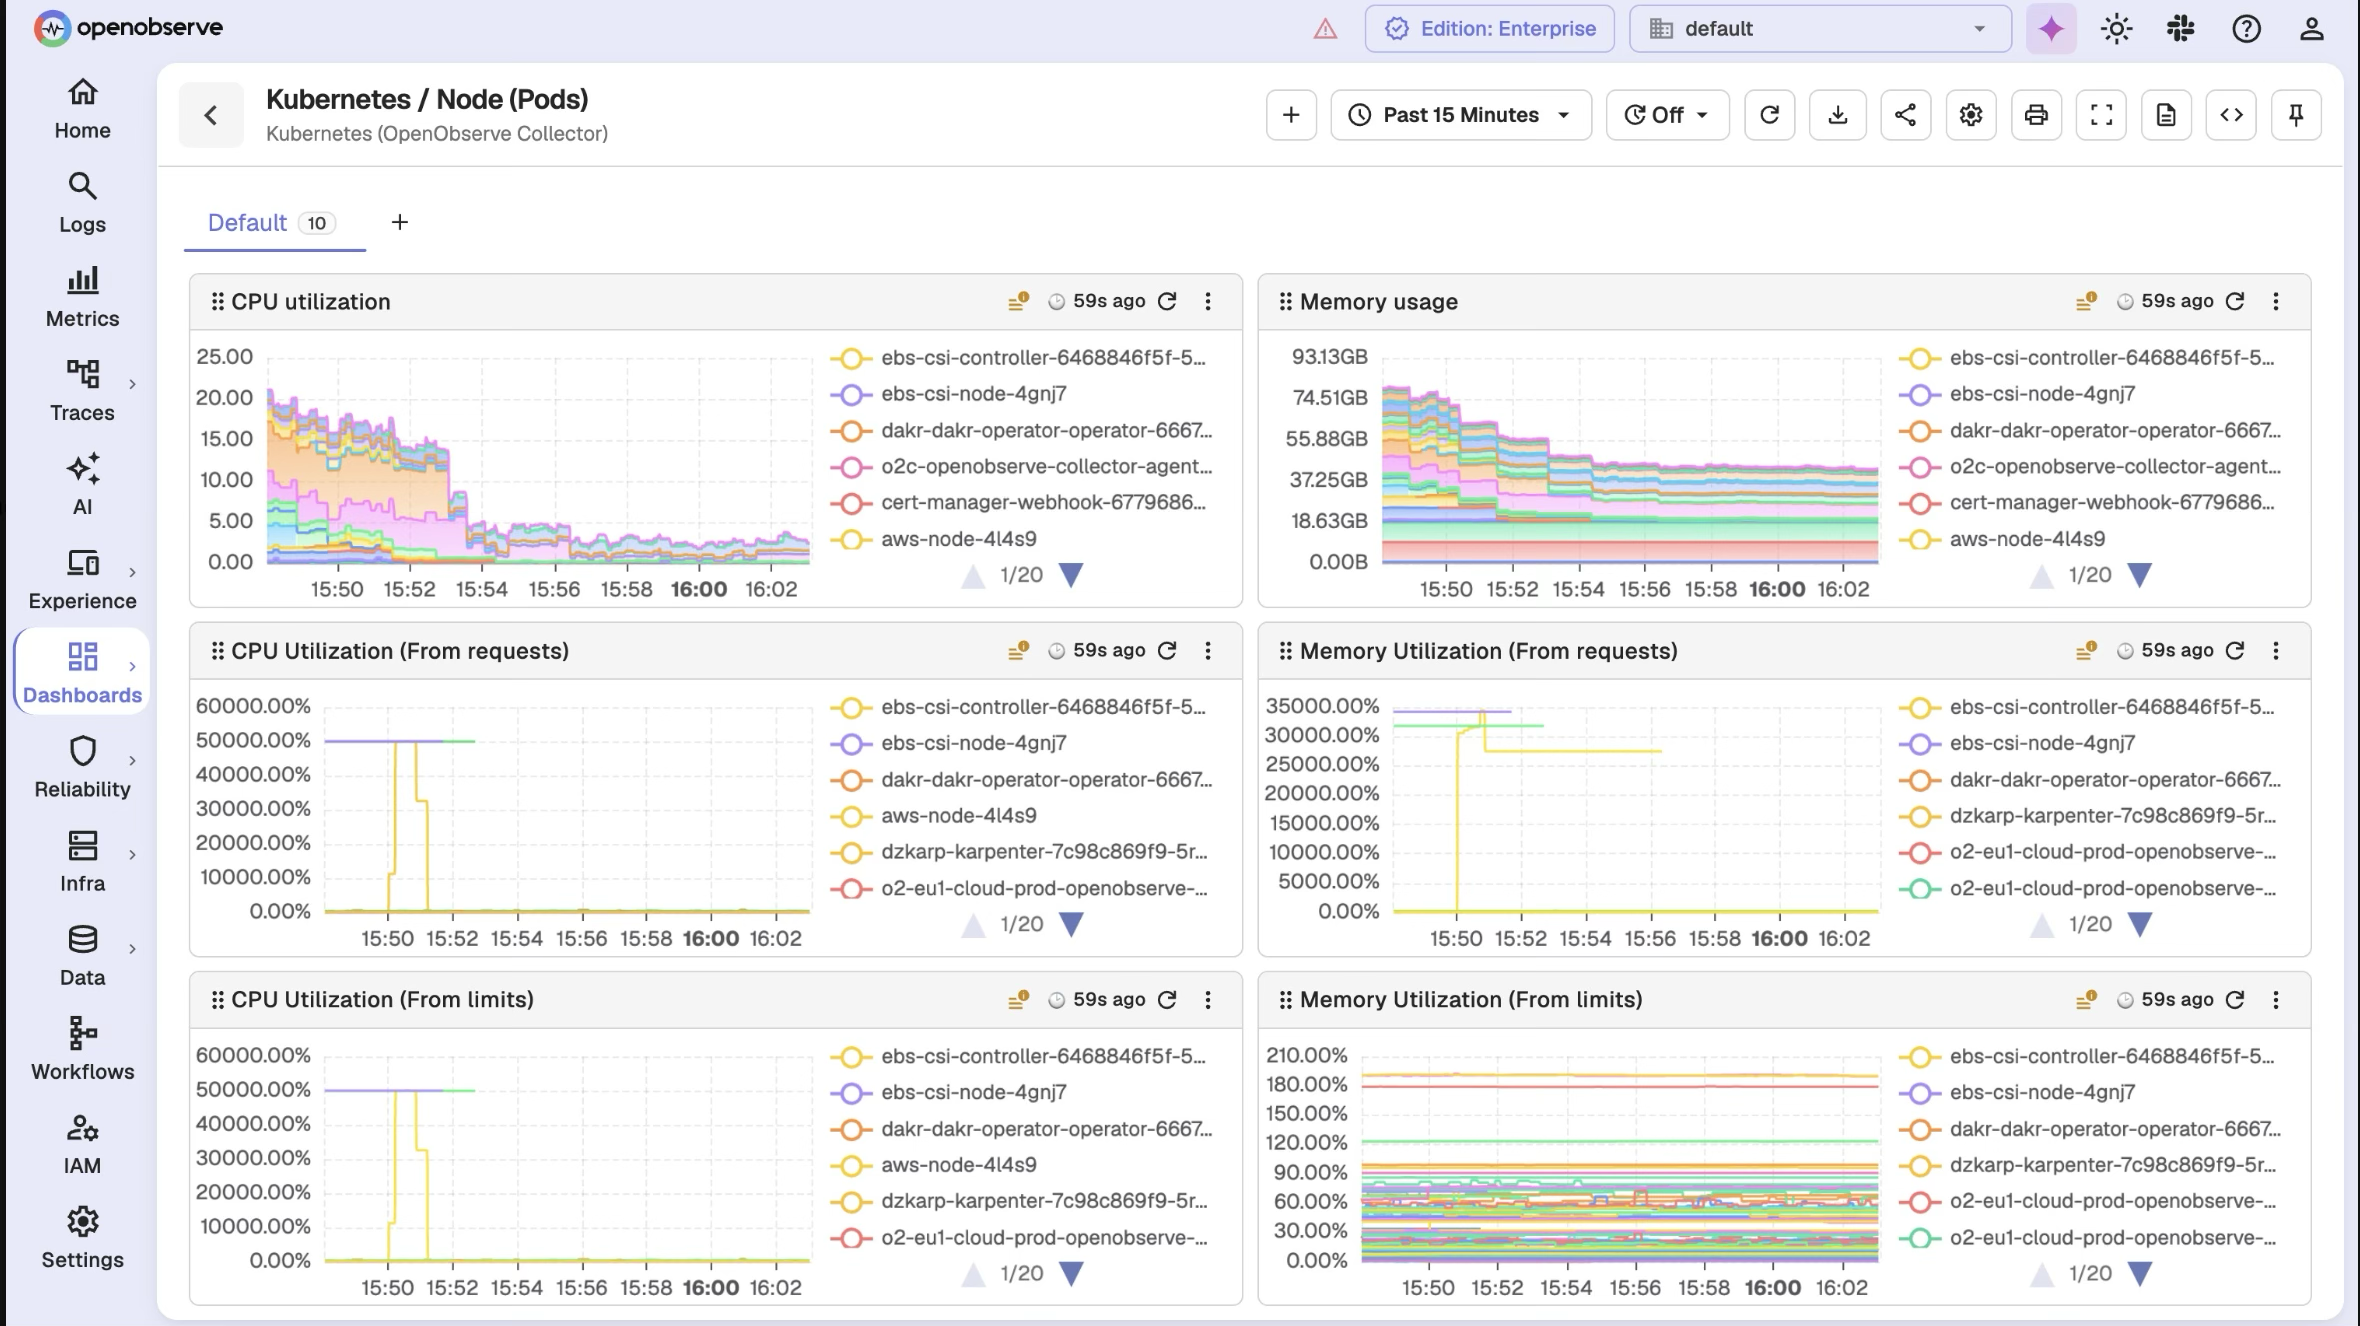
Dashboards are part of the same binary rather than a separately wired front end. Build panels by dragging fields against logs, metrics, and traces using SQL or PromQL, add variables to filter every panel at once, and use drilldowns to jump from a data point into the underlying logs or traces.
You do not have to start from a blank canvas. OpenObserve ships prebuilt dashboards for common sources such as Kubernetes, AWS services, databases, and Docker, which you import as JSON. For your existing Grafana dashboards, the OpenObserve Dashboard Migrator converts Grafana dashboard JSON automatically. See visualization and dashboards for the full chart library and the dashboards docs to build your own.
Pipelines: shape data before it lands
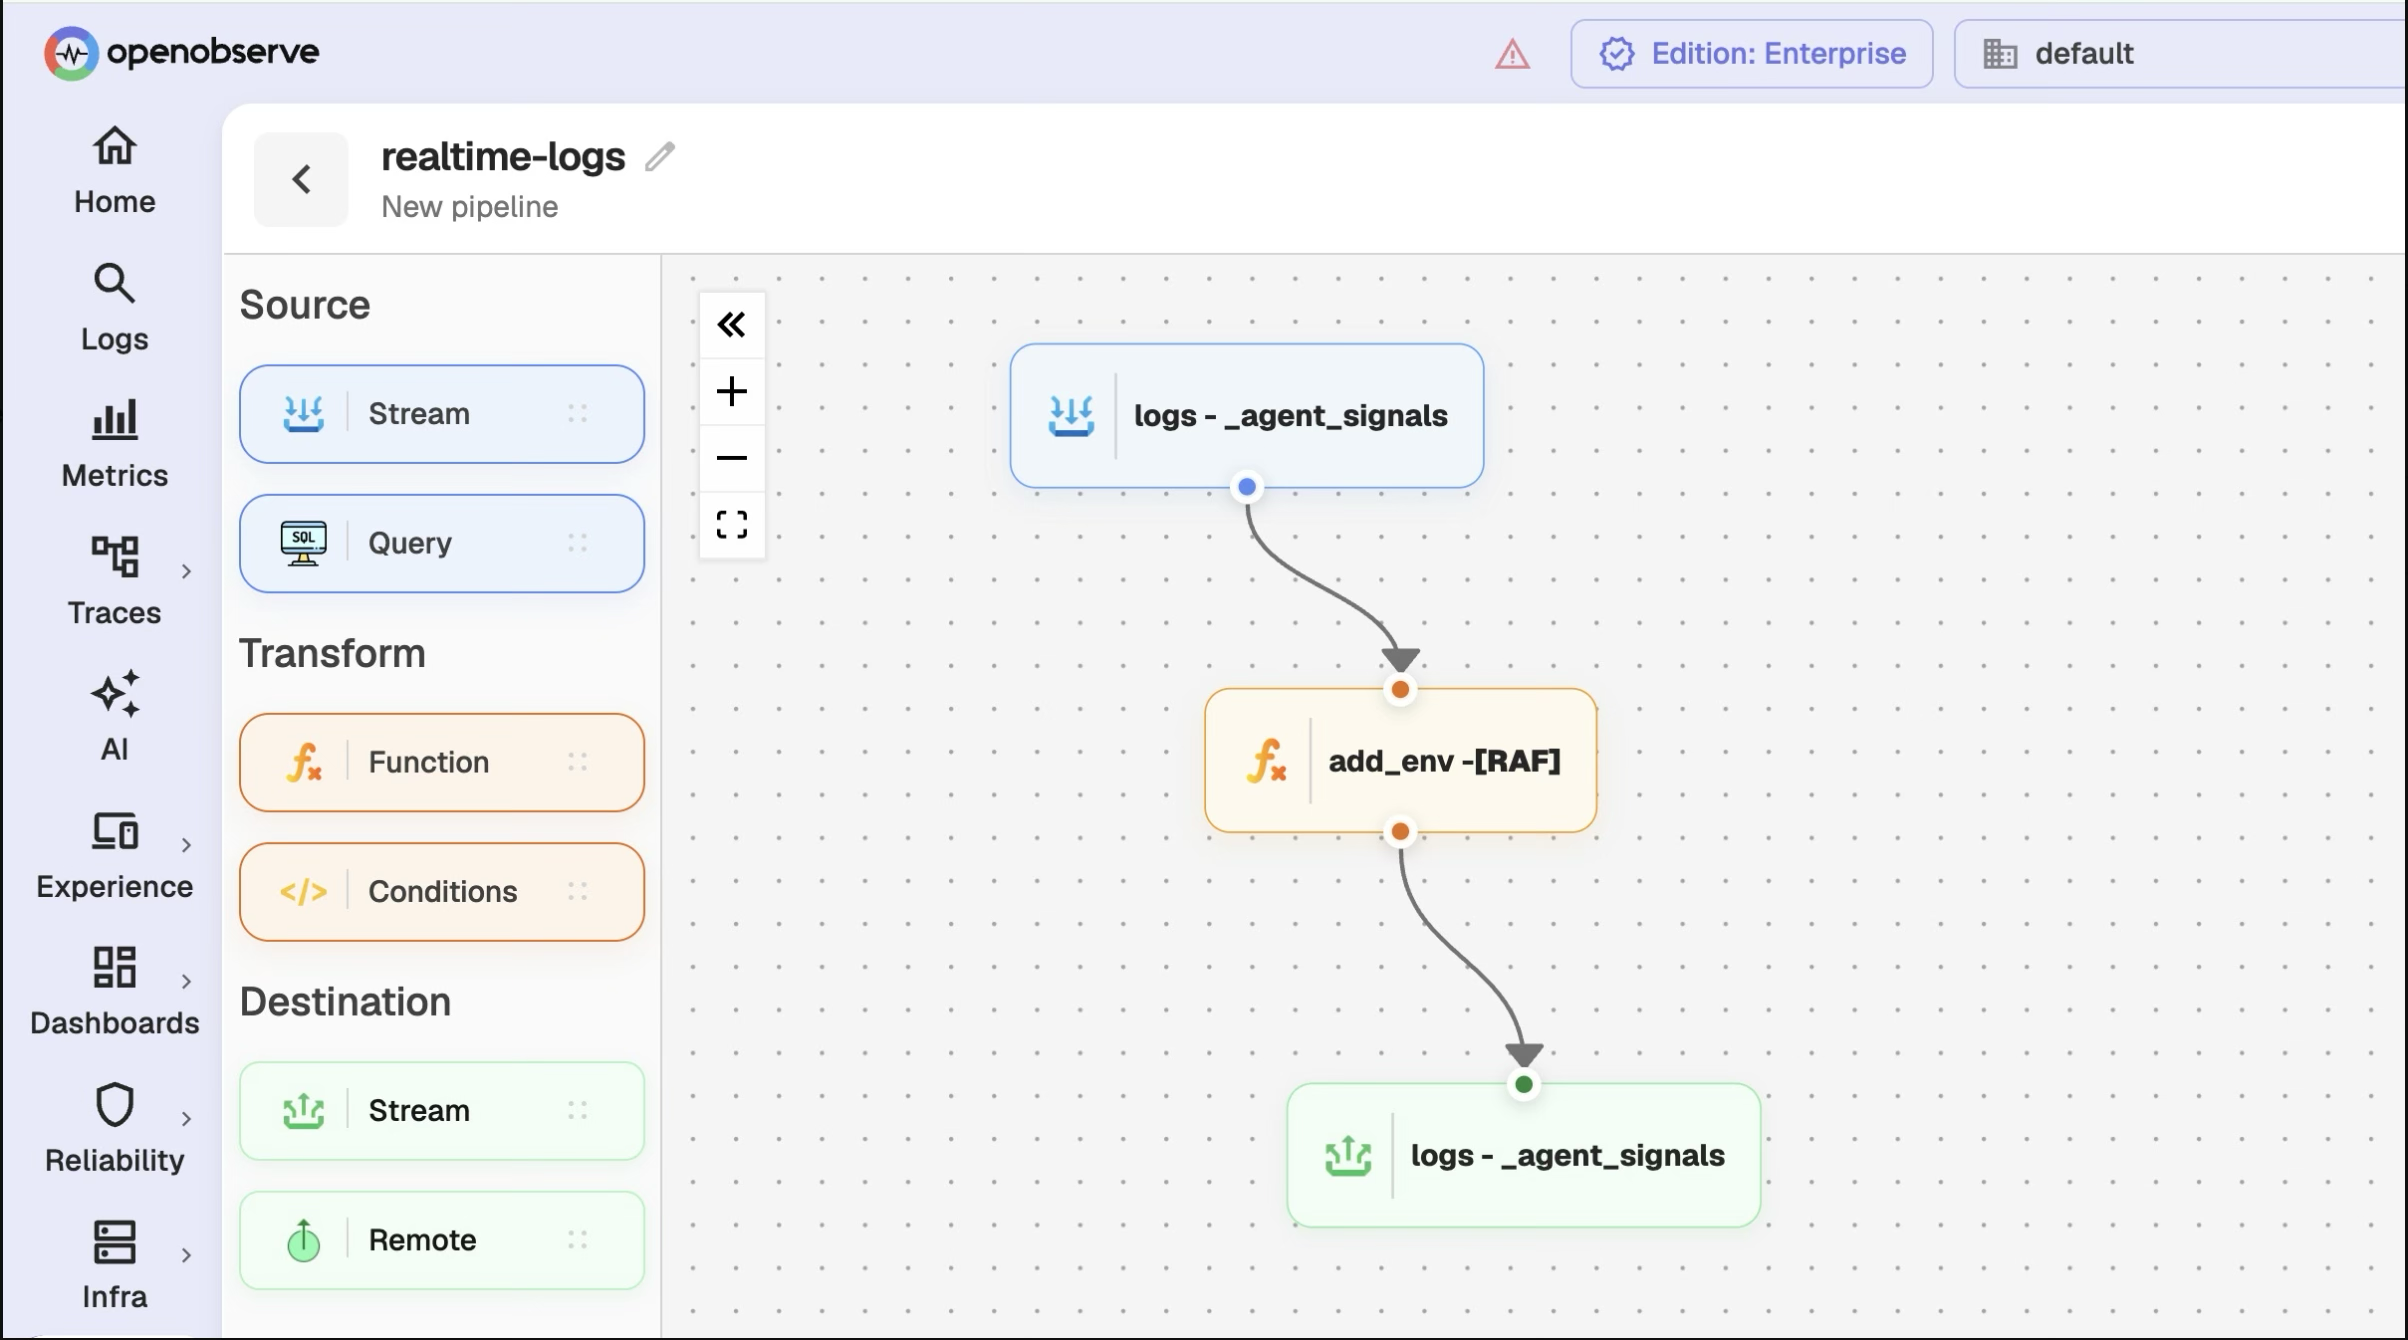
In LGTM, parsing, redaction, and routing live in the collector, configured separately for each backend. OpenObserve has pipelines built into the platform: real-time pipelines that parse, enrich, redact, and route data as it arrives, and scheduled pipelines that aggregate data on a timer (for example, turning logs into metrics). Pipelines use VRL functions, CSV enrichment tables, and conditions, built in a visual editor. See the pipelines docs.
Real user monitoring (RUM) and session replay
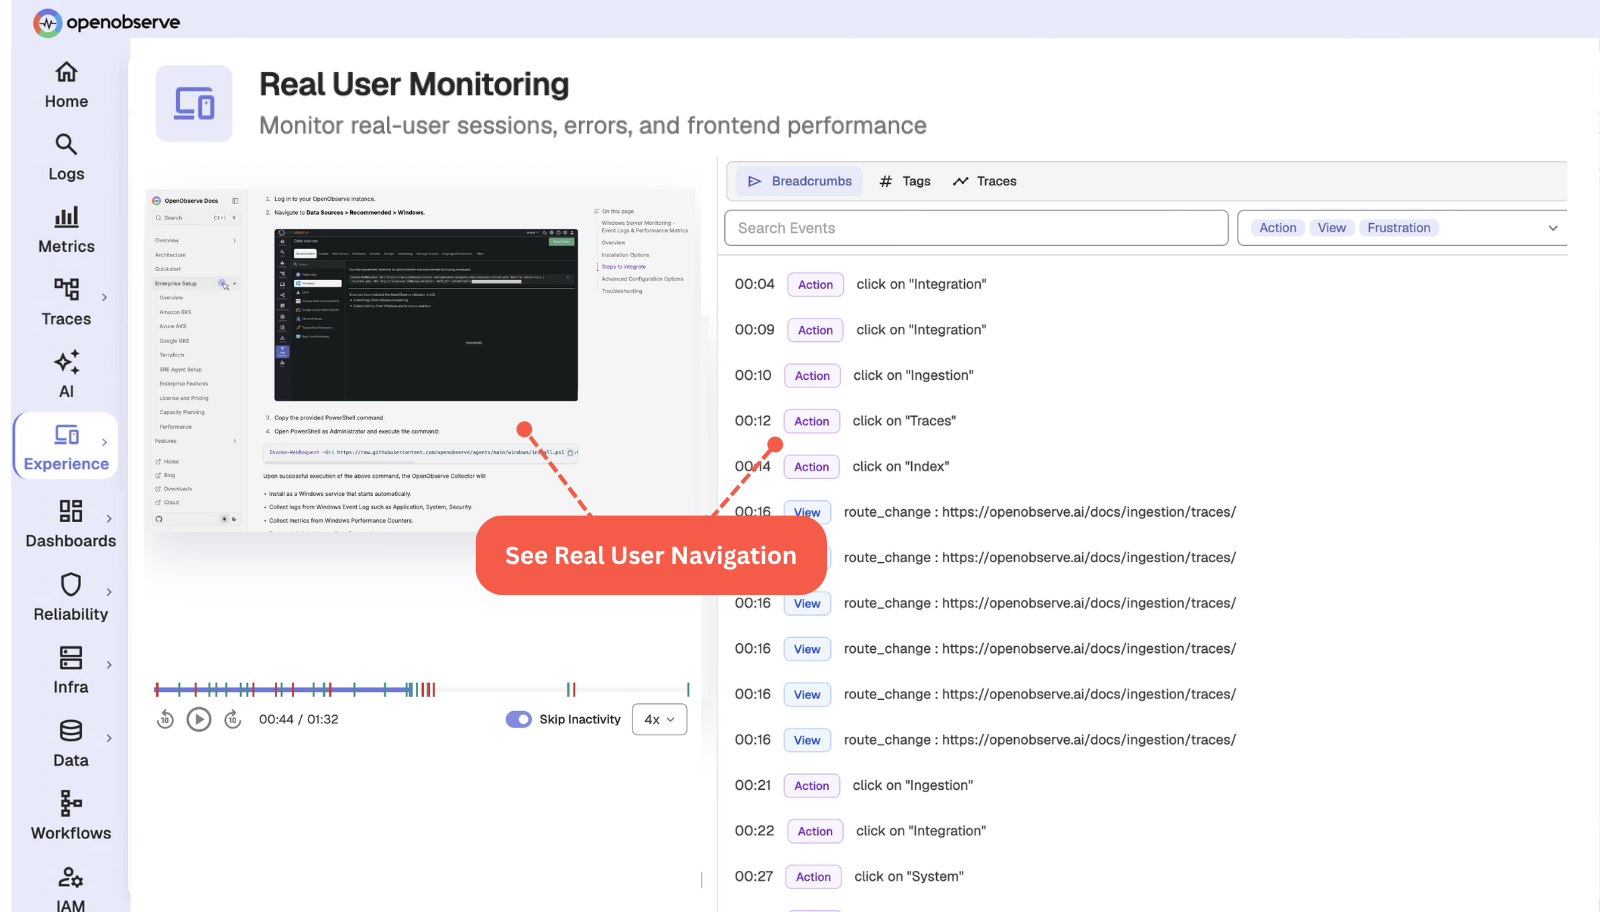
OpenObserve captures frontend telemetry natively: session replay with privacy masking, Core Web Vitals (LCP, INP, CLS), and JavaScript error detection, all queryable with SQL and correlated against backend traces and logs in the same store. In the Grafana ecosystem, the equivalent backend is a separate Grafana Cloud product. See the RUM docs or the hands-on Datadog vs OpenObserve RUM comparison.
Synthetic monitoring
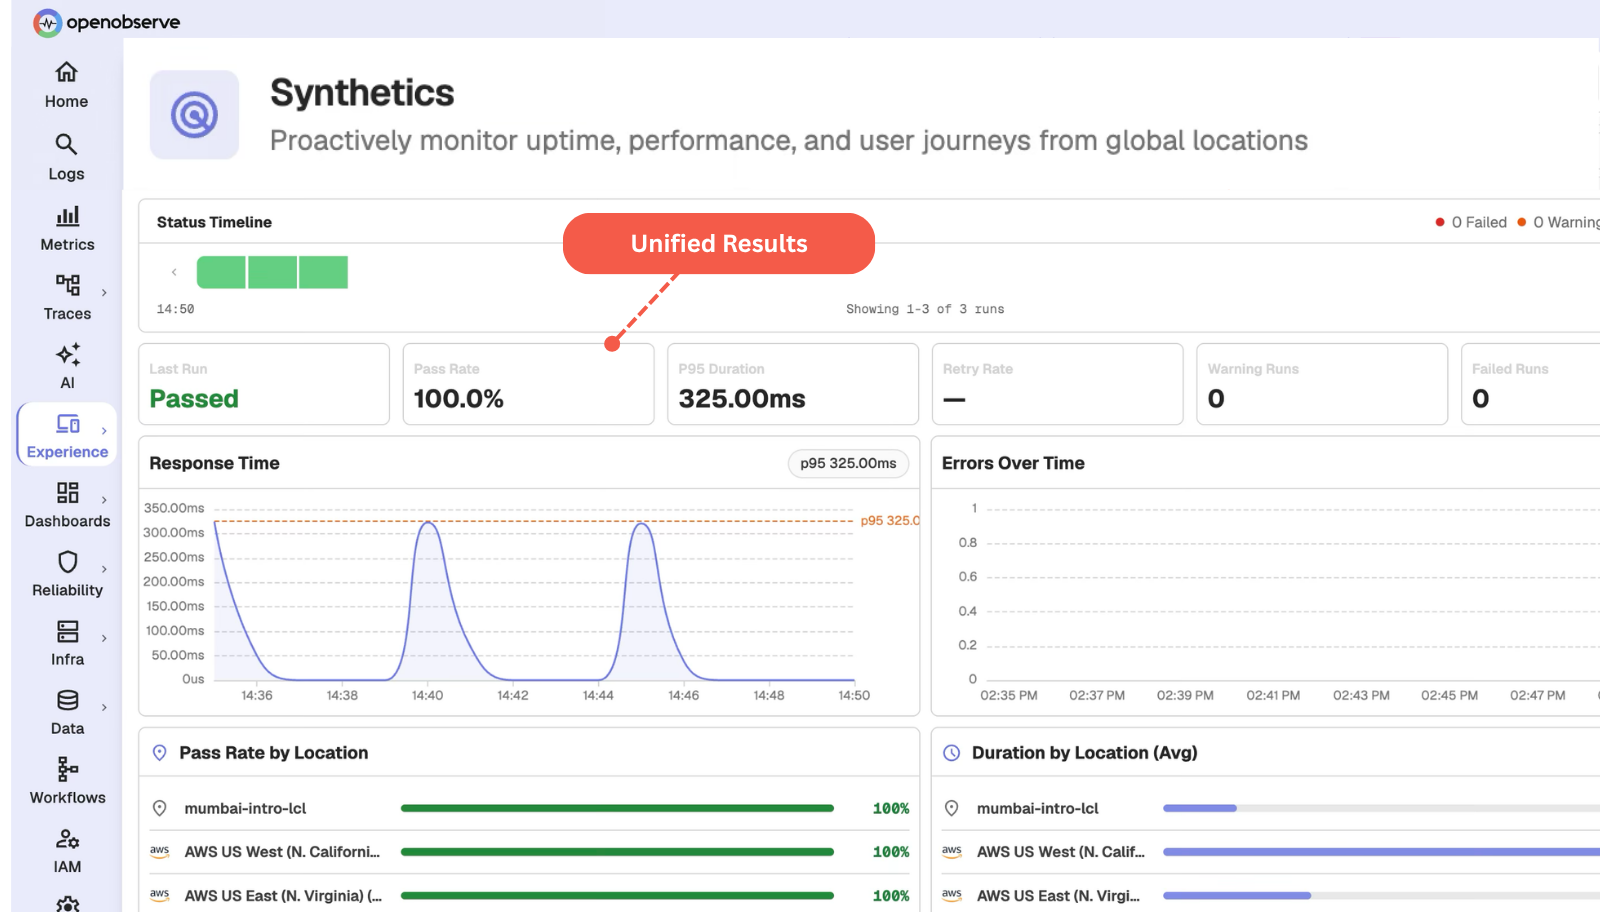
Scheduled API checks, TLS checks, and real Playwright browser checks run from multiple regions, with every result landing next to your logs, metrics, and traces instead of in a separate synthetic monitoring silo. Synthetics is currently in Beta on OpenObserve Cloud; self-hosted support is not yet available. See synthetic monitoring, the synthetics docs, or how it compares in the top synthetic monitoring tools in 2026.
Alerts
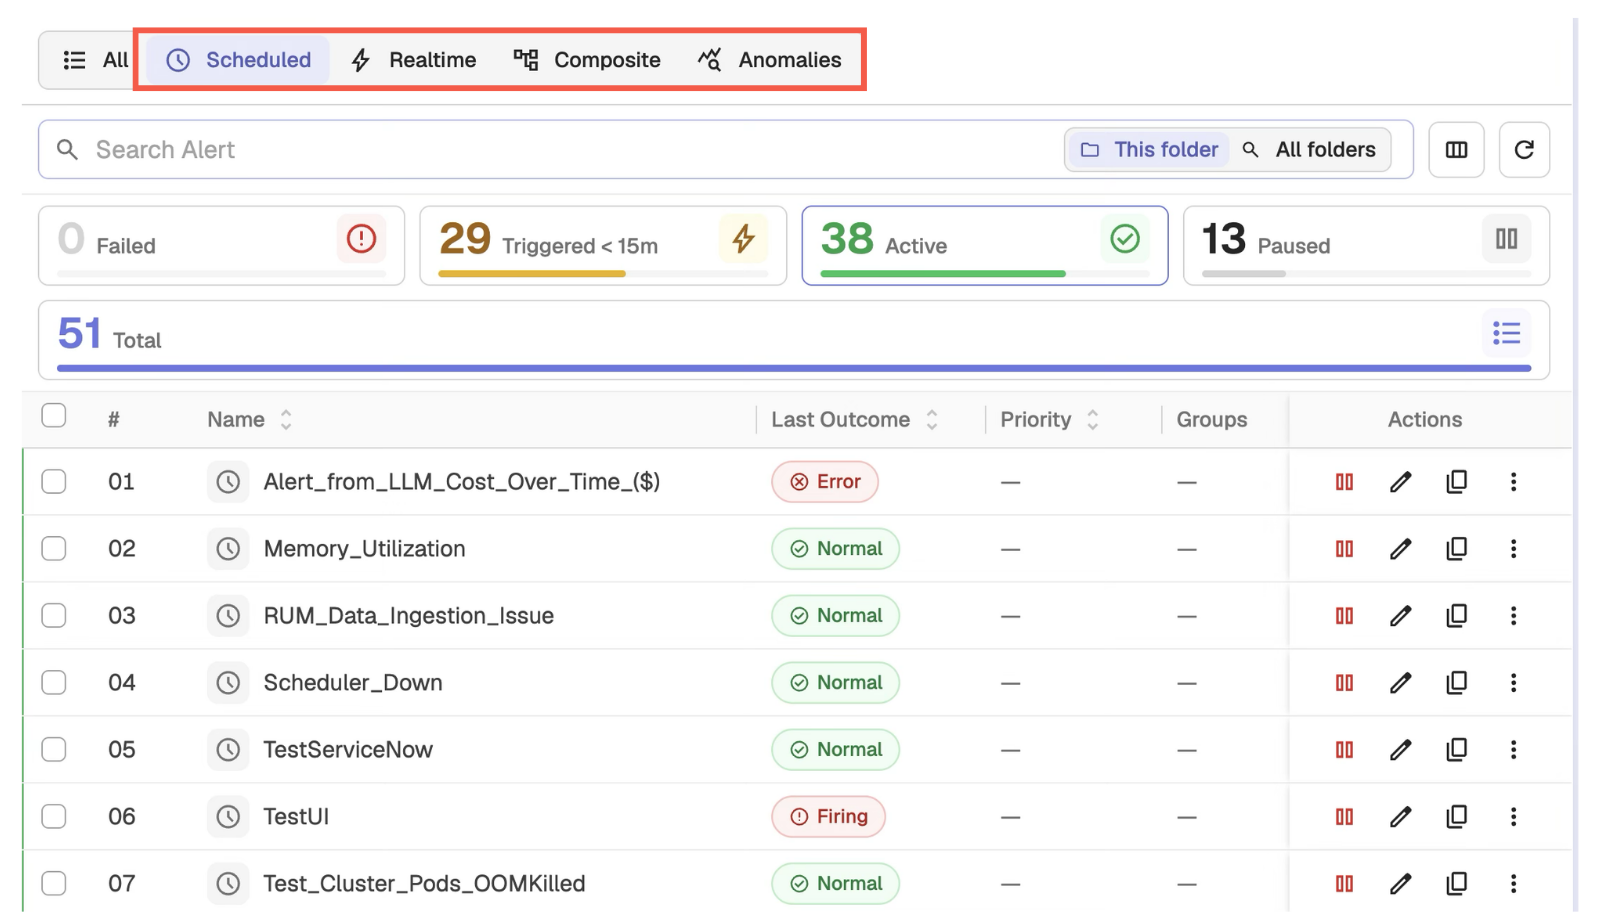
OpenObserve alerts use SQL for logs and traces and PromQL for metrics, run in real time or on a schedule, and deliver to Slack, email, PagerDuty-style webhooks, and more. Aggregation windows and silence periods cut noise, and ML-based anomaly detection catches unusual patterns without hand-tuned thresholds. Instead of spreading rules across Grafana Alerting and separate Loki and Mimir rulers, every alert lives in one place. See the alerts docs.
Incidents
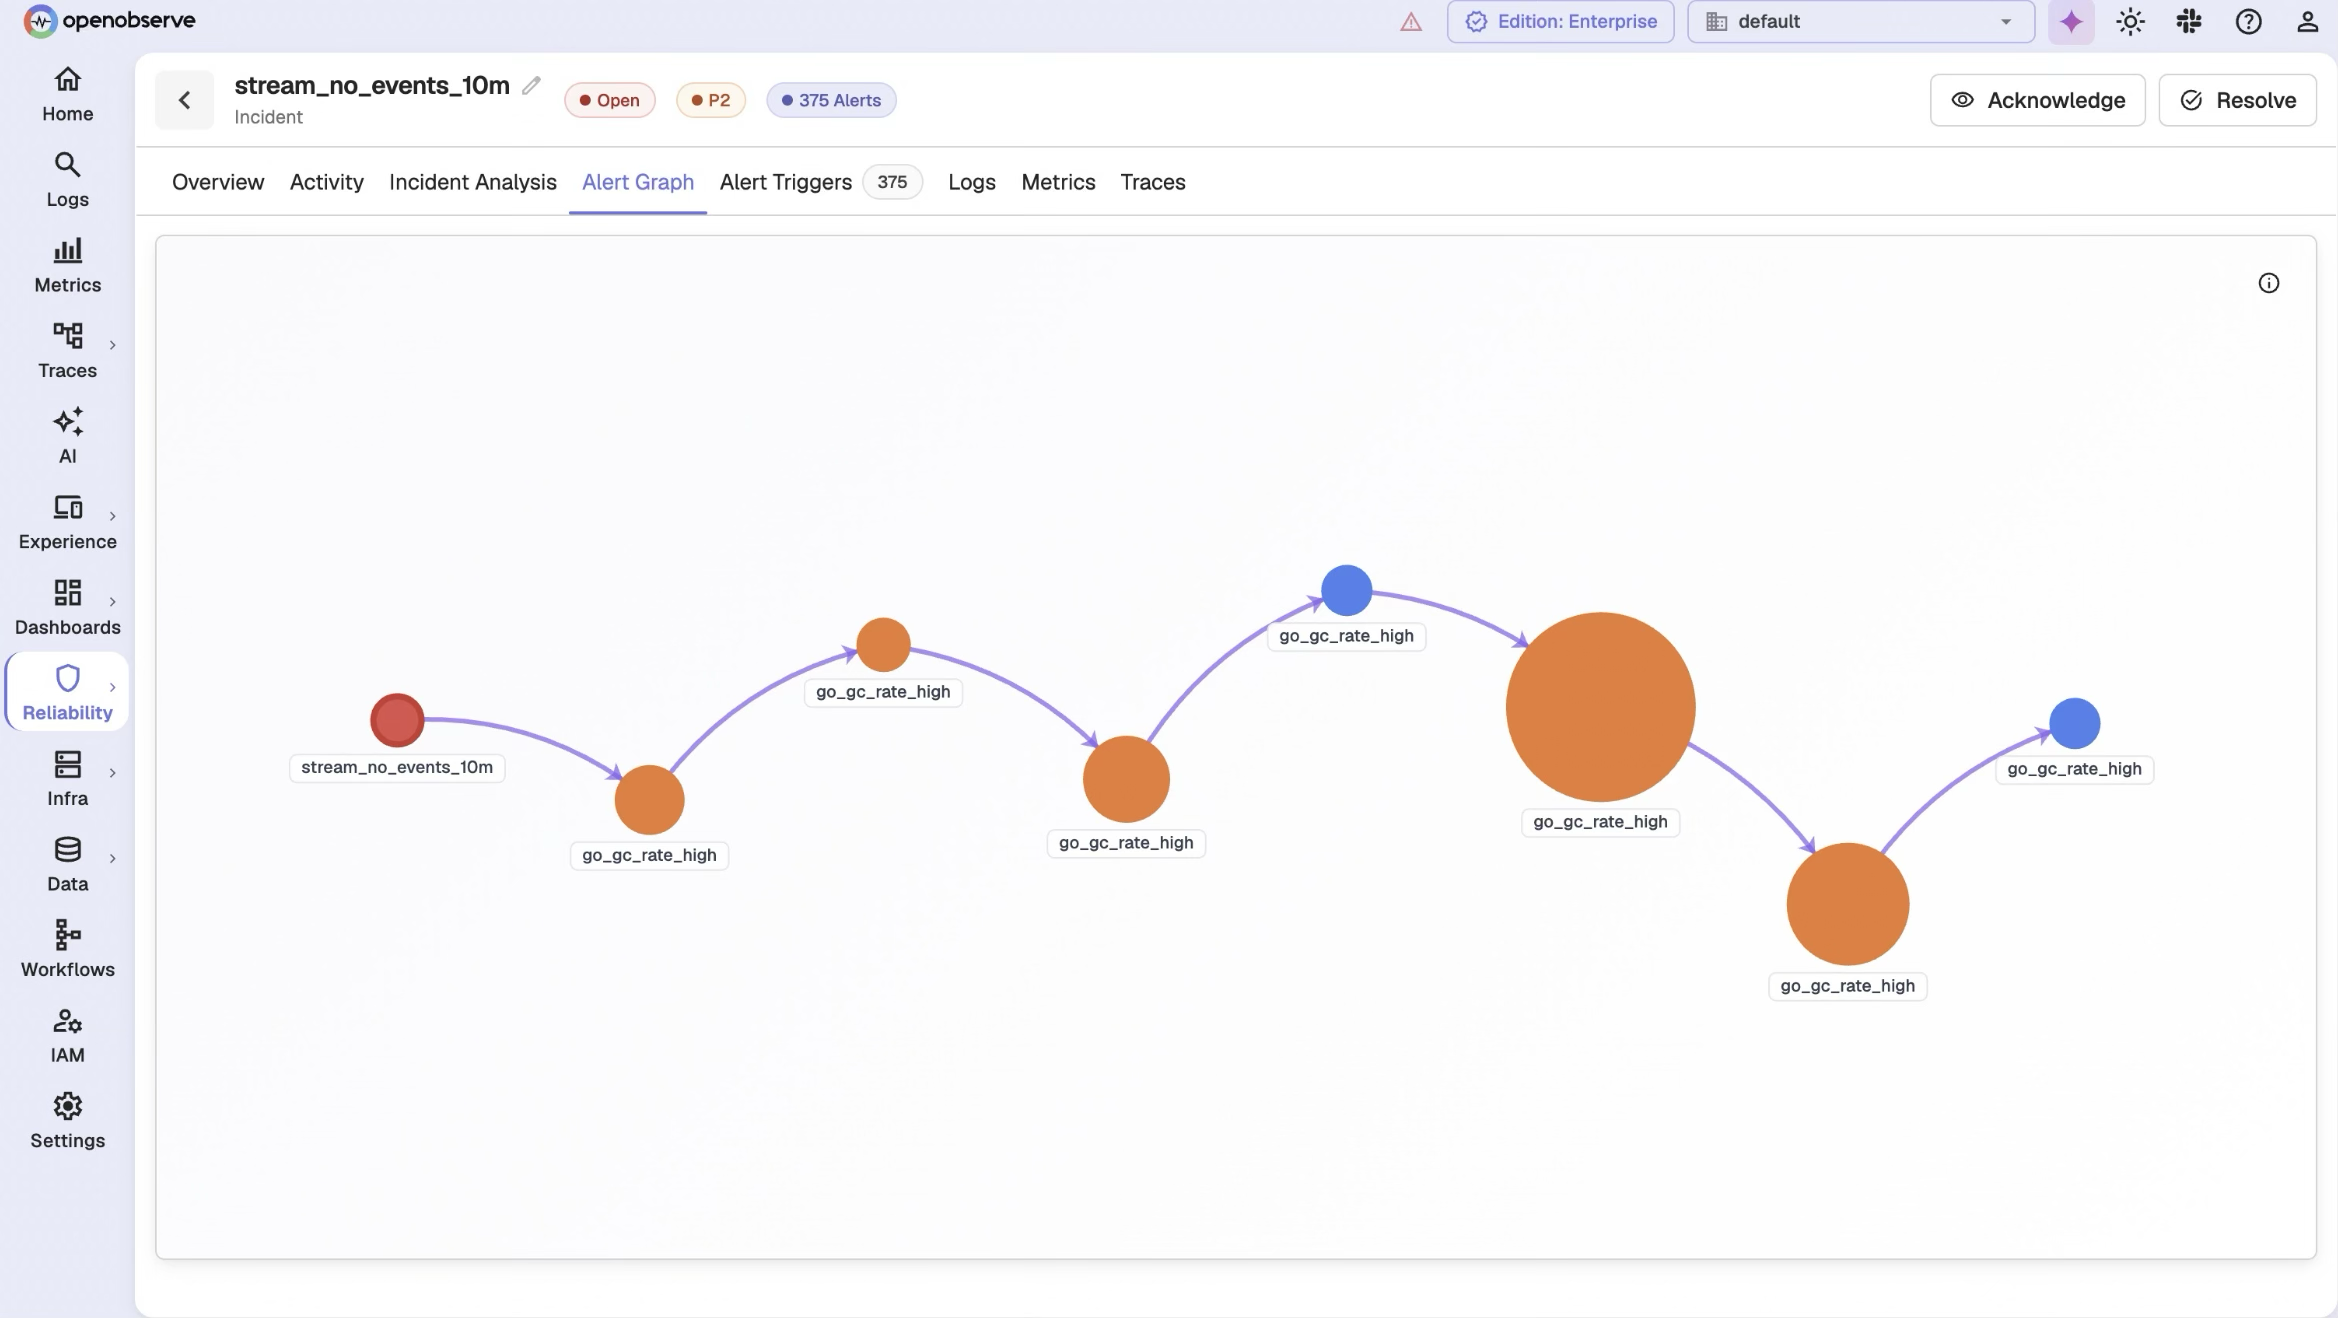
When an alert is set to create incidents, OpenObserve groups related firings into a single incident using shared dimensions such as service, cluster, and namespace. Each incident has an overview dashboard, an alert graph that highlights likely root-cause alerts, correlated logs, metrics, and traces filtered to the incident window, and an activity timeline for collaboration. Notifications fire when an incident is created or escalates, not on every repeat alert. See the incidents docs.
SLOs and error budgets
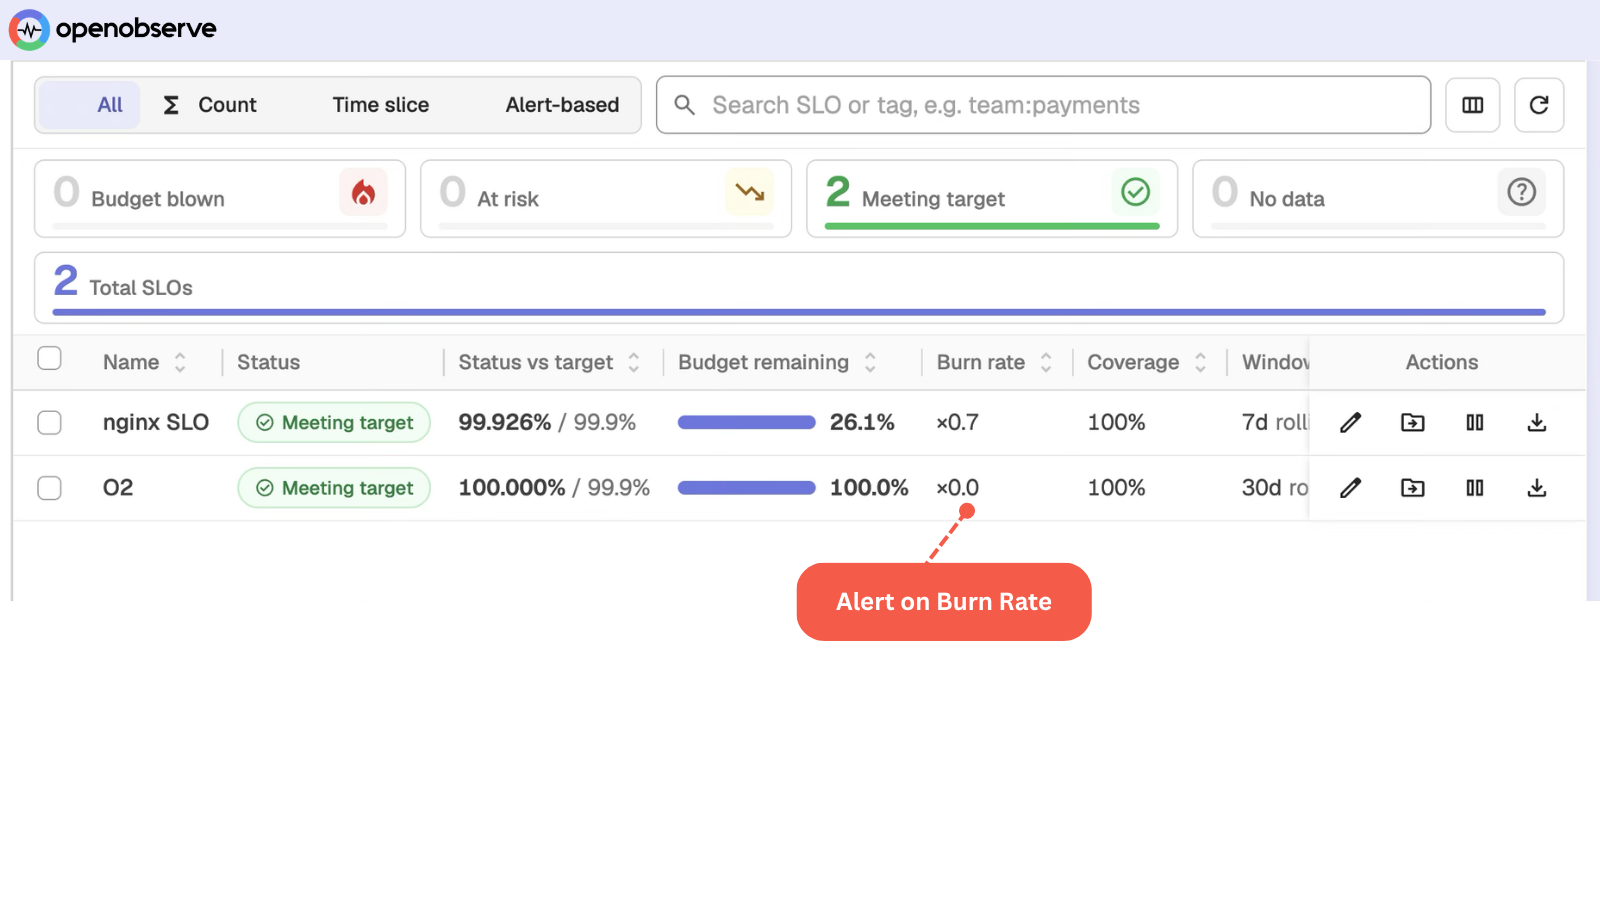
OpenObserve SLOs let you define "good" as a query, pick a target, and get an error budget for the difference, on the same engine that already holds your logs, metrics, and traces. Burn-rate alerts use a long and a short window, so they page on sustained damage and resolve when the incident does. You can group an SLO by region, endpoint, or tenant and get a separate budget per group. Read the SLOs launch notes or the SLO docs for details.
AI SRE agent
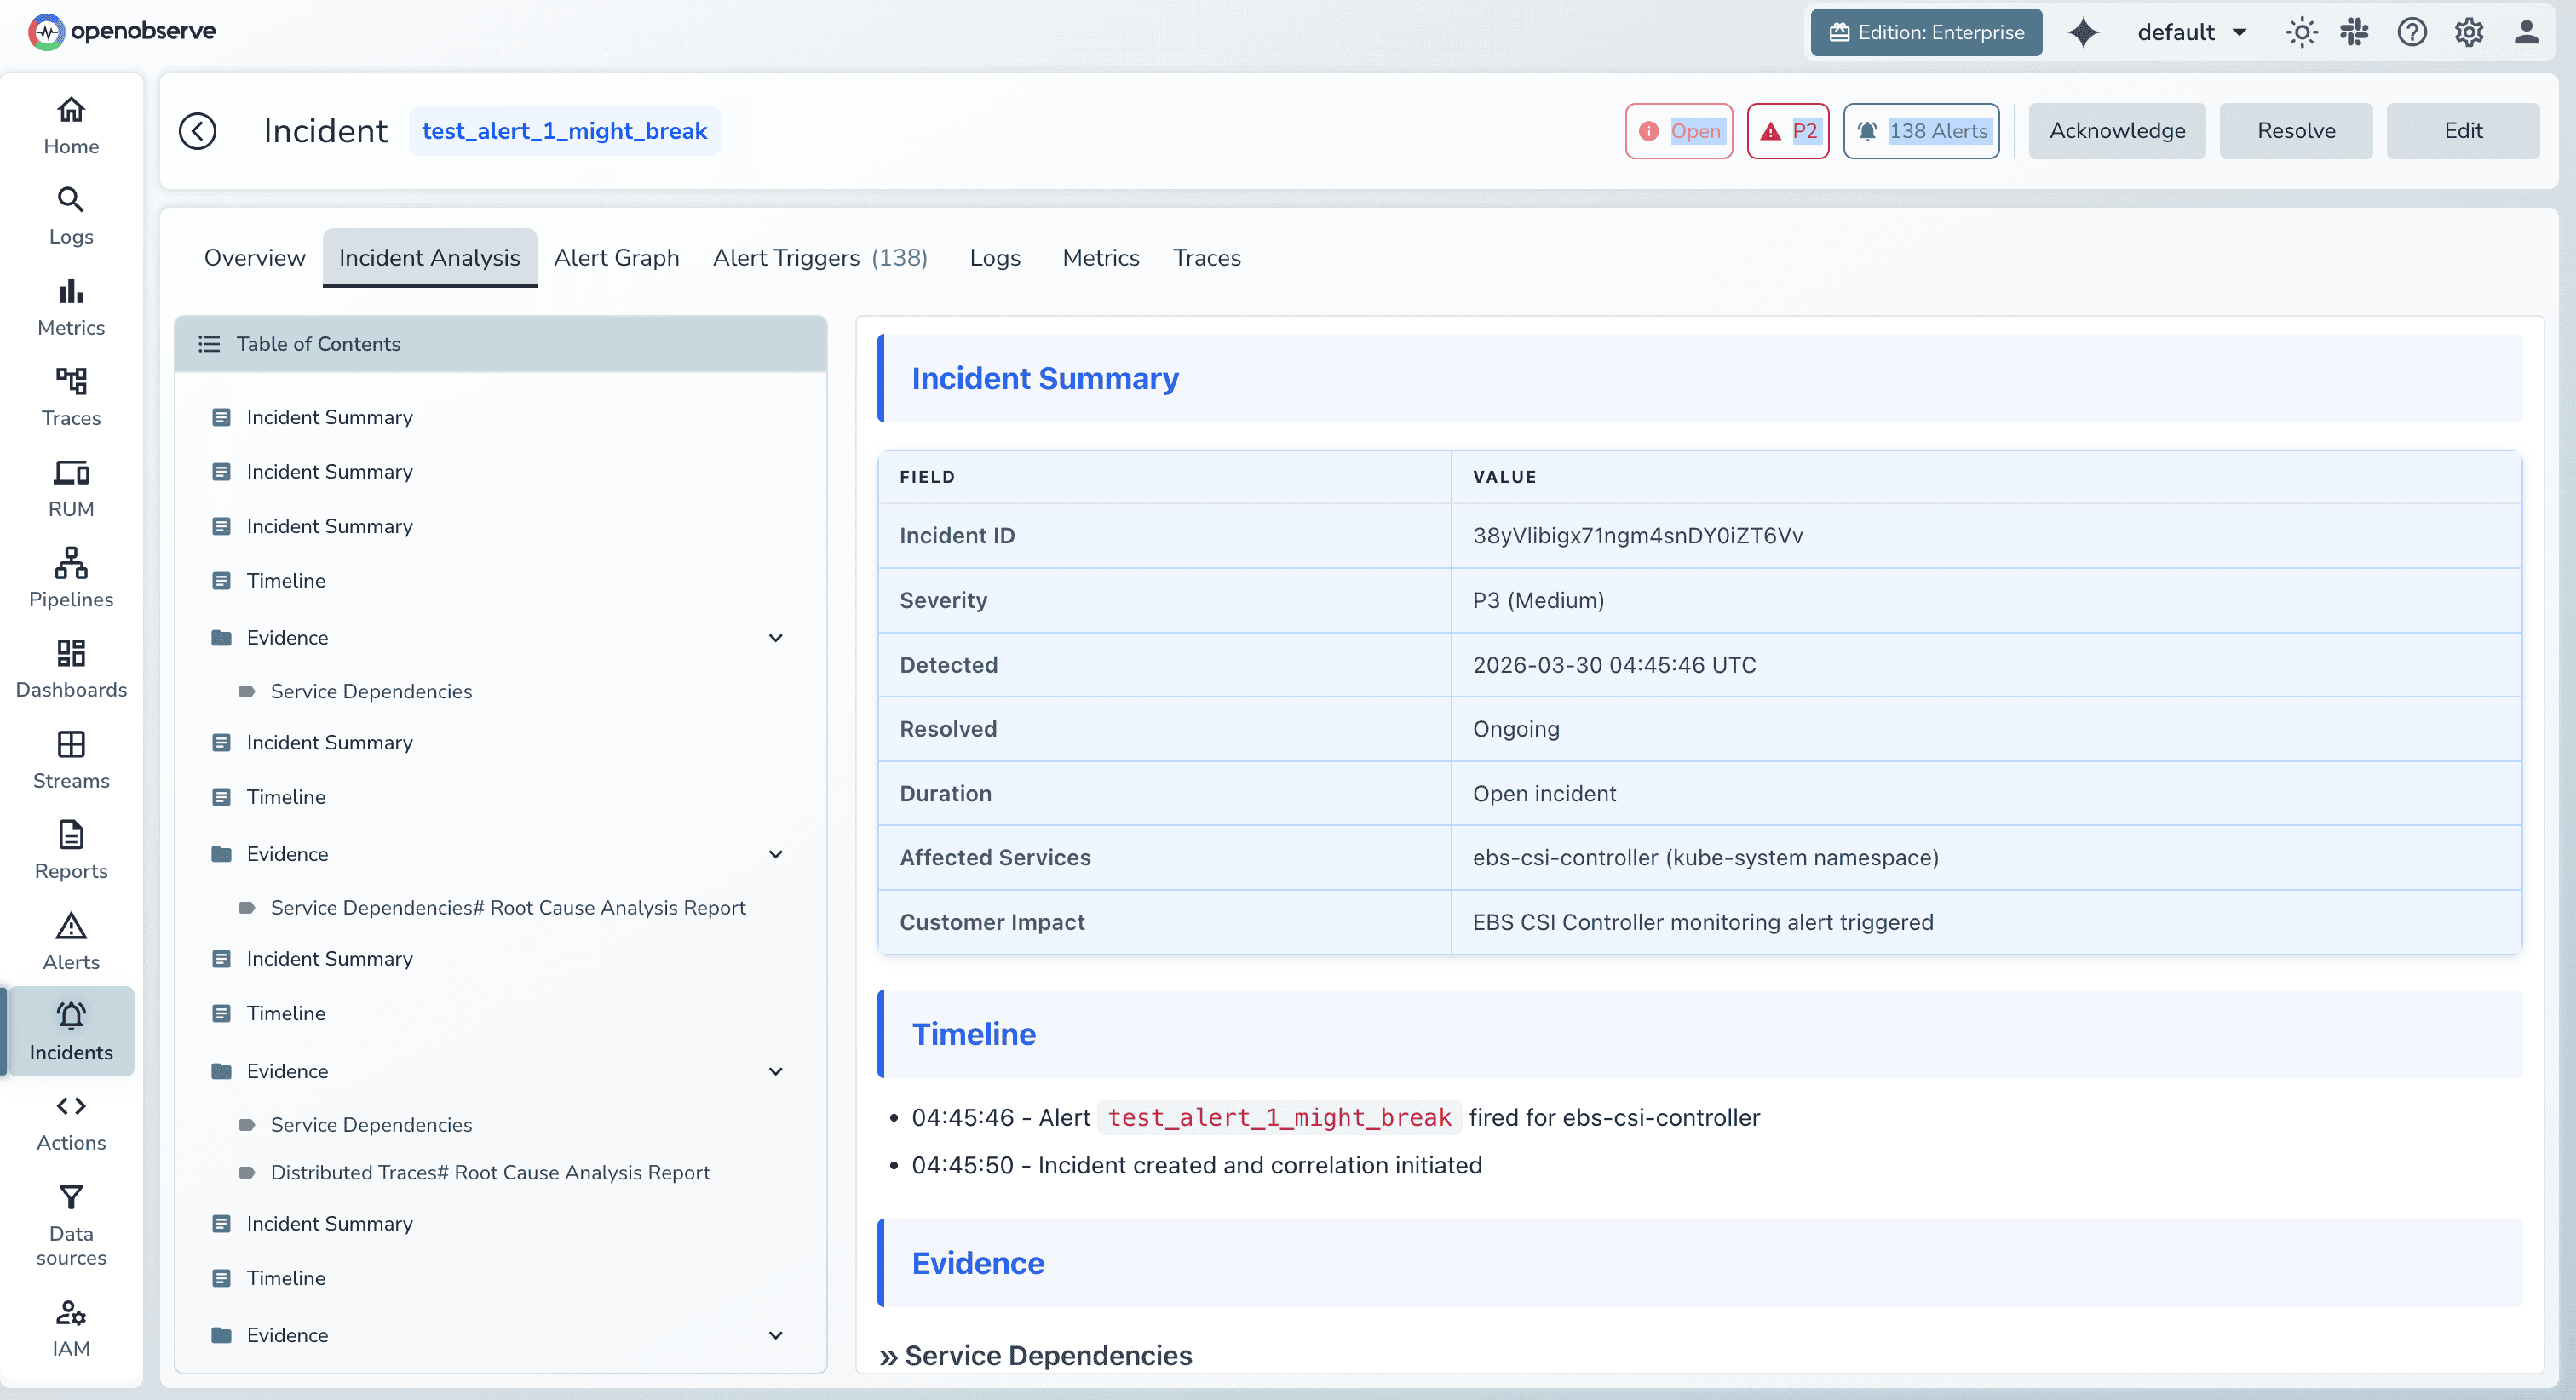
The AI SRE agent starts investigating the moment an incident is created: it queries the correlated logs, metrics, and traces, follows service dependencies, compares against past incidents, and writes a structured root cause analysis with the evidence it used. You bring your own LLM provider (or a self-hosted model), so telemetry can stay inside your infrastructure. Our guide to AI incident management and automated root cause analysis covers the approach in depth, and the AI SRE agent docs cover setup.
AI Assistant
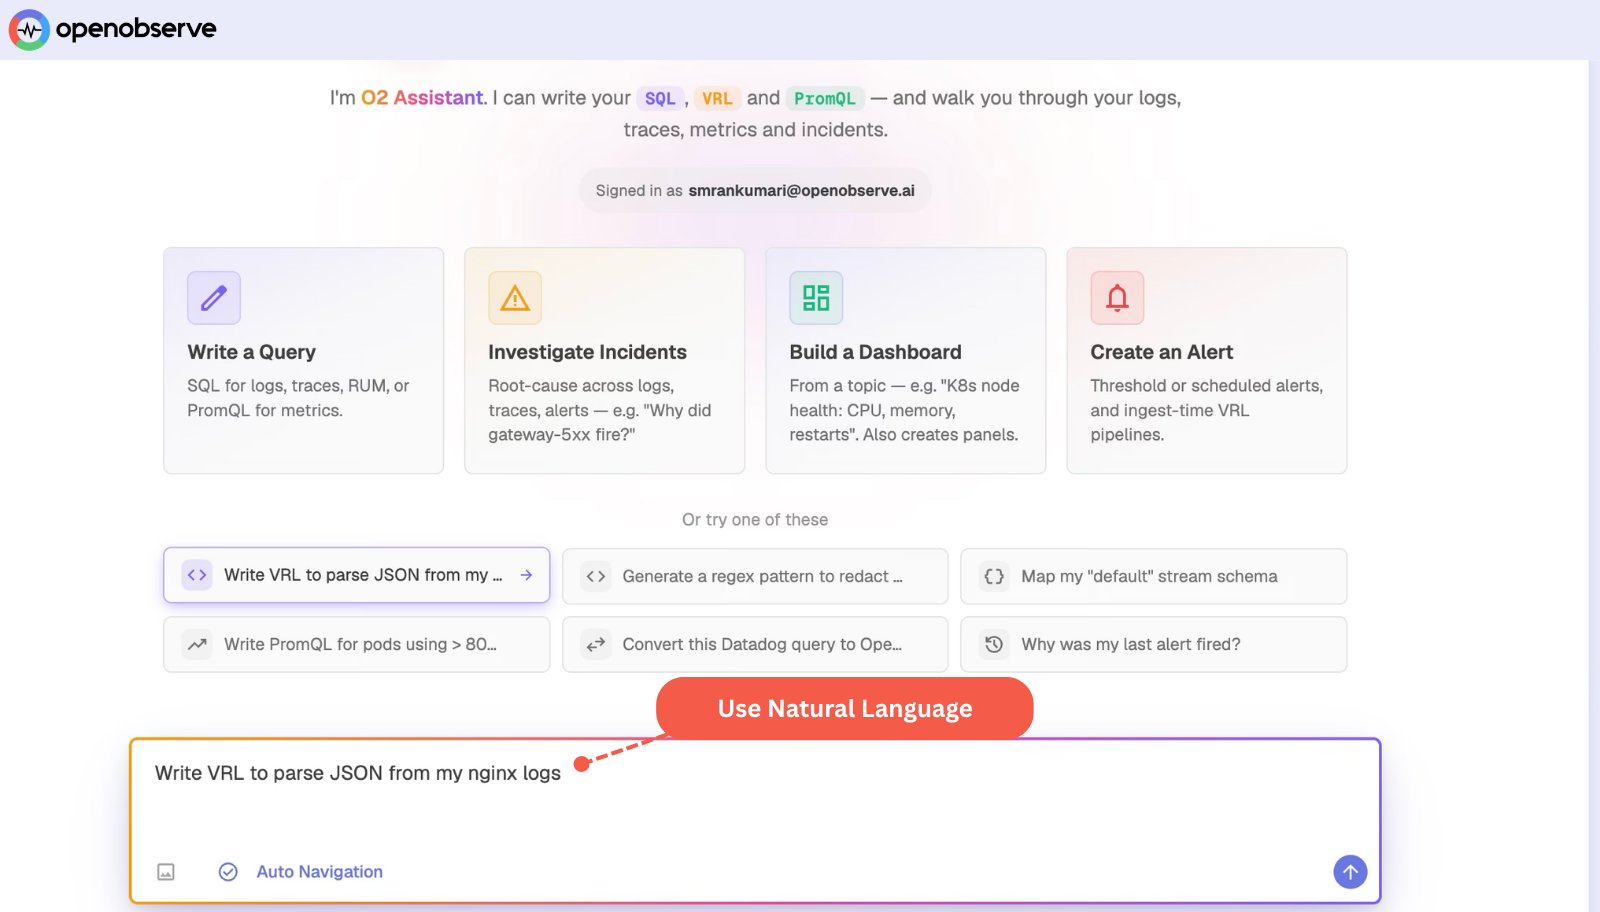
The AI Assistant turns plain-English requests into real SQL, PromQL, or VRL queries, dashboards, and alerts grounded in your actual data. It is context-aware: on the traces page, for example, it picks up the current stream, time range, and selected trace.
MCP server
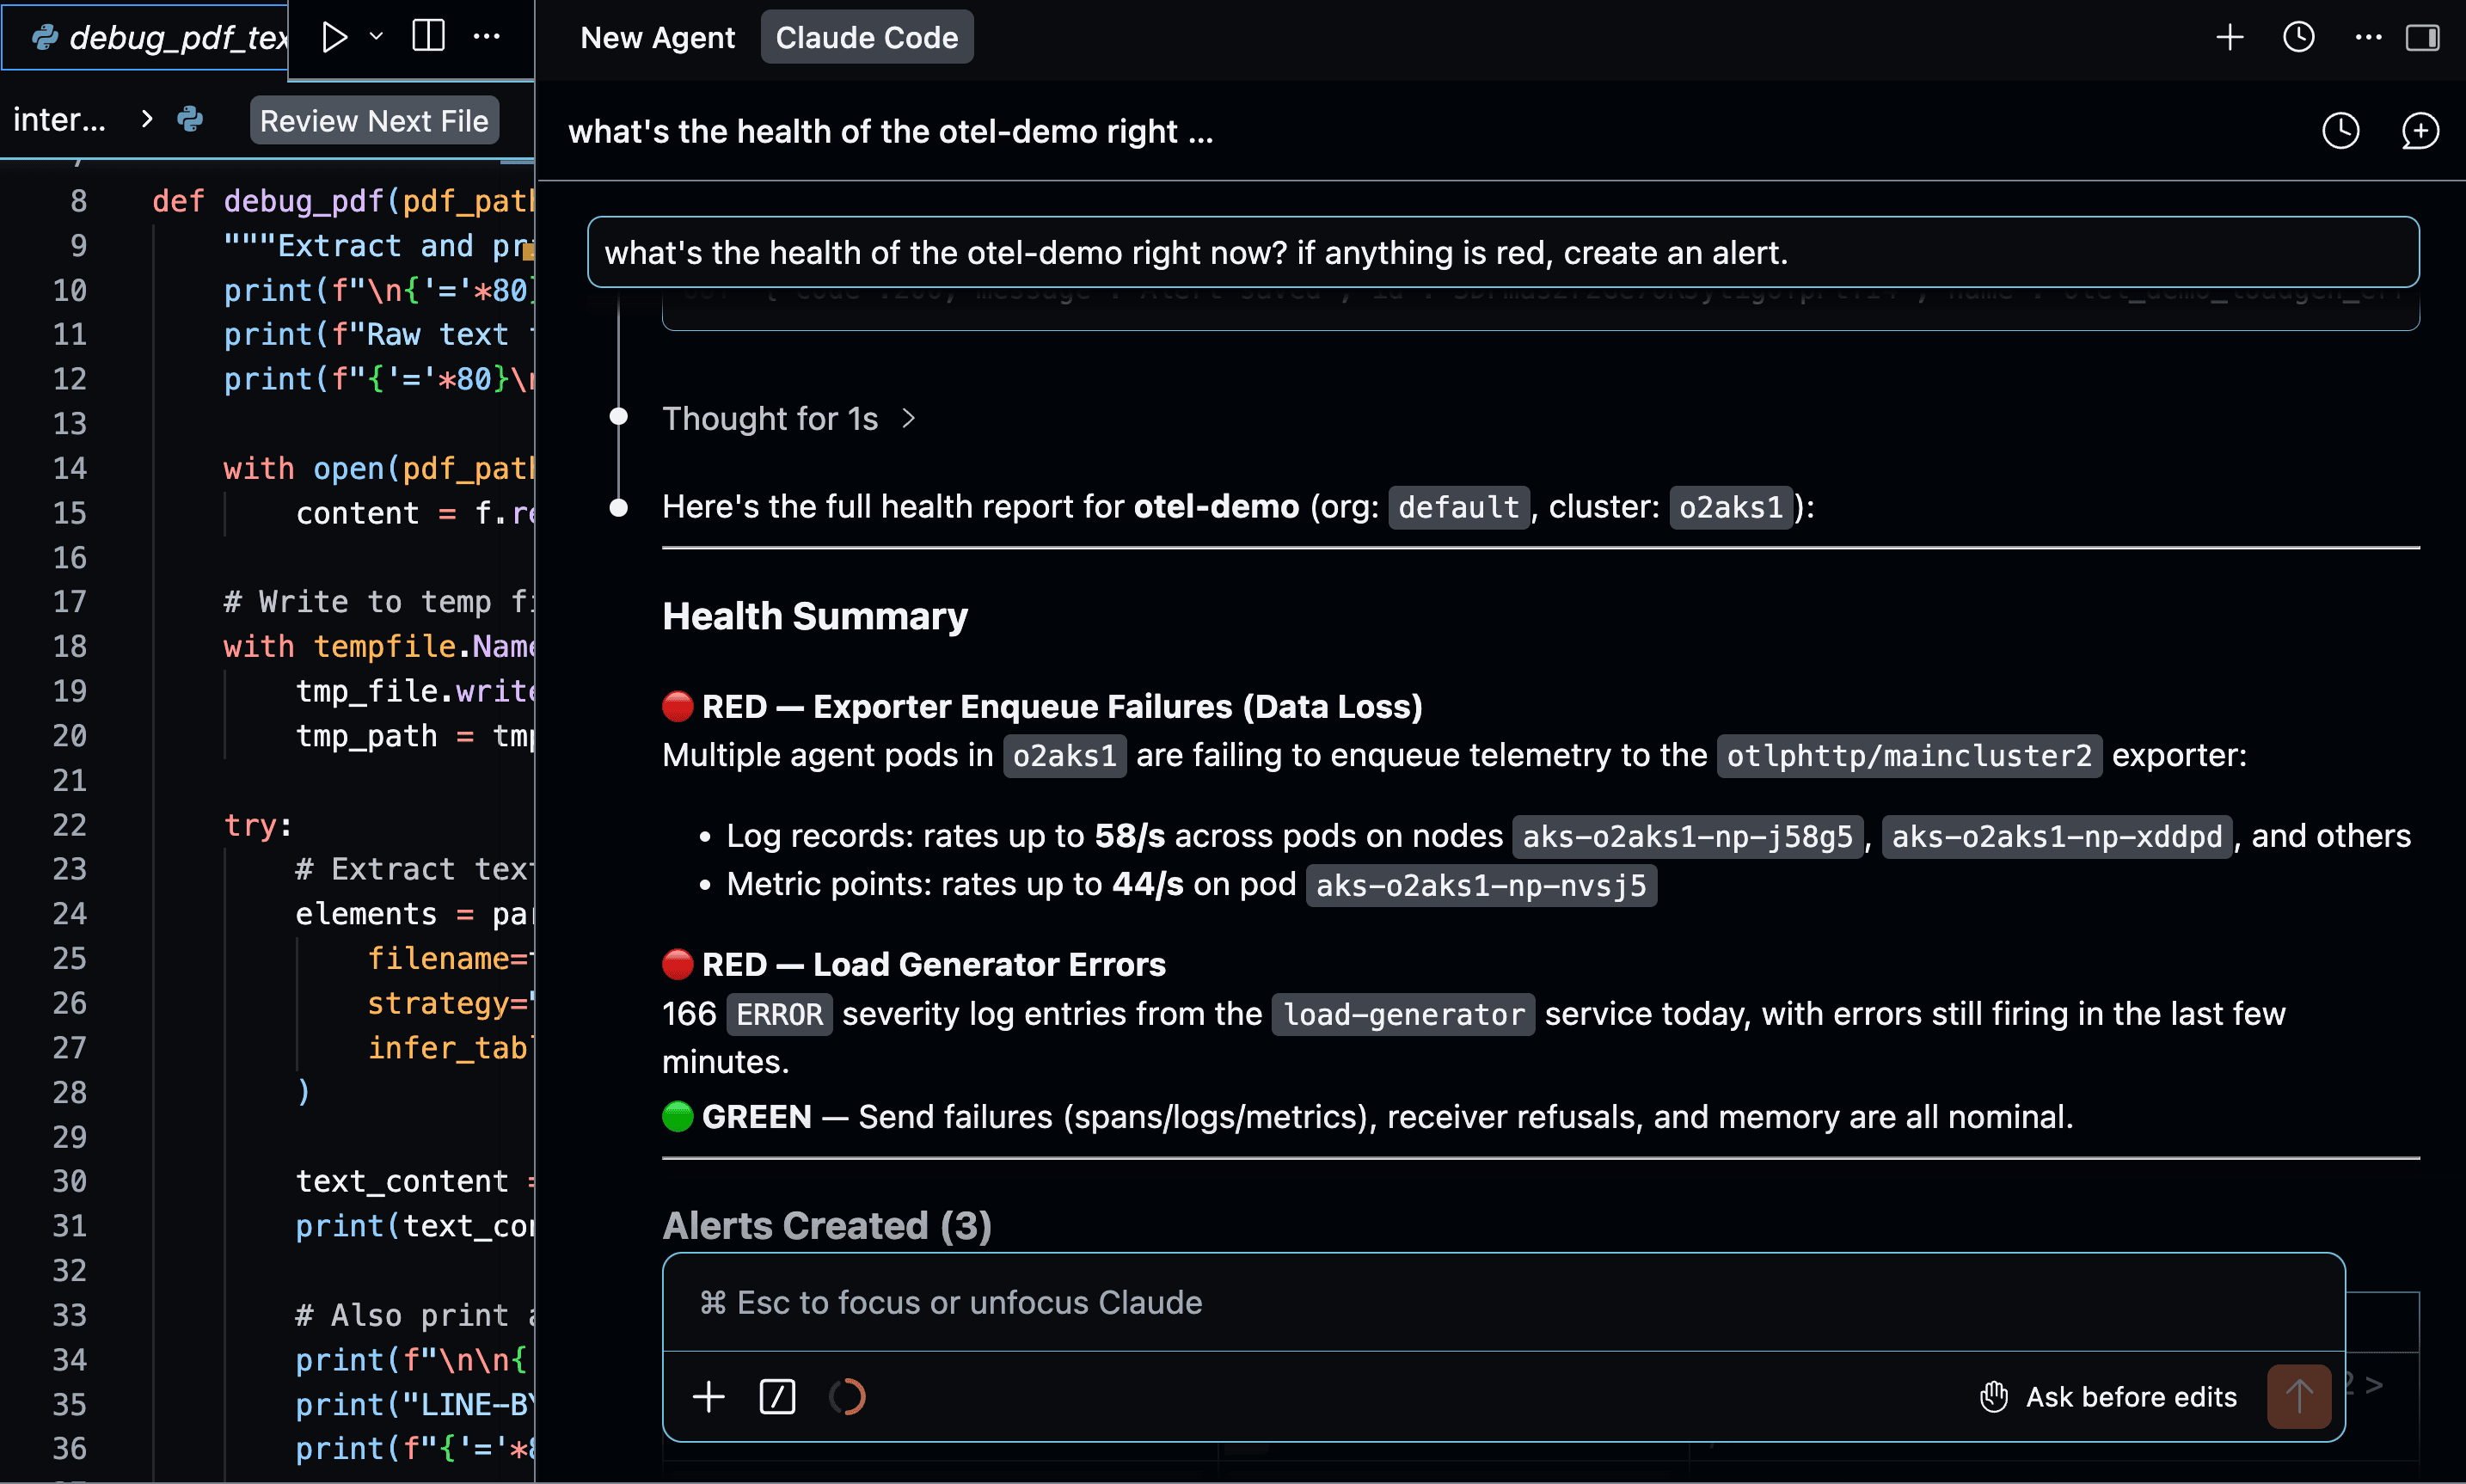
The OpenObserve MCP server gives AI agents such as Claude Code, Cursor, and other MCP clients direct access to your telemetry. Agents can search logs, run metric and trace queries, and create alerts or dashboards, with every call authenticated, scoped by OpenObserve RBAC, and recorded in the audit trail. See the MCP setup docs.
AI and LLM observability
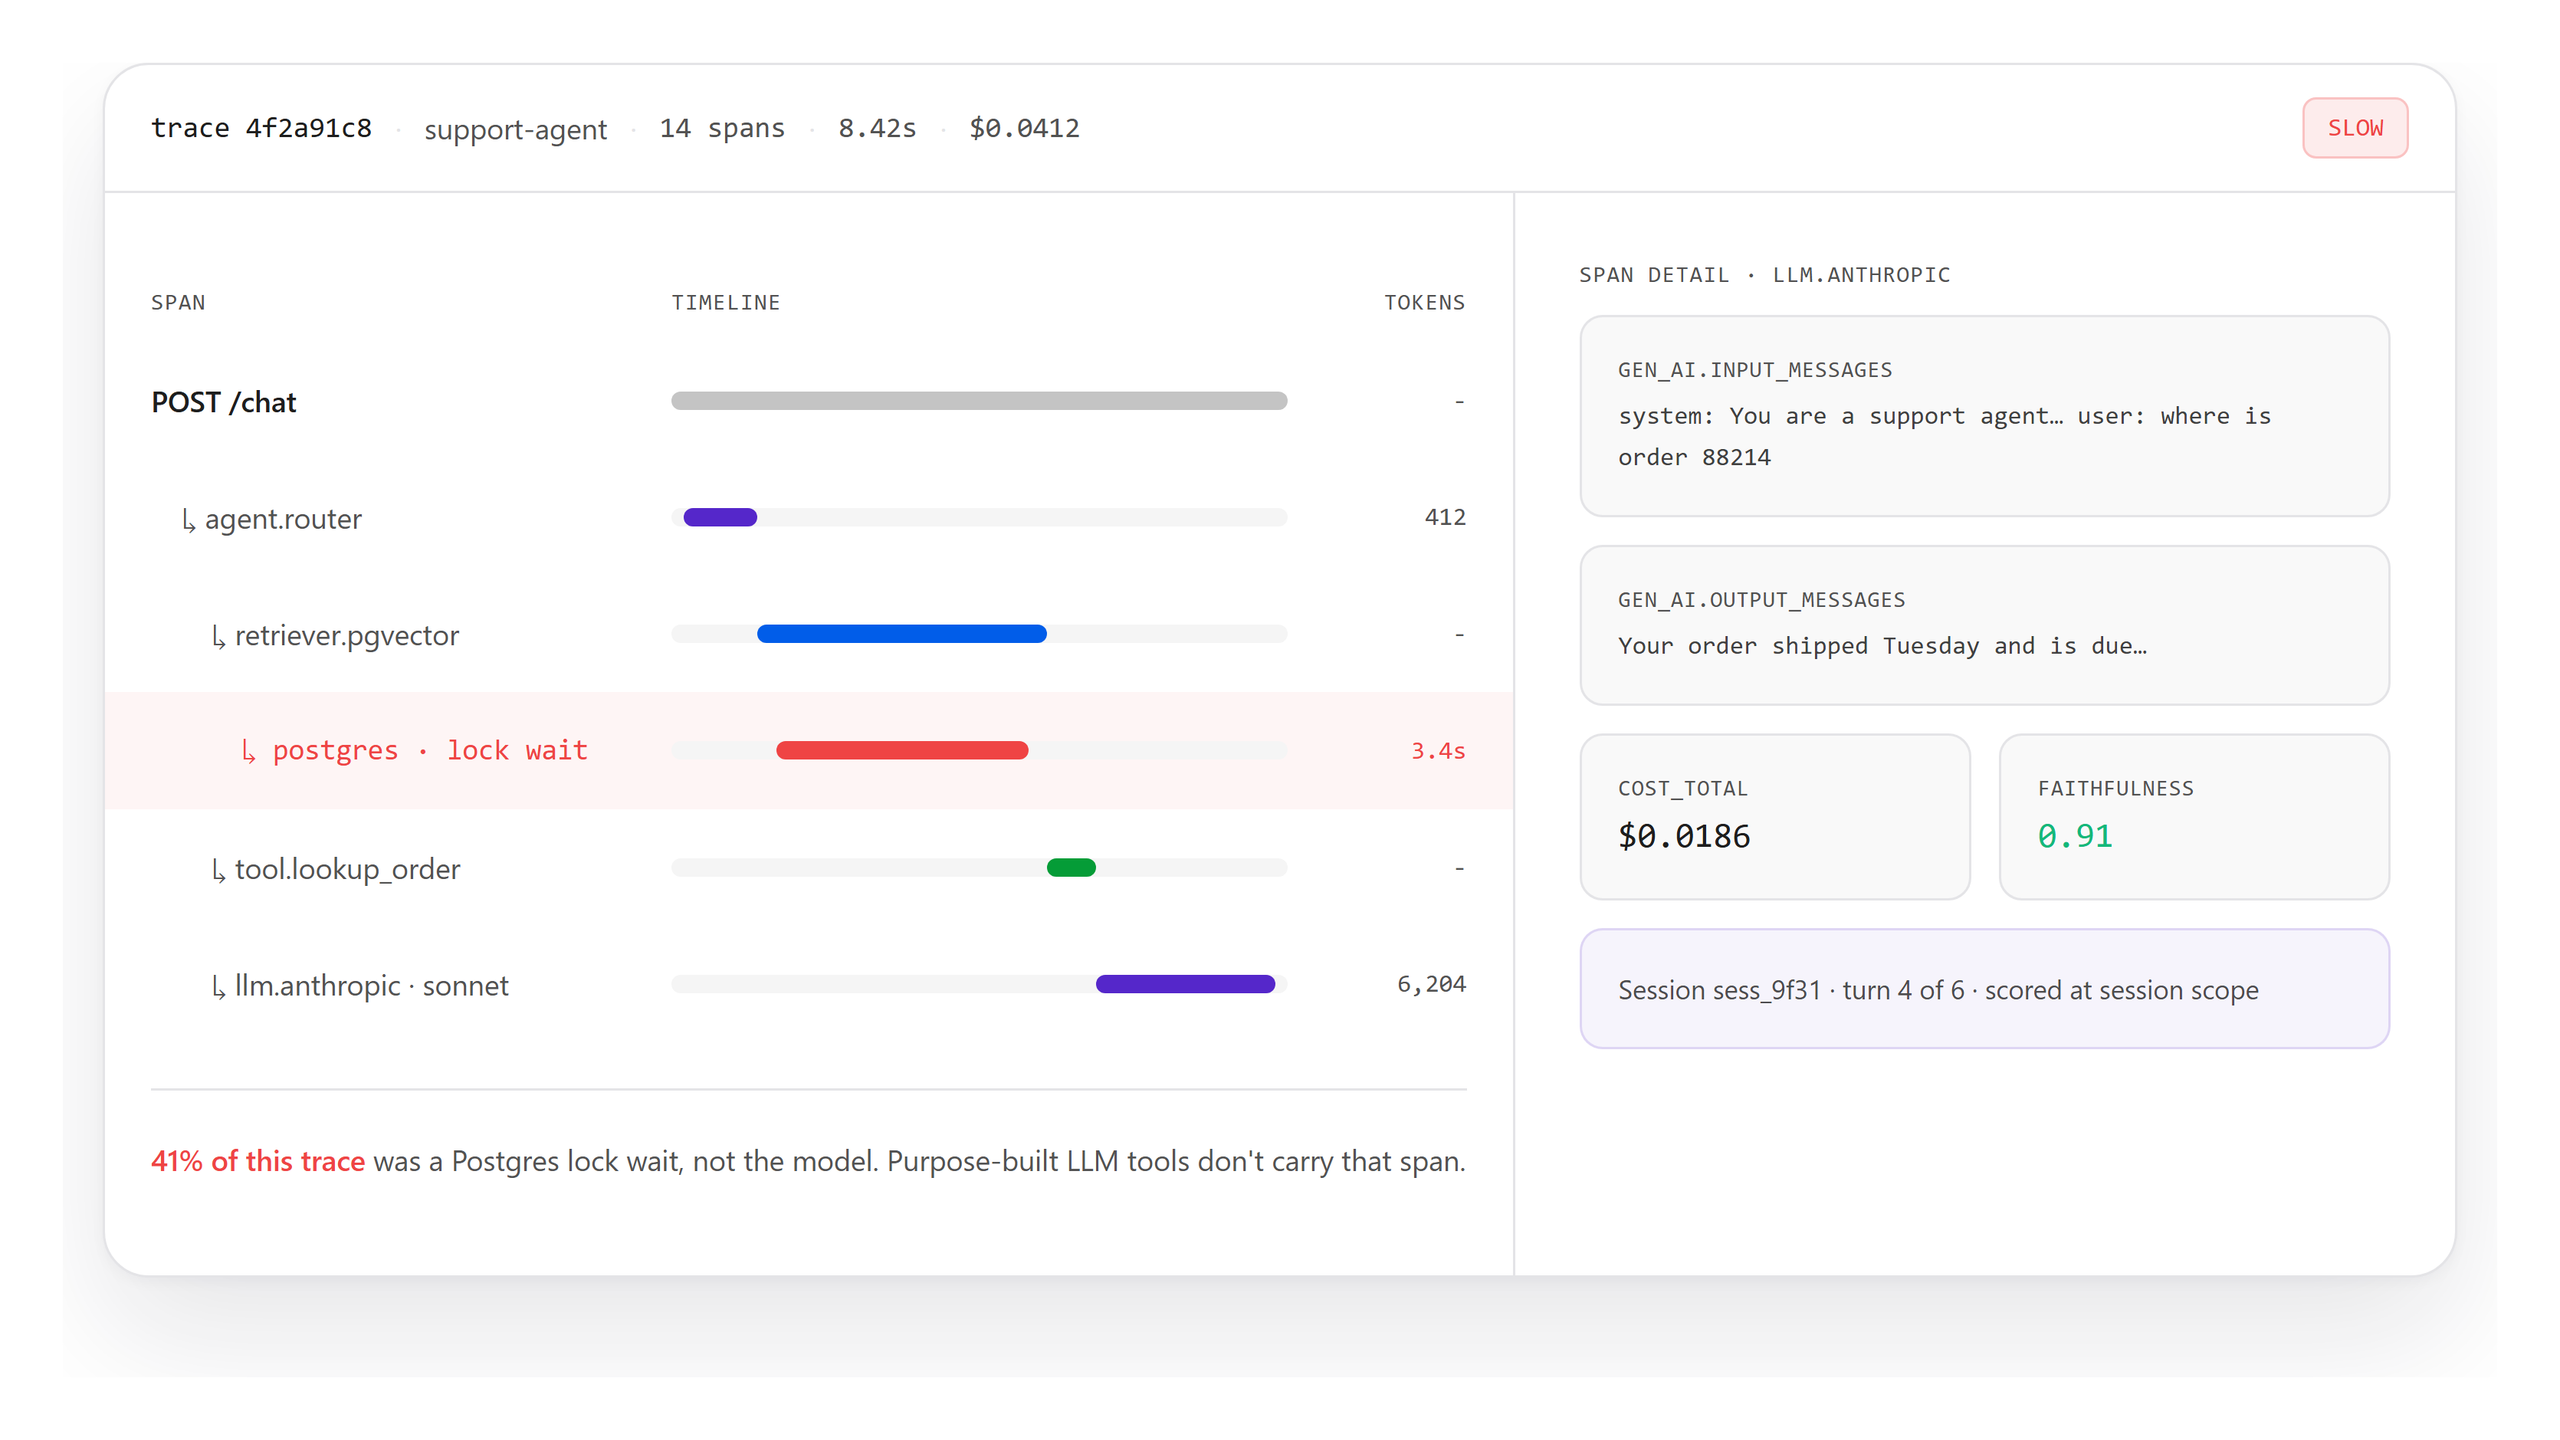
If you run LLM applications or agents, OpenObserve captures every prompt, tool call, and agent handoff as an OpenTelemetry span, with input and output token cost computed per span, on Cloud and self-hosted deployments. AI observability adds quality scoring on live traffic (LLM-as-a-judge or your own scorer), offline experiments against datasets, and human review queues; evaluations are an enterprise feature. Because LLM spans sit in the same store as infrastructure spans, "model problem or infra problem?" is one click. See LLM observability for tracing details, or the LLM tracing and LLM evaluations docs.
Database monitoring
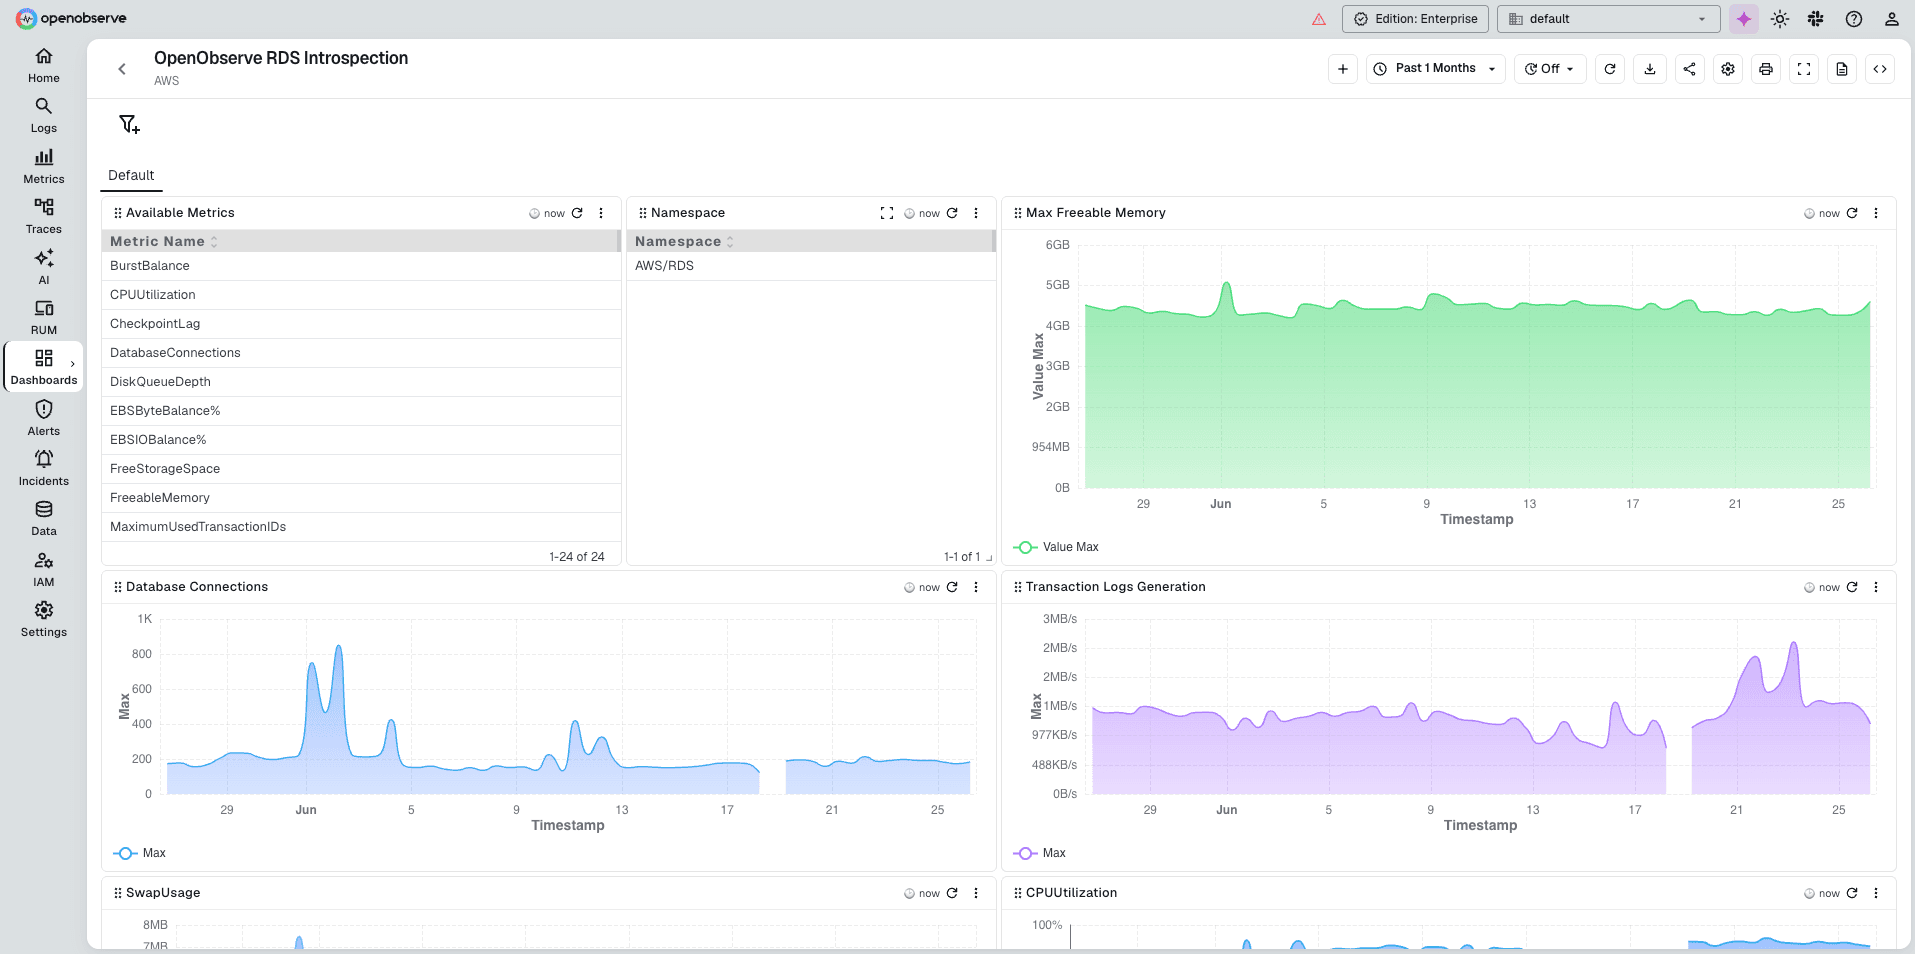
OpenObserve has database monitoring integrations for PostgreSQL, MySQL, MongoDB, Redis, Oracle, Cassandra, DynamoDB, Snowflake, and more, collected with the OpenTelemetry Collector. Prebuilt dashboards and alert rules cover connections, slow queries, resource use, and errors, and database telemetry correlates with the application traces that called it. See the database integration docs.
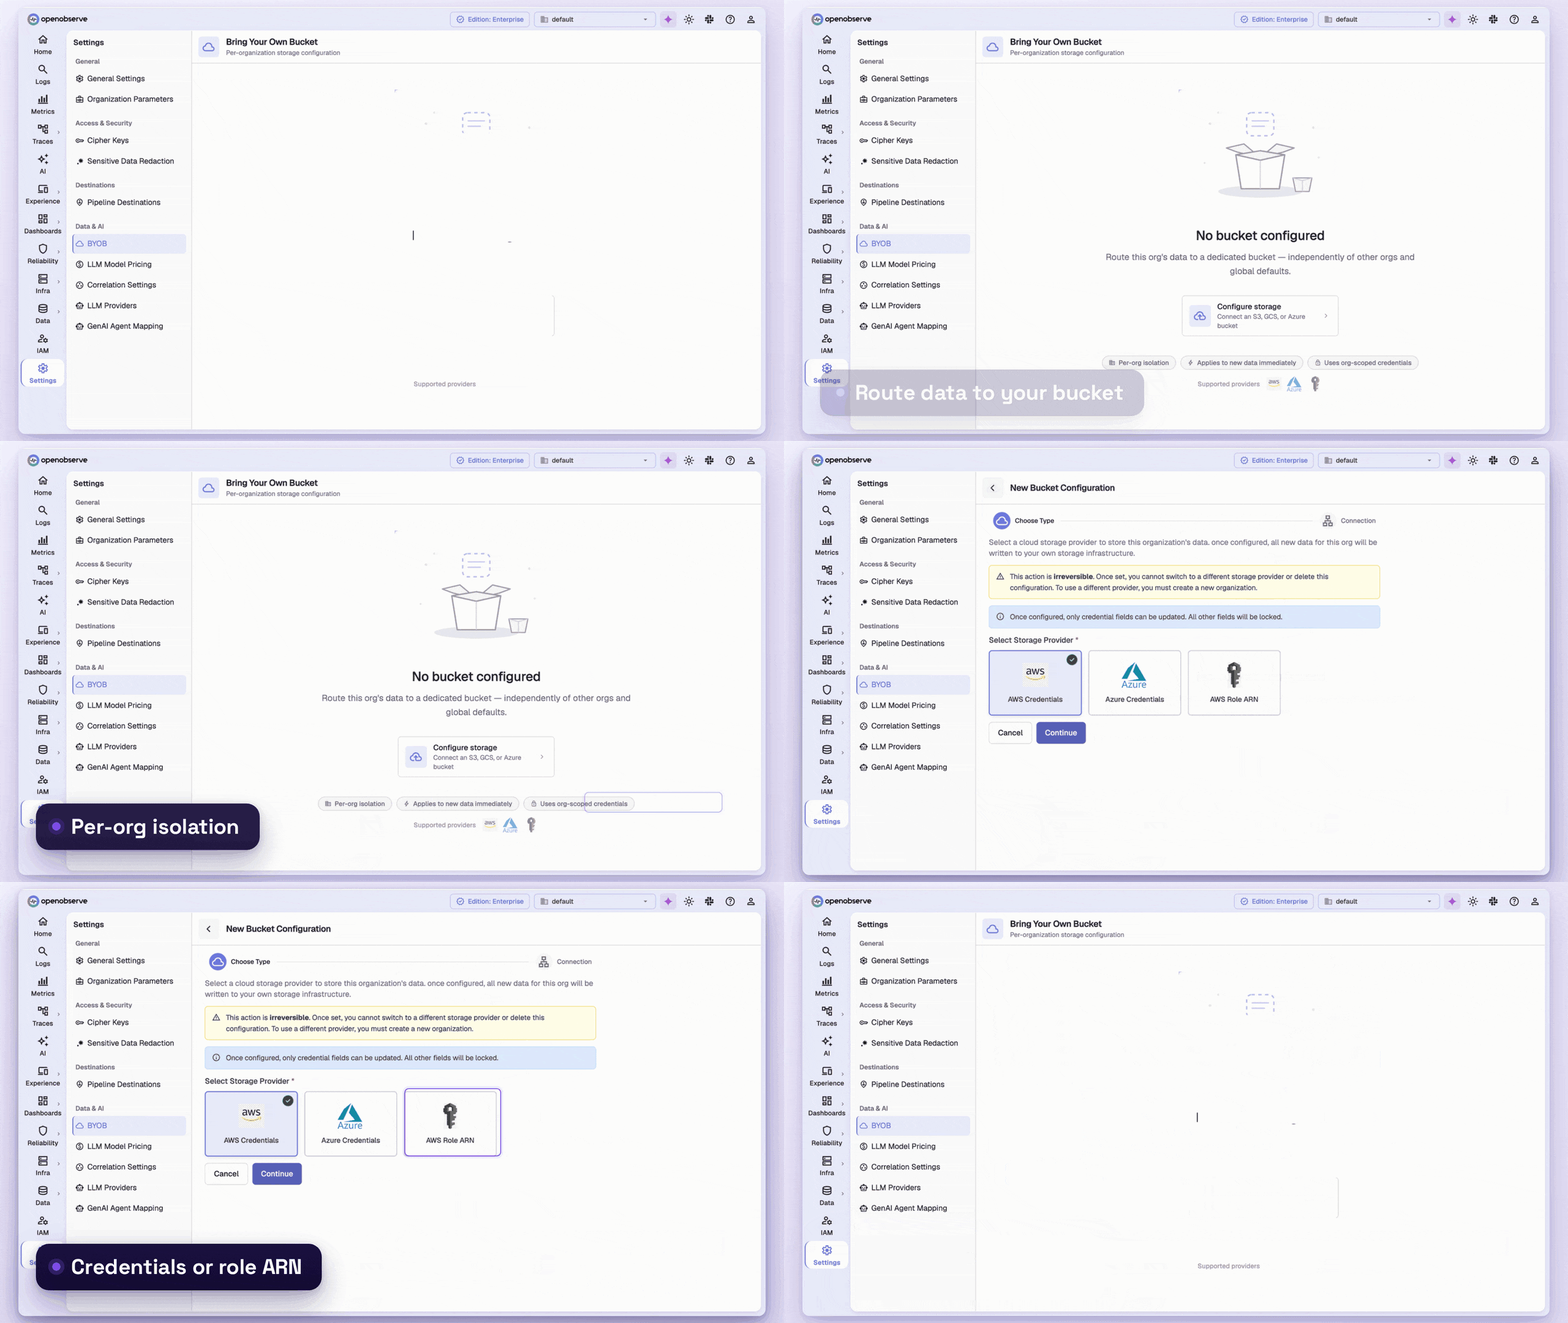
Bring Your Own Bucket (BYOB)
Self-hosted OpenObserve always writes to your own object storage, but with one bucket for all signals instead of one per backend. For OpenObserve Cloud customers, Bring Your Own Bucket connects your own S3 bucket or Azure Blob container, so telemetry stays in your account, in your region, under your own access controls, while OpenObserve runs ingestion, compaction, and queries. The bucket must be in the same region and cloud provider as your OpenObserve Cloud deployment; see the BYOB documentation.
How to get started with OpenObserve
OpenObserve gives you two ways to get started:
- OpenObserve Cloud: the fastest way to try it. Sign up for OpenObserve Cloud and start sending logs, metrics, and traces with nothing to install or run.
- OpenObserve self-hosted: run it on your own infrastructure. Download OpenObserve and deploy it as a single binary or on Kubernetes with the Helm chart.
The quickstart guide walks through both options. See OpenObserve pricing for current plan details.
How to evaluate OpenObserve as your LGTM replacement
Use these questions to structure a proof of concept. Each one maps to a common reason teams leave LGTM:
- Operations: How many components do we run today for logs, metrics, traces, and dashboards? OpenObserve replaces them with one binary or one Helm release.
- Query experience: Can engineers answer a cross-signal question (trace to logs to metrics) in one place? Test it in OpenObserve with the correlation and drilldown flows above.
- Cardinality: Which fields did we avoid indexing in Loki? Ingest them into OpenObserve and search on them directly.
- Scope beyond LGTM: Which Grafana Cloud products or extra tools do we pay for or run for SLOs, incidents, synthetics, RUM, or AI? Check each against the comparison table.
- Data control: Where must telemetry live? Pick self-hosted, Cloud with BYOB, or Enterprise in your own cloud.
- Cost: What do Loki and Mimir retention cost today? Compare against OpenObserve's storage footprint on the same data.
How do you migrate from the LGTM stack to OpenObserve without rewriting instrumentation?
The migration path does not require touching application code. If you already instrument with OpenTelemetry, the OTel Collector can send telemetry to LGTM and OpenObserve at the same time:
- Add OpenObserve as a second OTLP exporter destination in your existing OTel Collector, alongside your current Loki, Tempo, and Mimir endpoints.
- For metrics scraped by Prometheus and remote-written to Mimir, add OpenObserve's Prometheus remote-write endpoint as a second
remote_writetarget. - Import prebuilt dashboards for your common sources, and convert your most-used Grafana dashboards with the OpenObserve Dashboard Migrator.
- Recreate critical alerts and define SLOs for your key services, then turn on incident creation for the alerts that matter.
- Run both stacks in parallel long enough to validate query results and alert parity.
- Cut traffic over and decommission Loki, Tempo, and Mimir once OpenObserve is handling production queries.
Because OpenObserve speaks OTLP and Prometheus remote write natively, none of this changes how services emit logs, metrics, or traces, only where that data is sent.
Architecture: four backends vs. one
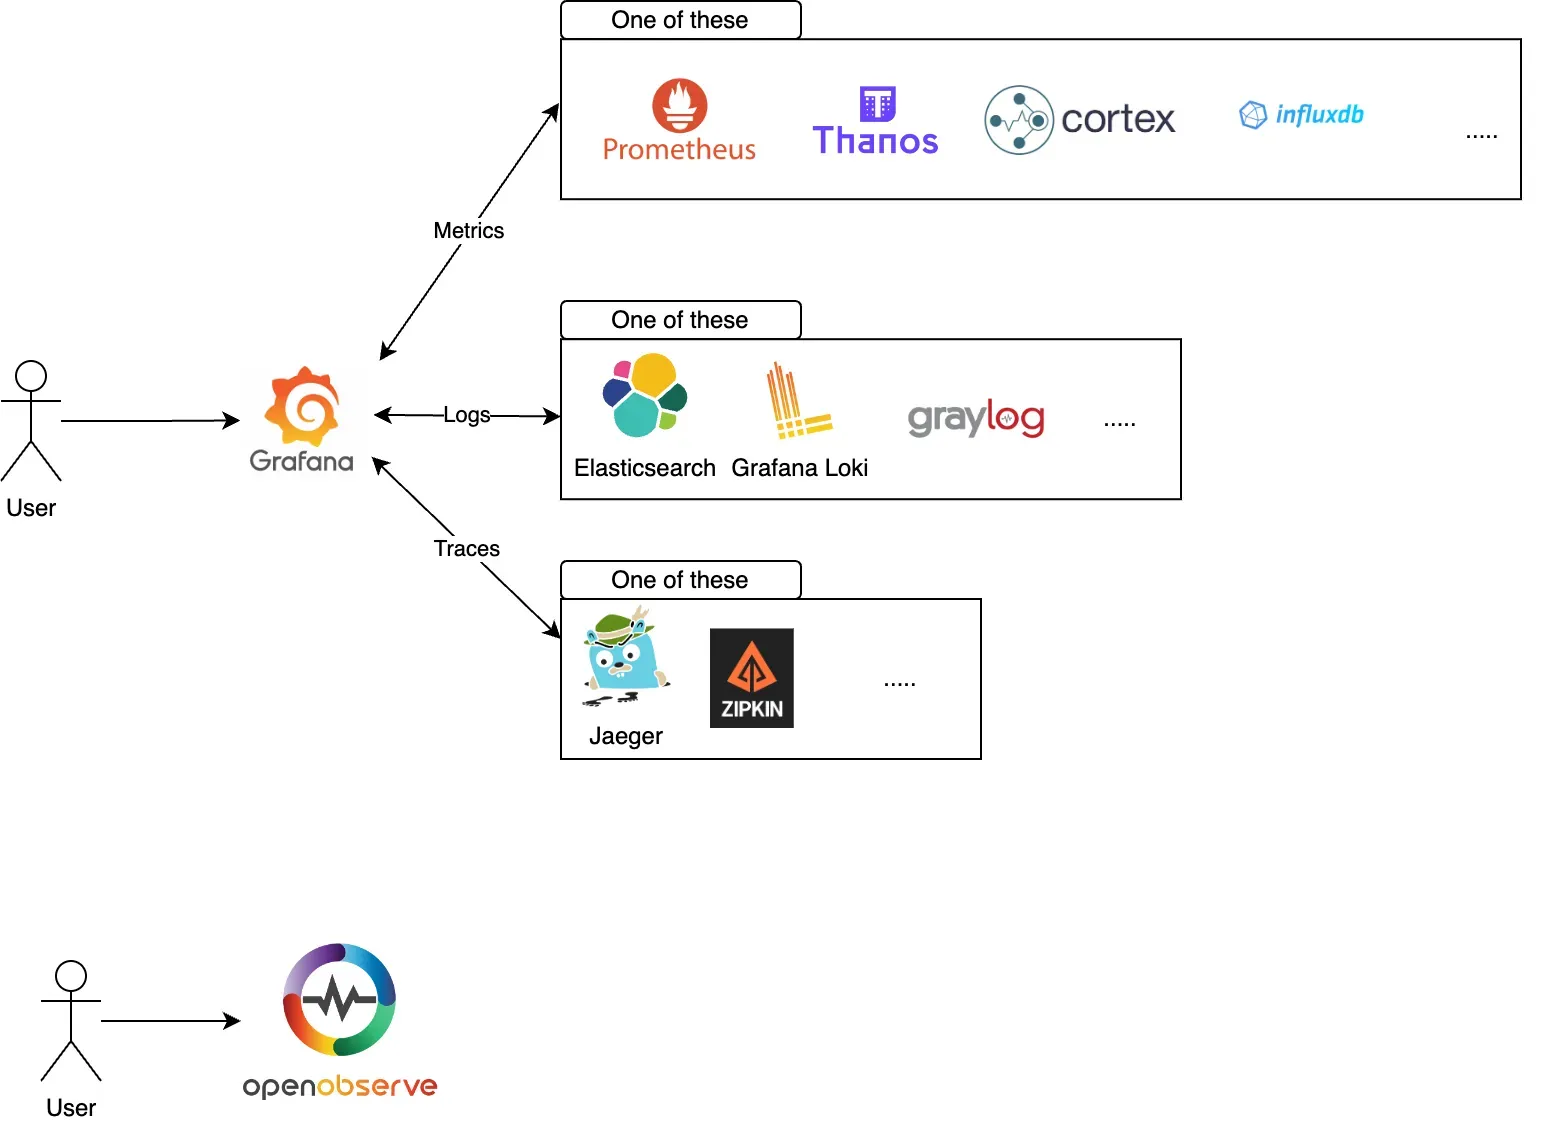
In the LGTM stack, Grafana is a front end wired to Loki, Tempo, and Mimir separately, each with its own storage and scaling tier. In OpenObserve, ingestion, storage, query, visualization, and alerting live in the same binary, deployable as a single node for smaller workloads or via Helm chart in Kubernetes for high availability. See the architecture docs.
How much can you save by replacing the LGTM stack with OpenObserve?
Savings come from two places: fewer infrastructure components to run (no separate ingester, compactor, and store-gateway tiers for three different systems) and OpenObserve's columnar storage compression, which gives approximately 140x lower storage costs in typical log workloads compared to Elasticsearch-based stacks (see the benchmark); actual results vary based on data entropy and cardinality. How much that translates to against an existing LGTM deployment depends on your current retention windows and node counts for Loki and Mimir, since those are usually the largest cost centers. Consolidating the extra tools you run beyond LGTM (SLOs, incidents, synthetics, RUM, AI) adds to those savings. See the cost of self-hosting observability on ClickHouse for how storage engine choice affects self-hosted economics more broadly.
Conclusion
The LGTM stack works, and plenty of teams run it successfully, but "works" comes with the overhead of operating four distributed systems, training engineers on three query languages, and adding more products for everything past logs, metrics, traces, and dashboards. OpenObserve collapses that into one open-source platform: one binary, native OpenTelemetry ingestion, SQL for querying, and pipelines, RUM, synthetics, alerts, incidents, SLOs, AI SRE, the AI Assistant, the MCP server, LLM observability, database monitoring, and BYOB built in. You can run it as managed SaaS, free and self-hosted, or with enterprise features on your own infrastructure.
If you are evaluating the broader field, see Top 10 Grafana Alternatives in 2026, the direct OpenObserve vs Grafana comparison, or the full OpenObserve as a Grafana alternative breakdown.
Getting started takes minutes, not weeks. Try OpenObserve in the cloud with a free trial, or self-host it as a single binary or via the Kubernetes Helm chart.
Frequently Asked Questions
About the Author
Simran Kumari

Passionate about observability, AI systems, and cloud-native tools. All in on DevOps and improving the developer experience.
Follow OpenObserve on Google
Add OpenObserve as a preferred source to see more of our articles in Google Search and Top Stories.











