How Yupao Moved 69 TB of Logs a Day Off Alibaba Cloud SLS to Self-Hosted OpenObserve



Ready to get started?
Try OpenObserve Cloud today for more efficient and performant observability.

About Yupao
Yupao Technology runs Yupao Zhipin, a recruitment platform connecting China's blue-collar and skilled-trade workers with employers. The company's applications span multiple VPCs on Alibaba Cloud, with production and test environments running on ACK, Alibaba's managed Kubernetes service.
The operations team, led on this project by Ma Huihuang, owns the logging platform that more than a hundred developers rely on every day to debug production. When they set out to replace it, they gave themselves five months and one rule: never break the tool engineers reach for first.
"A logging platform is a daily tool for developers. One bad cutover turns everyone against the new platform, and that is very hard to win back. So we were deliberately slow," says Ma Huihuang of Yupao's operations team.
The Challenge: A Six-Figure Bill for Logs, and Islands Across VPCs
Yupao was shipping logs through LoongCollector into Alibaba Cloud SLS, and the team is clear that SLS is a strong product. Sub-second queries across tens of billions of records, zero operations burden, and stability they never had to think about. For most teams, they say, SLS is the right answer.
The problem was the bill. Annual SLS spend had passed $140,000 (¥1 million), with business logs alone above $110,000. When the team divided that by real query volume, every log search was costing the company roughly seven cents. SLS charges on ingestion volume and index size, and those are the two things a log workload cannot shrink. You cannot ask the business to log less, and you cannot skip indexing.
Logs are part of the observability stack. Cutting them wouldn't hurt the business, but a line item eating $140,000 a year needed an answer.
The second problem was architectural. SLS projects cannot be shared across VPCs, so test and production each needed their own project. Logs were physically split into islands. Engineers switched projects to query different environments, and every index, retention period, alert rule, and permission had to be configured once per project, with drift surfacing months later when someone noticed a retention setting nobody had updated.
This wasn't something money could fix. It's a product boundary.
As it turned out, a component the team introduced for a completely different reason would erase that boundary.
Why OpenObserve
After comparing several options, Yupao chose OpenObserve. The deciding factor was the storage model.
OpenObserve writes data as Parquet on object storage, separates compute from storage, and indexes on demand. That anchors storage cost to the price of Alibaba Cloud OSS rather than a platform's ingestion-plus-index formula, and scaling out means adding a container replica.
The team's measured 8.1:1 compression ratio is the direct payoff. The platform currently holds 130.7 billion log lines online: 364.9 TB raw at about 3.7 KB per line, stored as 44.8 TB of compressed data plus 11.2 TB of index, 56 TB of OSS in total. Each day, 69 TB of raw logs come in and about 10.6 TB land on disk.
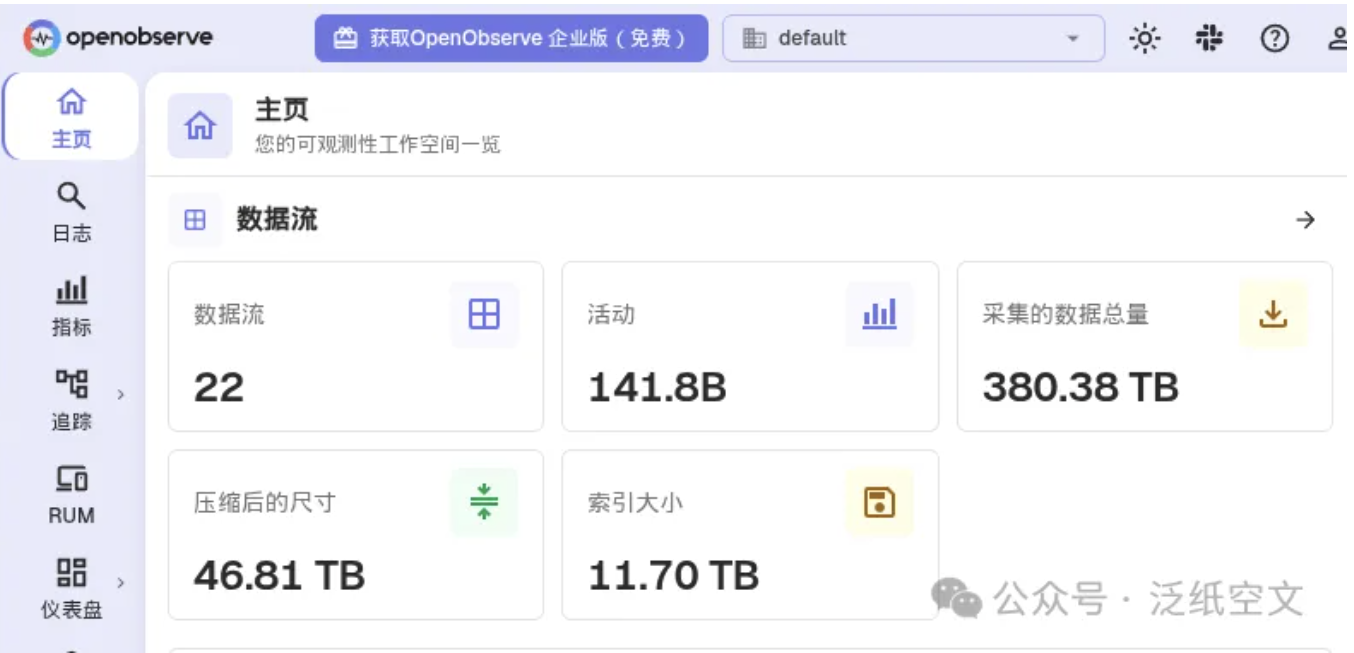
Resource efficiency sealed it. Written in Rust, OpenObserve absorbs Yupao's 69 TB daily write with 7 ingesters, and 3 queriers handle the daily query load from more than 100 engineers.
"That input-to-output ratio is what gave us the confidence to make the call," the team says.
The component split mattered too. Router, ingester, querier, and compactor deploy separately and scale on their own bottlenecks. Yupao later added two dedicated alert queriers so that its 25 scheduled alert rules never compete with a human running a heavy query, and a large ad hoc query never delays an alert.
"Alerts don't get delayed because someone ran a big query, and human queries don't get squeezed by 25 scheduled rules. In a high-frequency alerting setup, that's very practical."
The Migration: Five Overlapping Phases Over Five Months
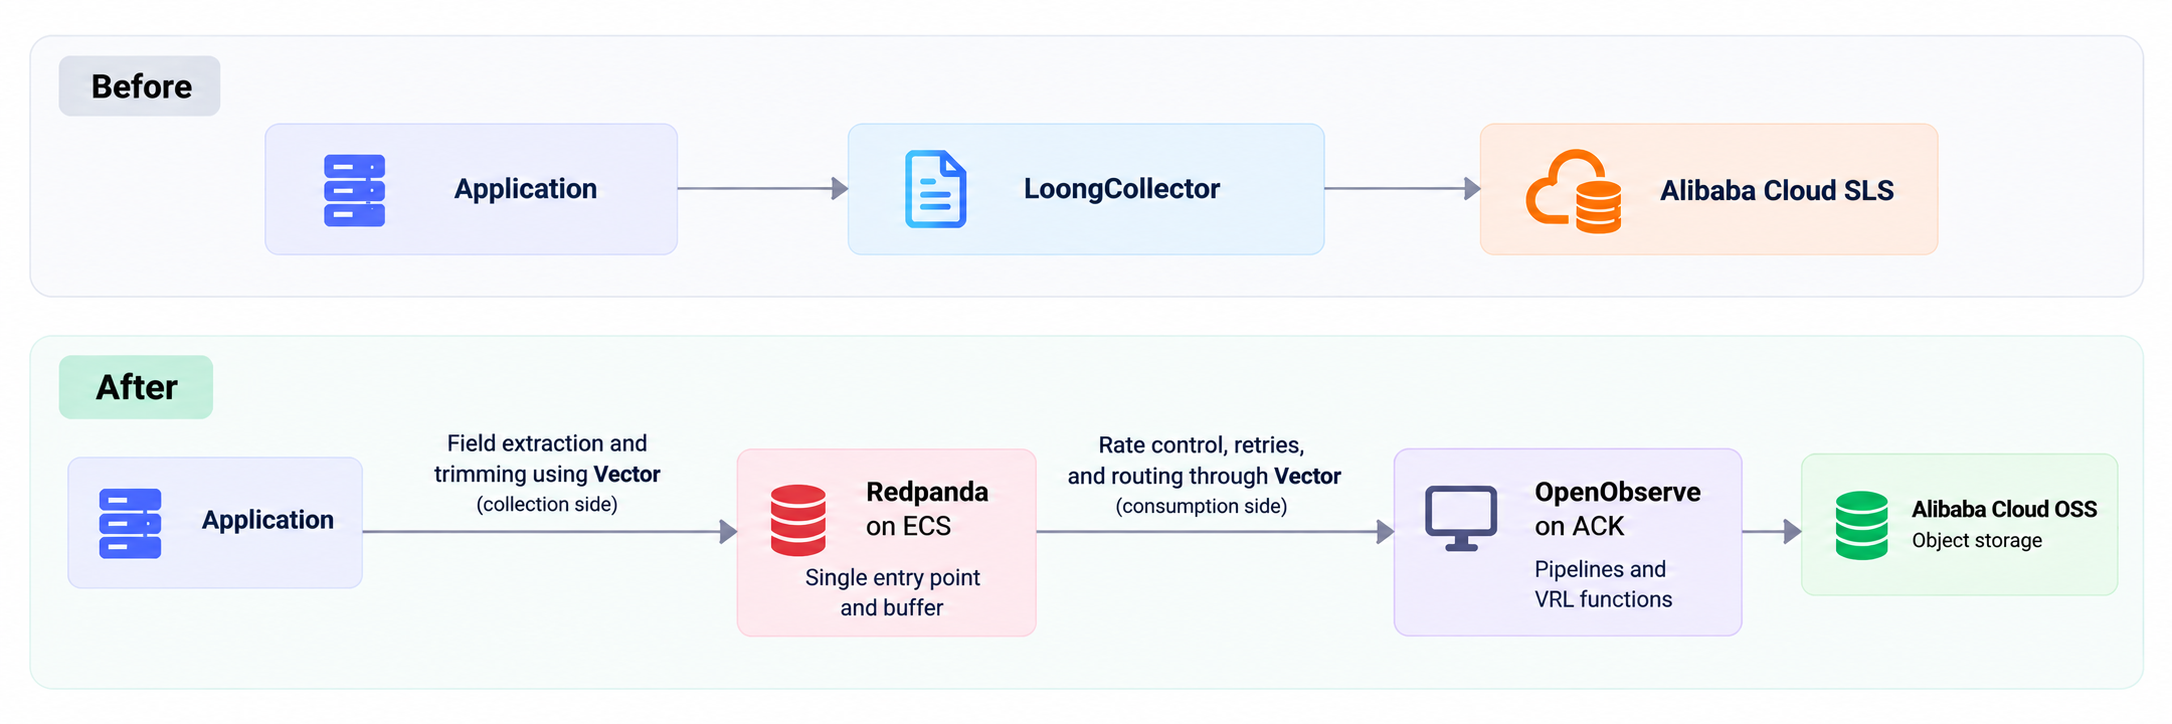
Two design choices are worth explaining.
Redpanda in the middle. The direct motive was efficiency. The standard pattern puts an internal load balancer in front of the ingesters, but Alibaba Cloud's internal SLB bills by traffic, and at 69 TB a day that is a fixed charge that never appears on an architecture diagram. So collection-side Vector writes straight to Redpanda on ECS, which bills per instance, and consumption-side Vector writes to OpenObserve's routers and ingesters over the in-cluster Kubernetes network. Nothing in the path bills by traffic.
The buffer also absorbs log spikes, which are far sharper than business traffic spikes, and holds data during OpenObserve rolling upgrades so nothing is lost. And because every VPC's Vector sends to the same Redpanda cluster, it became the single ingestion entry point for the whole company. One cluster downstream, one query view. The cross-VPC silo problem the team had lived with for years disappeared.
"A component we brought in only to save on traffic fees ended up removing a product boundary we'd been working around every day," the team says. "That kind of win has no line in the cost model. You only notice what it was costing you once it's gone."
Two layers of Vector. Collection-side Vector uses VRL to extract and trim fields before logs leave the host, so every downstream step benefits: Redpanda storage, network transfer, OpenObserve ingest and indexing. Consumption-side Vector scales independently. Collection scales with application instance count, consumption scales with OpenObserve's write capacity, and decoupling them means each can be adjusted alone. With 4 real-time Pipelines and 4 VRL functions inside OpenObserve, the team has three places to shape data: coarse processing at collection, adjustments before delivery, fine processing on the platform.
Deployment
Yupao runs the OpenObserve open source edition, deployed on ACK via Helm, with metadata in Alibaba Cloud RDS PostgreSQL and the chart's bundled NATS + JetStream for cluster coordination.
| Component | Replicas | CPU limit | Memory limit | Local disk |
|---|---|---|---|---|
| ingester | 7 | 26 | 64 Gi | 100 Gi ESSD (WAL) |
| querier | 3 | 14 | 96 Gi | 6 Ti (cache) |
| compactor | 3 | 24 | 100 Gi | 100 Gi |
| router | 3 | 4 | 8 Gi | none |
| alertquerier | 2 | 12 | 32 Gi | 100 Gi |
| alertmanager | 1 | 2 | 4 Gi | 100 Gi |
Node pools are hard-isolated by role using nodeAffinity on an openobserve.ai/role label (data for ingesters, querier for queriers, control for compactor, router, and alertmanager), with podAntiAffinity so replicas of the same role never share a host. Queriers use required anti-affinity: losing one host costs one third of query capacity and one third of cache, never more.
The five phases
The phases stacked rather than ran in sequence. The handbook started in phase two and never stopped changing. Tuning began the day production dual-write started and is still going.
- Ops shakedown (from April 10, 2026). System log streams and a few non-production Java application streams, no users. The only goal was learning the behavior, scaling limits, and failure recovery of every component. The first production stream joined in late April.
- Internal handbook (in parallel). A developer-facing manual whose core chapter maps SLS queries to their OpenObserve equivalents: the same query intent, written both ways.
- Dev environment live, test environment dual-write (from May 15). Frontend and business streams were written to SLS and OpenObserve simultaneously so internal users could try the new platform on real data and give feedback.
- Targeted beta in test (from June). SaaS and big-data production streams joined between June 15 and 24. A group of willing users worked through issues one by one, some misconfiguration on Yupao's side, some real product gaps closed with custom development. The handbook was revised repeatedly.
- Staging and production dual-write, then tuning (from July). The main production streams went live in early July, and a single stream accumulated more than 40 billion records inside a 3-day retention window. A 30-day long-retention stream followed in mid-July for lookback cases. The final environments joined at the end of August.
"The hardest part of self-hosting is never the technology. It's the learning cost for users," the team says. "Developers have no obligation to learn a new query syntax so the company can save money. You have to flatten that step for them. Write the handbook first, then migrate."
The Results
The number that headlines the project is more than $60,000 saved in the first year, with the entire self-hosted stack, compute, storage, and buffer included, running at about $40,000 a year. The team is clear that this is the smaller part of the outcome.
The cost model changed shape. Logging moved from pay-per-use to capacity planning. As the business grows, the cost curve is controllable and predictable, and it no longer jumps a tier when volume does.
Logs went from islands to one picture. Every VPC now feeds a single entry point and a single query view. Cross-VPC troubleshooting no longer means several windows and a hand-stitched timeline, and configuration is maintained once. The team calls this the change they feel most.
The psychological cost dropped to zero. No one hesitates anymore over whether one log search costs the company seven cents.
The boundaries opened up. Retention periods, index strategy, and pipeline processing logic are now parameters the team controls, not constraints set by a vendor's pricing structure.
On performance, in their words
The team is careful to say two things that sound contradictory and are both true. SLS's sub-second queries over tens of billions of records are real and work with no tuning at all. OpenObserve asks you to plan your own indexes and cache, and once you do, it is faster.
"The two aren't the same kind of thing. SLS is 'don't think, just use it.' OpenObserve is 'think it through, and it will be faster and cheaper.'"
What stayed on SLS
Yupao did not move 100% of its logs, and the team is deliberate about saying so. Three categories remain on SLS: error logs, because their alert chain triggers SMS and phone calls that have run reliably for years and are not worth risking for savings on a small volume; access logs from Alibaba Cloud's MSE cloud-native gateway, which can only be delivered to SLS and cannot be collected by a third-party agent; and a small long tail of business streams that simply haven't been scheduled yet.
"'All self-hosted' was never the goal. Lower cost and stability were," the team says. "Put the cloud service where it's most valuable, the high-reliability notification chain, and put self-hosting where it has the biggest edge: high-volume, low-unit-cost storage and search."
Ready to see what OpenObserve can do for your logs at scale? Get a demo or try OpenObserve Cloud for free.
Frequently Asked Questions
Follow OpenObserve on Google
Add OpenObserve as a preferred source to see more of our articles in Google Search and Top Stories.