What Is AI SRE? How AI Is Changing Incident Response




Ready to get started?
Try OpenObserve Cloud today for more efficient and performant observability.
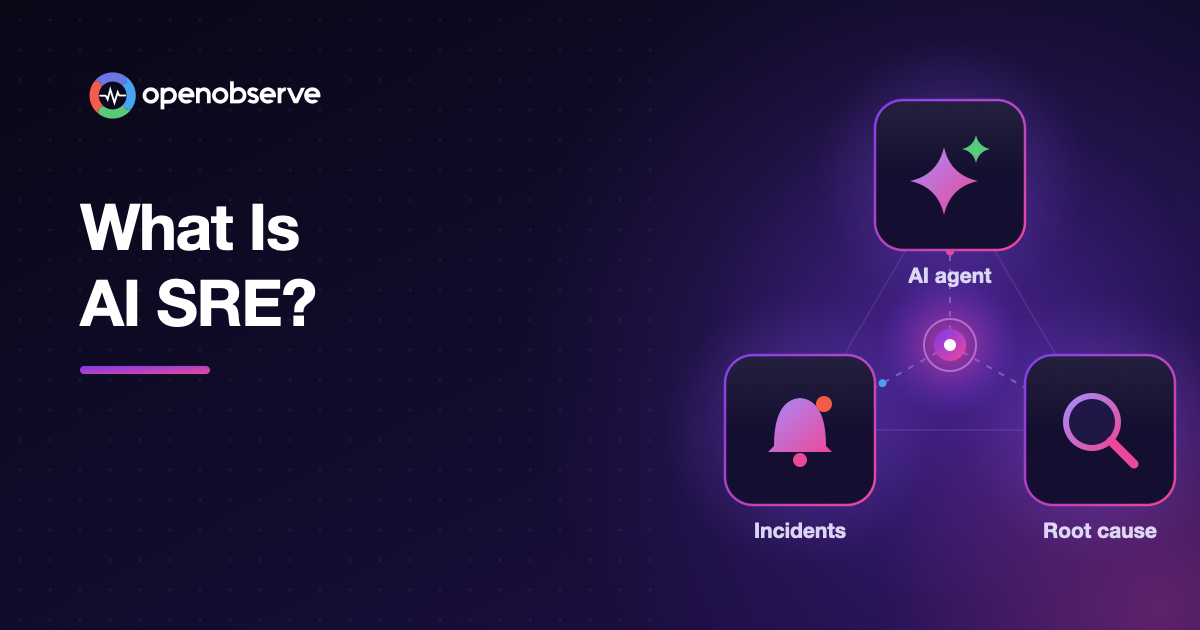
AI SRE is the use of AI agents to do the investigative work of a site reliability engineer during an incident: start from an alert, query logs, metrics, and traces, check recent changes and dependencies, and report a root cause with evidence and proposed fixes. The goal is that the on-call engineer starts from an explanation, not from raw telemetry.
TL;DR
- AI SRE is the use of AI agents that investigate production incidents the way a site reliability engineer does: they query logs, metrics, and traces with tools, check recent changes and service dependencies, and test hypotheses against live data.
- An AI SRE investigation produces a root cause with a confidence level, the evidence behind it, the impact, a timeline of what happened, proposed actions, and the blind spots it couldn't check.
- AIOps and AI SRE solve different problems. AIOps uses machine learning to find patterns and group alerts across a fleet; an AI SRE explains one specific incident from start to finish.
- OpenObserve is the best AI SRE option for most teams because its AI SRE Agent is built into OpenObserve Incident Management: it starts investigating when an incident opens, works across logs, metrics, and traces in the same platform, and only proposes actions, so a human approves every change.
What is AI SRE?
Site reliability engineers spend the first part of most incidents on the same work: work out what's affected, look for recent changes, check dependent services, and search logs, metrics, and traces until a cause emerges. That's where most of the time to resolution goes.
An AI SRE is an AI agent that does that investigative work. It's built on a large language model with tool access: instead of answering from memory, it queries your observability data, follows the evidence, and writes up what it found. A good AI SRE shows its reasoning and evidence, states its confidence, and says what it couldn't check, so an engineer can verify the result quickly.
How does an AI SRE investigate an incident?
An AI SRE investigation follows the same steps a senior engineer would, faster and in parallel:
- Start from the trigger. An alert fires or an incident opens, and the agent starts investigating immediately, before anyone has logged in.
- Map the blast radius. It checks the service topology to see which services are affected and which depend on them.
- Look for changes. It checks recent deployments and configuration changes around the incident start.
- Query the telemetry. It searches error logs, compares metrics against baselines, and inspects slow or failing traces.
- Form and test hypotheses. It proposes candidate causes and looks for evidence that confirms or rules out each one.
- Report. It writes a root cause analysis with the evidence, impact, a timeline, proposed actions, and its blind spots.
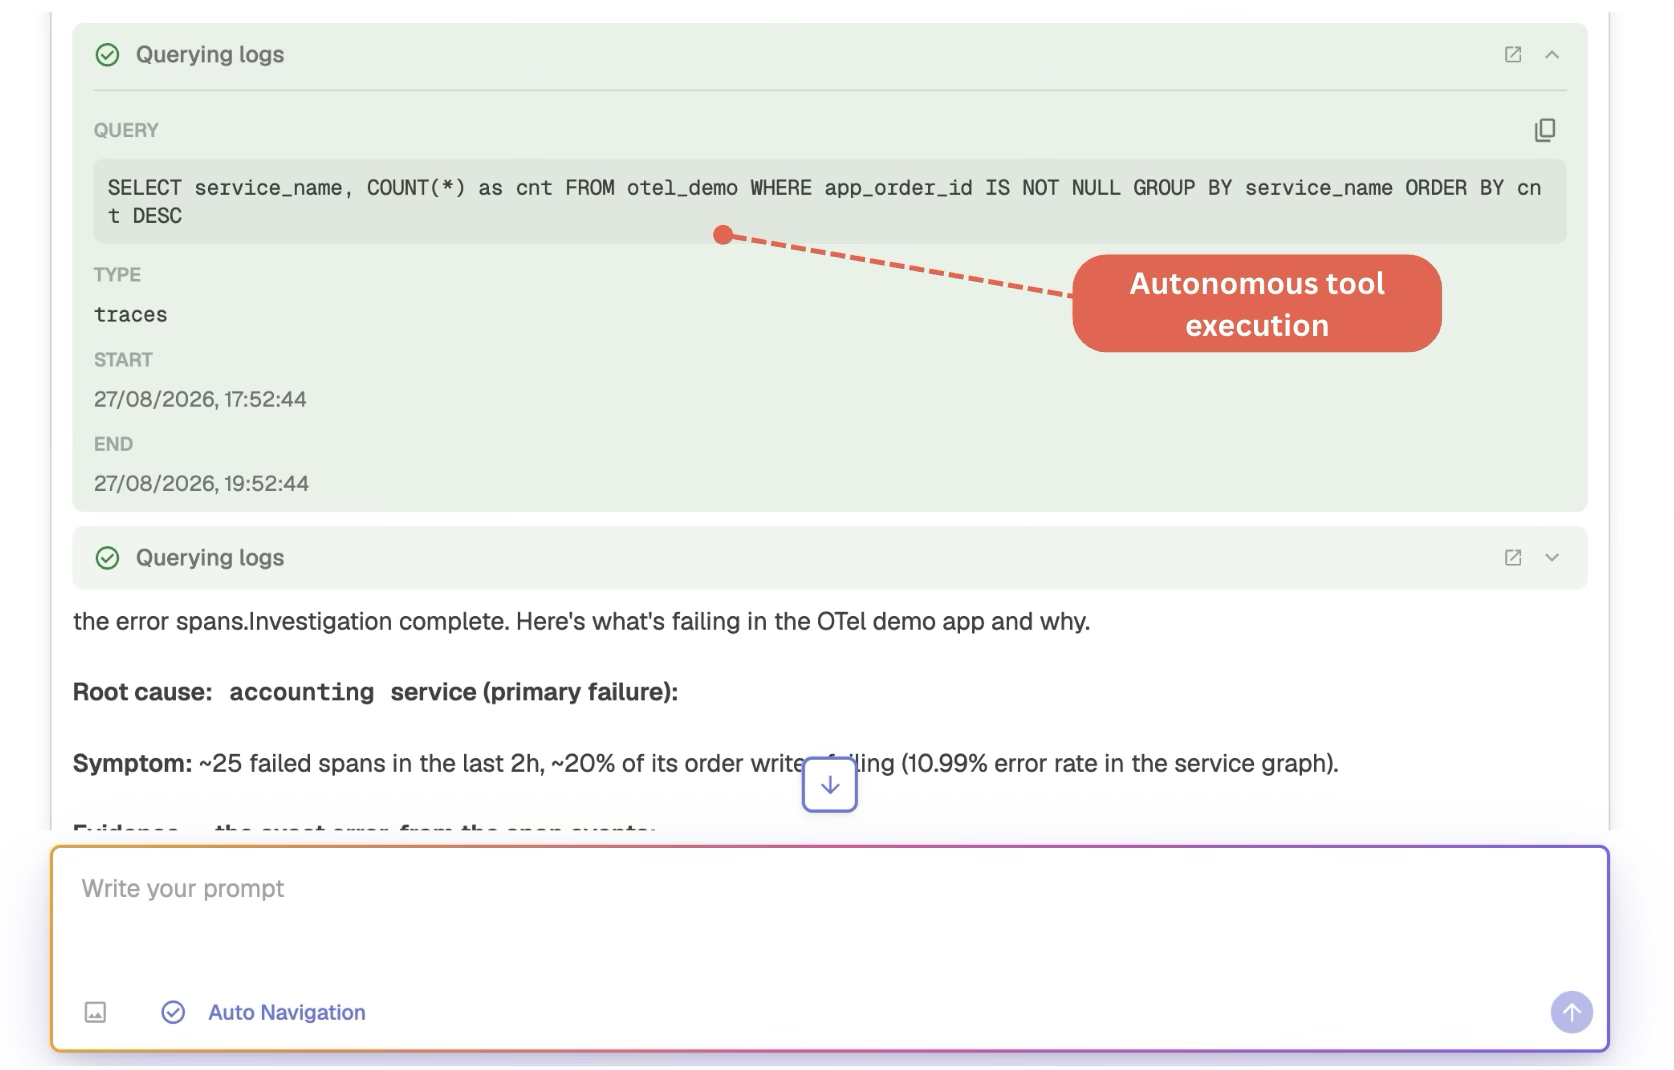
Each step is a real tool call against your data. In OpenObserve, you can open any step of the investigation and see the exact query the agent ran, its type, and the time range it covered:
Can AI do root cause analysis?
Yes, when three conditions are met:
- Access to correlated telemetry. Logs, metrics, traces, and topology have to be queryable together, with shared fields such as service and host, so the agent can follow a failure across signals.
- Tools, not guesses. The agent must query live data. An LLM answering from training data can't know what happened in your system an hour ago.
- Honest uncertainty. A useful report separates confirmed findings from likely ones, states confidence, and lists blind spots.
Where AI root cause analysis struggles is the same place humans struggle: incidents caused by something outside the telemetry, such as a third-party outage you don't monitor or a manual change nobody recorded. That's why human review stays part of the loop.
AIOps vs AI SRE: what's the difference?
| AIOps | AI SRE | |
|---|---|---|
| Main technique | Machine learning on operations data | LLM agents using tools on live telemetry |
| Typical jobs | Anomaly detection, event correlation, alert noise reduction | Investigating a specific incident end to end |
| Output | Grouped alerts, anomalies, patterns | Root cause analysis with evidence and proposed actions |
| Works at | Fleet level, across many signals | Incident level, one investigation at a time |
The two complement each other: AIOps-style correlation decides which alerts belong to the same incident, and an AI SRE explains that incident. In OpenObserve, an incident shows the fields its alerts were correlated by, such as a Kubernetes namespace and cluster, and the logs, metrics, and traces that match them:
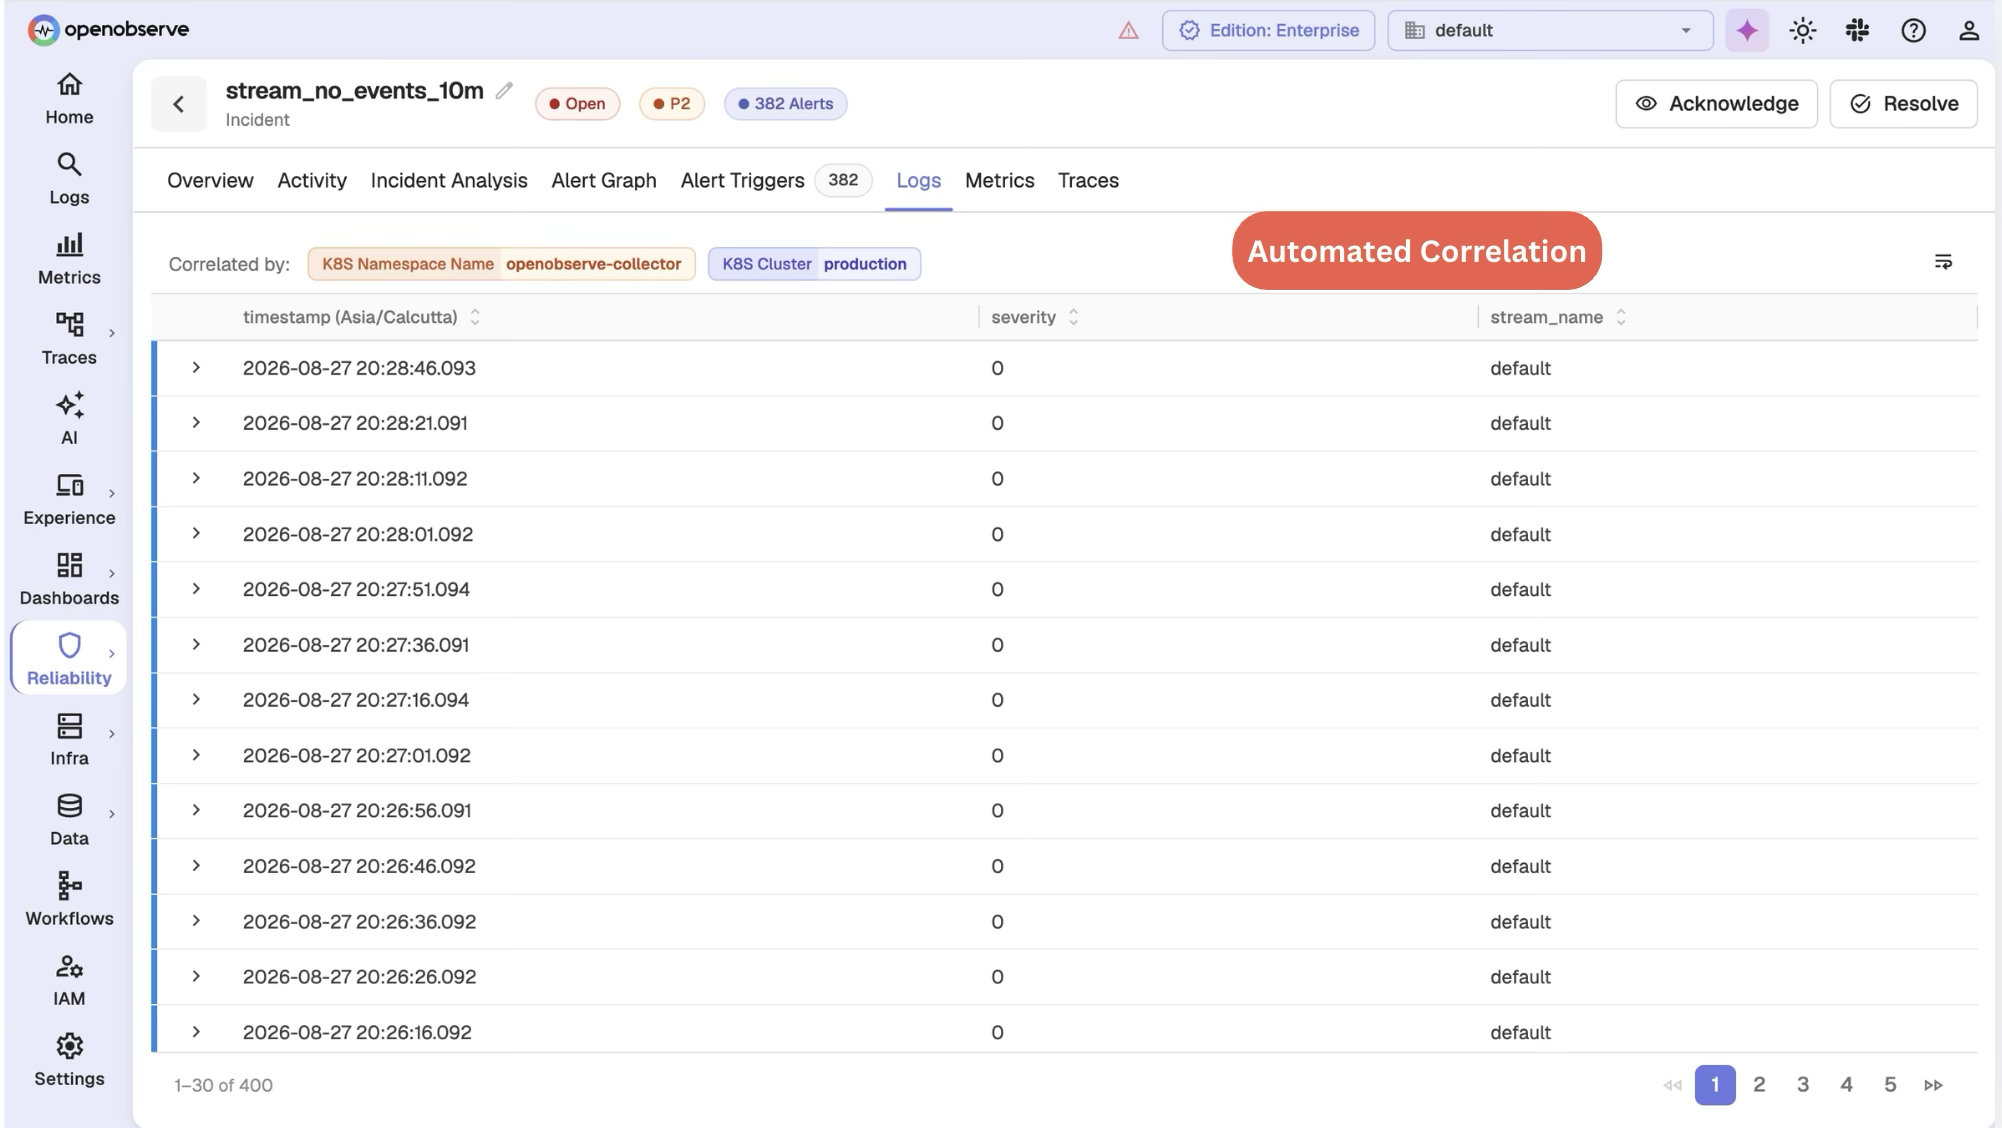
For the AIOps side, see what is AIOps? and our comparison of the top AIOps platforms.
How AI is changing incident response
- Investigation starts at alert time, not when someone acknowledges the page, so the first responder arrives to a working hypothesis.
- Mean time to resolution drops because the slowest part, finding the cause, is done in parallel with paging.
- Postmortems get easier, because the investigation is already written down with timestamps and evidence.
- Knowledge spreads, because a junior engineer on call gets the same structured investigation a senior engineer would run.
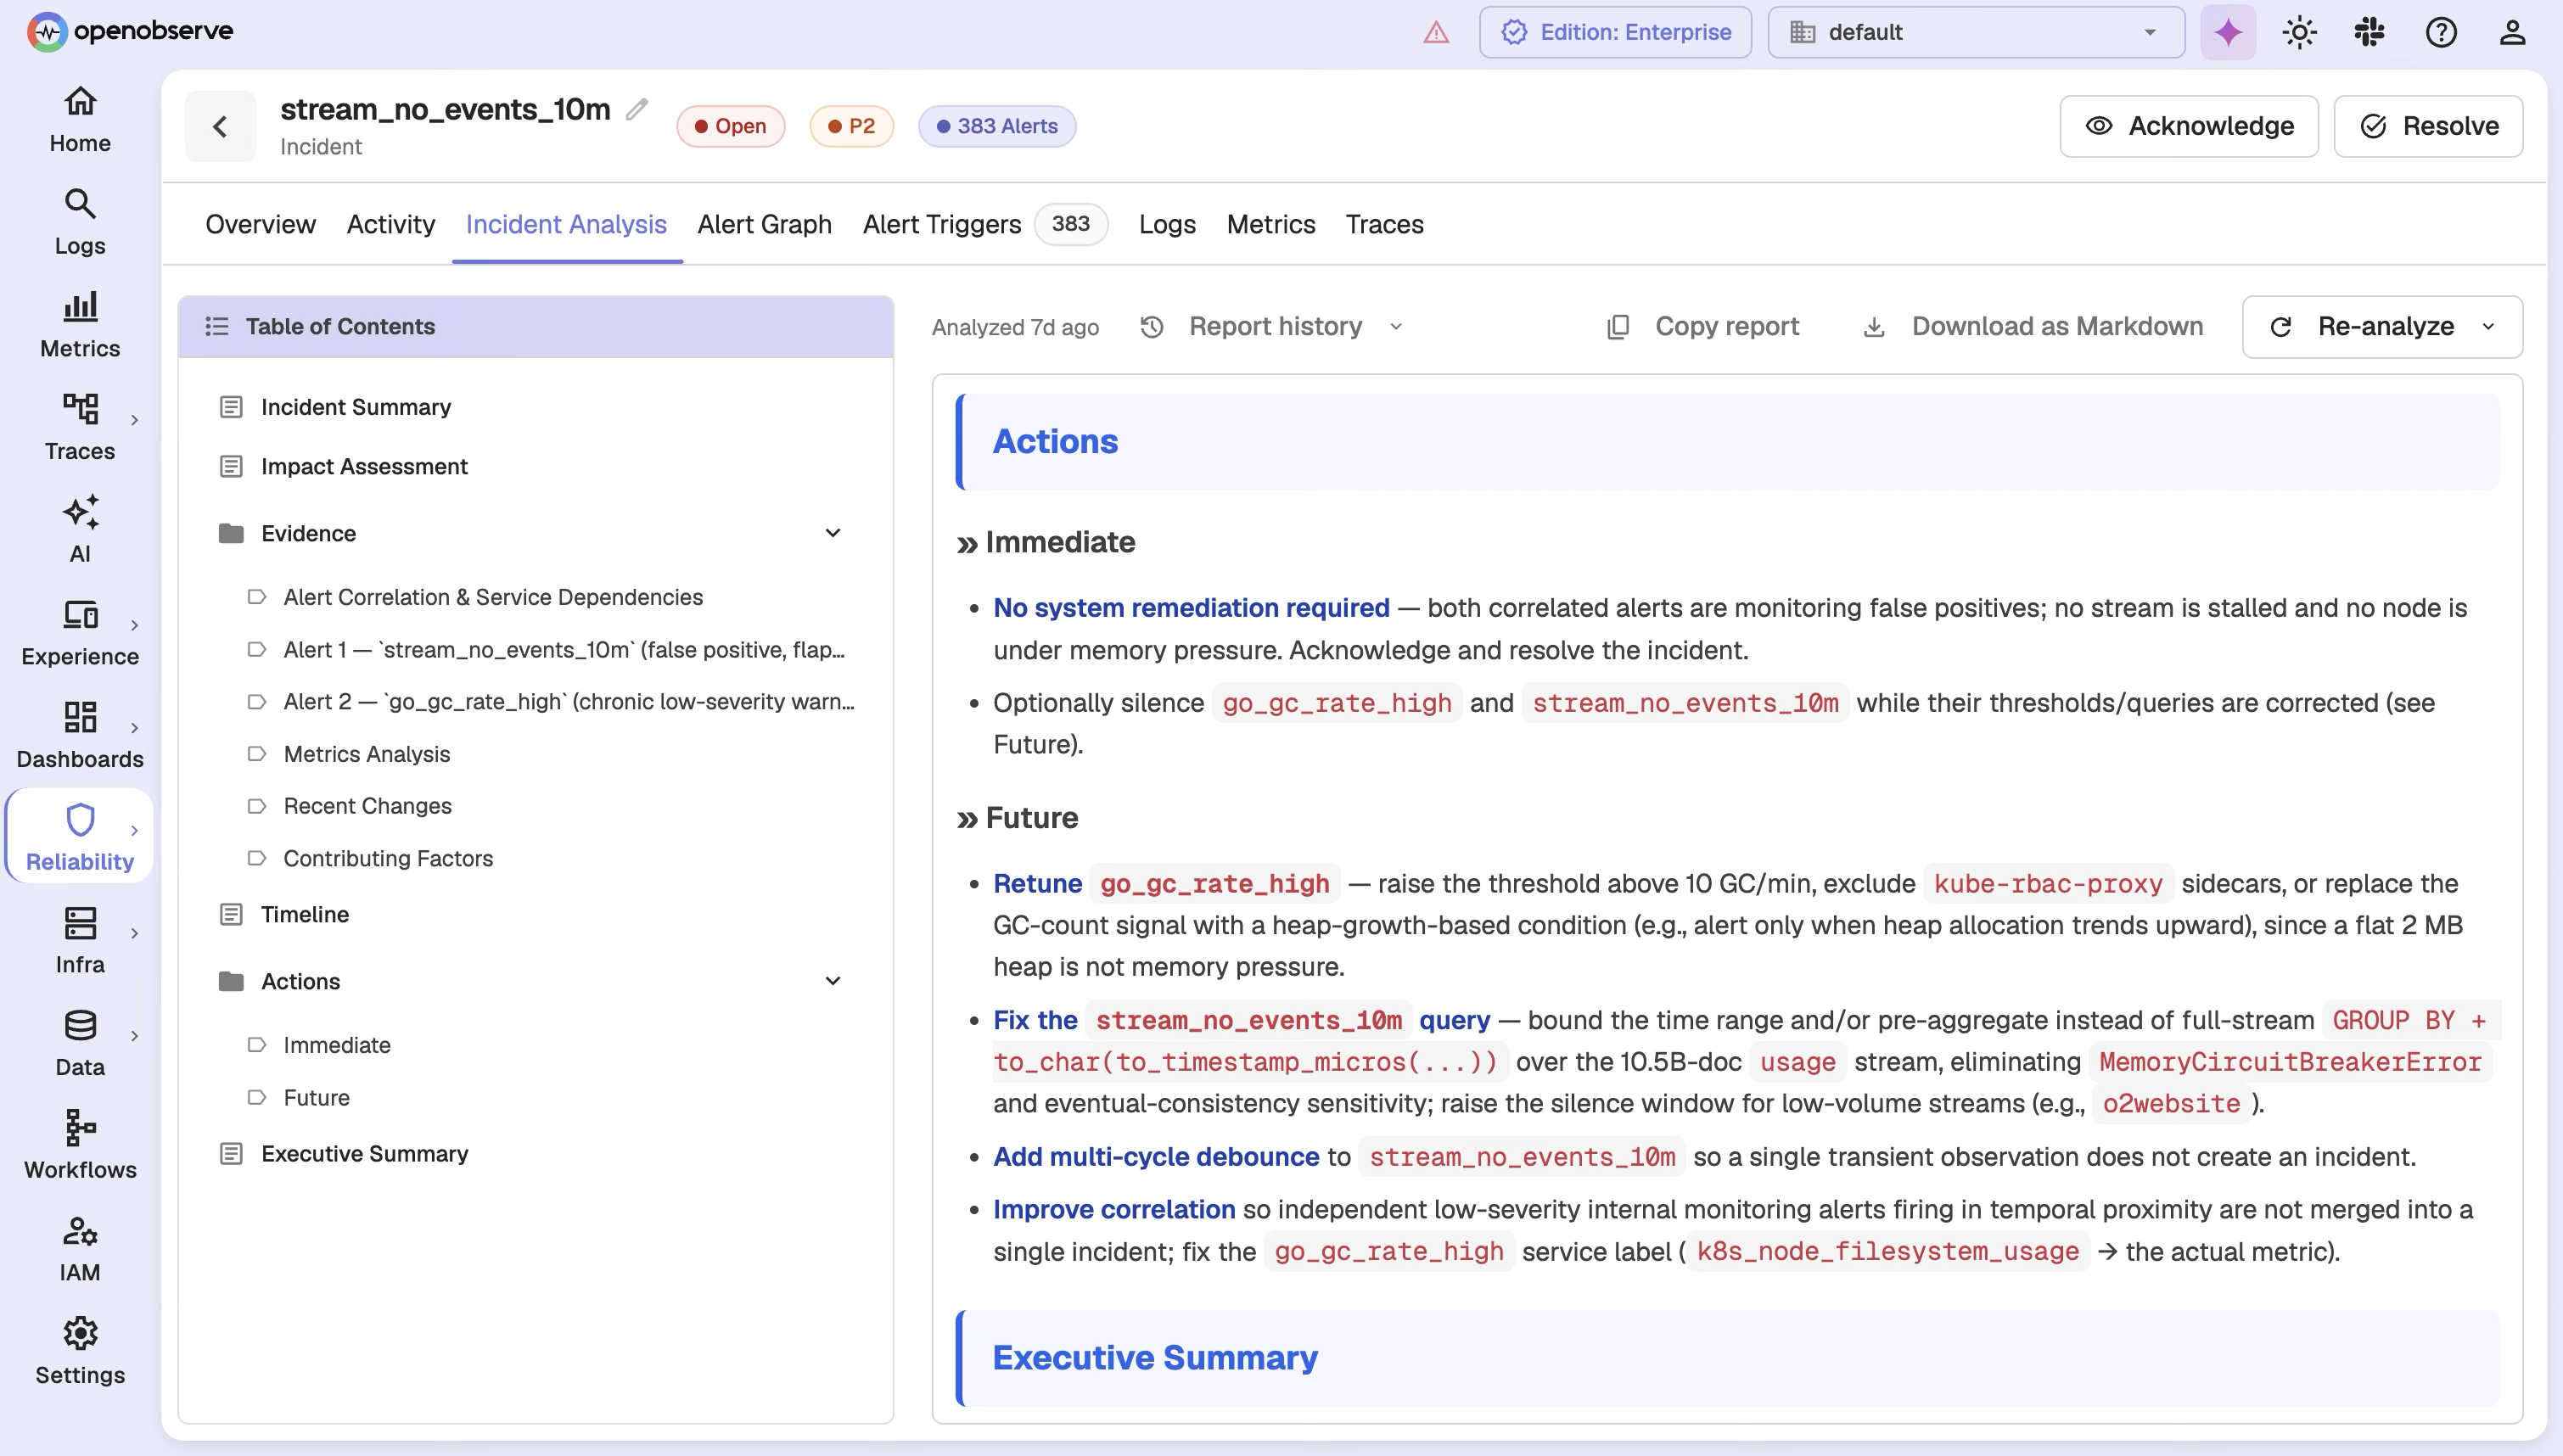
What doesn't change: humans decide what to do, approve changes to production, and own the follow-up. That's why a good report separates immediate actions from longer-term fixes and leaves the decision to the engineer:
How OpenObserve's AI SRE Agent works
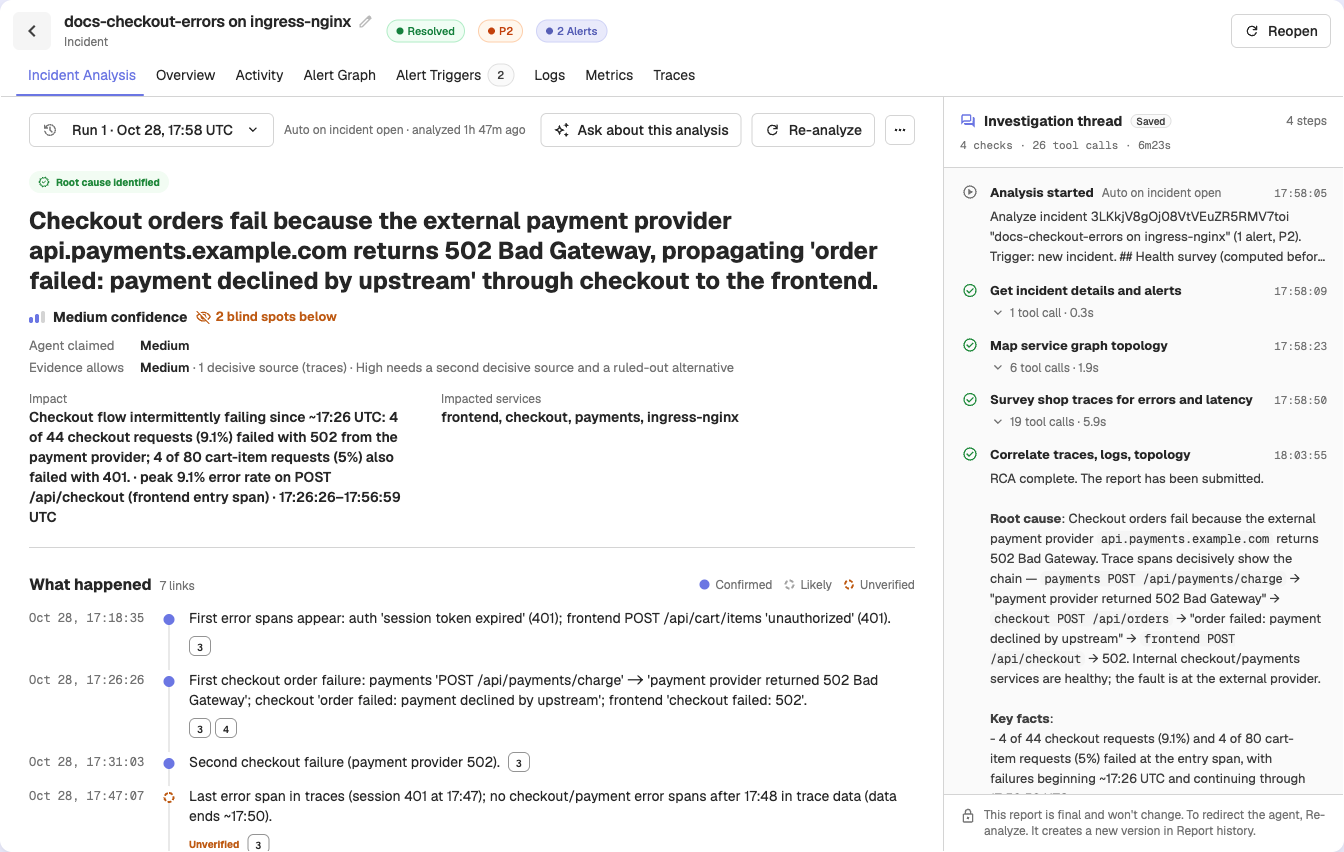
OpenObserve's AI SRE Agent is built into Incident Management in OpenObserve Enterprise and Cloud. When related alerts are correlated into an incident, the agent checks the incident's alerts, topology, recent changes, traces, logs, and metrics, then writes a root cause analysis on the Incident Analysis tab:
- The root cause, with a confidence level and the impact.
- A What happened timeline, with each event marked confirmed, likely, or unverified.
- The hypotheses it considered, with their status, and the evidence behind them.
- Proposed actions, as suggestions only; nothing runs automatically.
- Blind spots: what it couldn't check, with a suggested fix for each.
You can follow the agent's Investigation thread live, ask follow-up questions about the analysis, re-analyze, and download the report as Markdown. Analysis reruns automatically when the incident changes, such as when a new alert type joins or the incident reopens, and appends new findings rather than starting over.
The agent uses OpenObserve's own tools through MCP, and you bring your own AI provider (Anthropic, OpenAI, or Google Gemini), so your team stays in control of security and spend. The same agent powers the AI Assistant for natural-language queries across logs, metrics, and traces. See the AI SRE Agent page and the SRE Agent setup docs.
The agent works because it runs on a complete observability platform:
- Telemetry: logs, metrics, and traces with a service graph and service catalog, plus continuous profiles.
- Frontend monitoring: real user monitoring (RUM), session replay, and error tracking.
- Synthetic monitoring: scheduled browser and protocol checks.
- AI: AI Assistant, SRE Agent for AI root cause analysis, an MCP server, LLM observability and evaluations, anomaly detection, log patterns, and insights.
- Alerting and reliability: scheduled, real-time, composite, and anomaly alerts, incident management, and SLOs with error budgets and burn rates.
- Dashboards and reports: real-time dashboards and scheduled PDF, PNG, or CSV reports.
- Data processing: pipelines, VRL functions, enrichment tables, and metrics downsampling.
- Storage and cost: Parquet on object storage, Bring Your Own Bucket on Cloud, extended retention, and ingest-based pricing with unlimited users.
- Security and governance: SSO, RBAC, multi-tenancy, sensitive data redaction, audit trail, cipher keys, and federated search.
- Compliance: SOC 2 Type II, ISO 27001, and GDPR via the EU-Central 1 (Frankfurt) region.
- Open standards: OpenTelemetry-native ingestion, PromQL and SQL querying, and open source under AGPL-3.0.
Get started with OpenObserve
- Sign up for OpenObserve Cloud with a 14-day free trial and route your alerts into Incident Management.
- Read our guide to reducing MTTD and MTTR with alert correlation.
Frequently Asked Questions
About the Author
Simran Kumari

Passionate about observability, AI systems, and cloud-native tools. All in on DevOps and improving the developer experience.
Follow OpenObserve on Google
Add OpenObserve as a preferred source to see more of our articles in Google Search and Top Stories.