Getting Started with OpenObserve
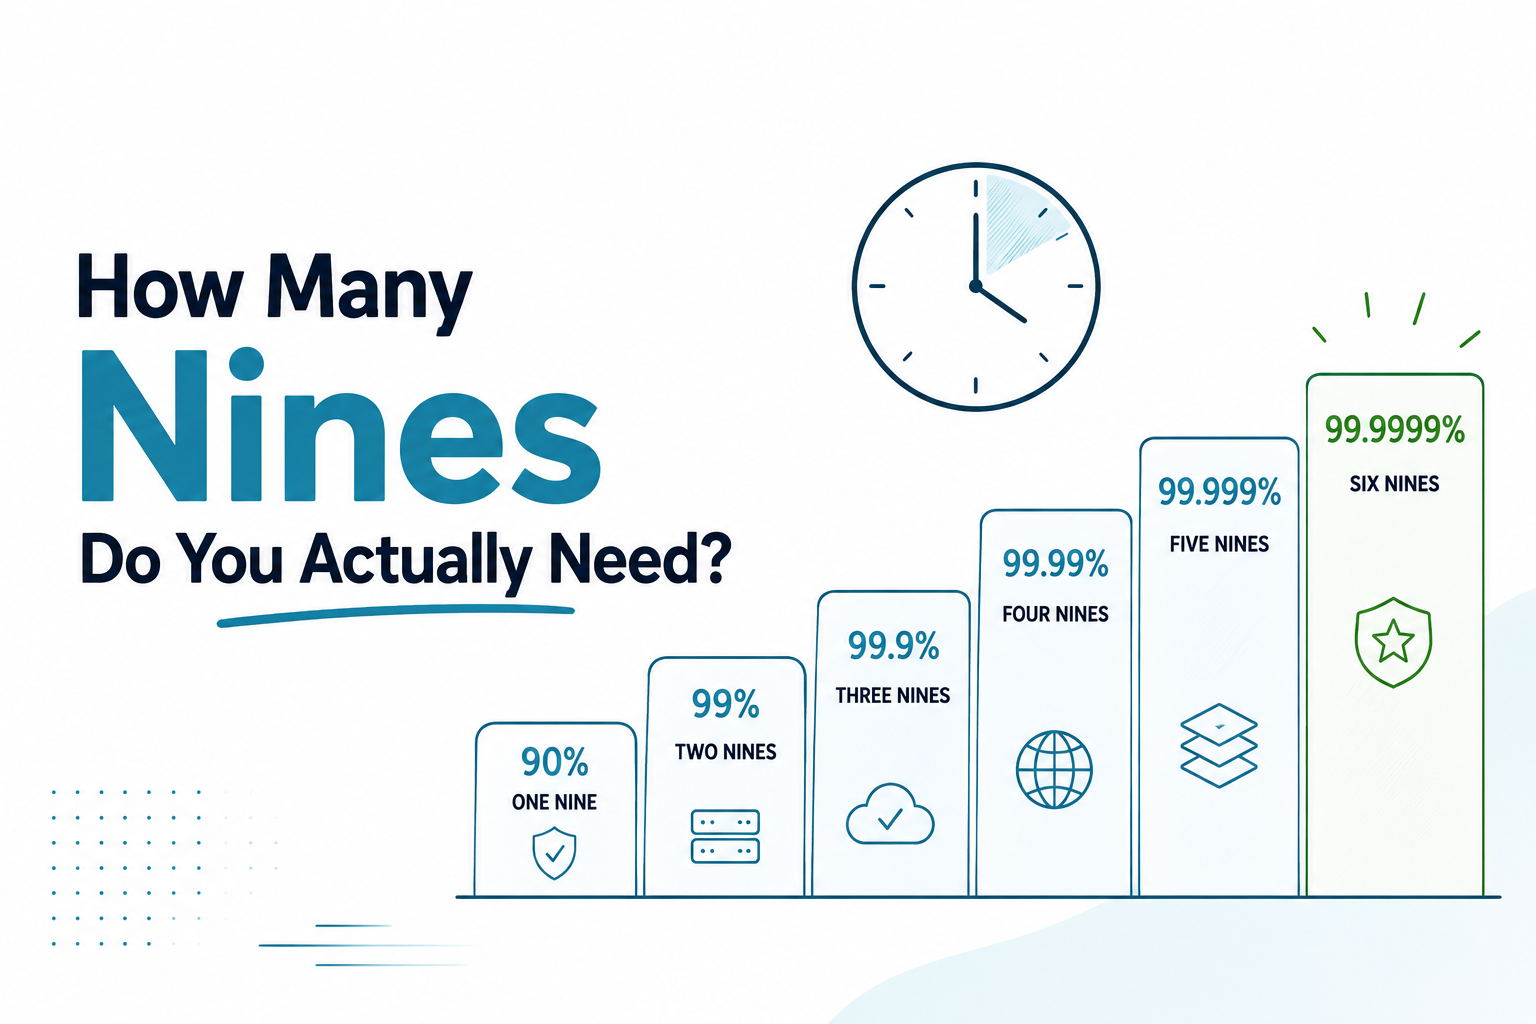
The cost curve of availability: what each nine allows in downtime, what it costs to build, and why most services should target fewer nines.
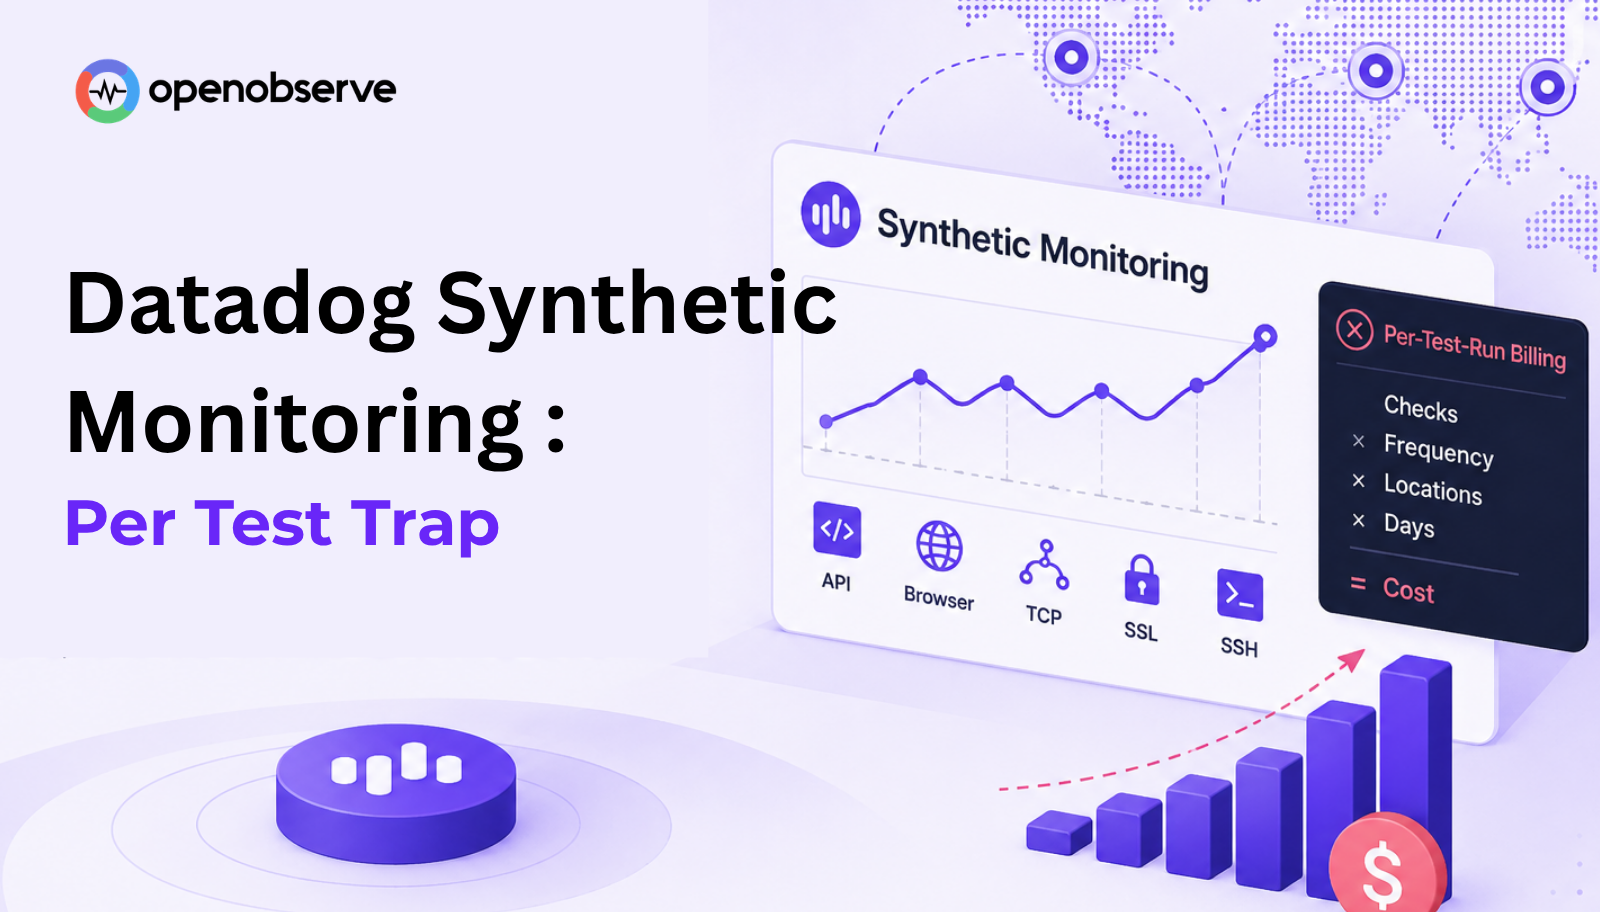
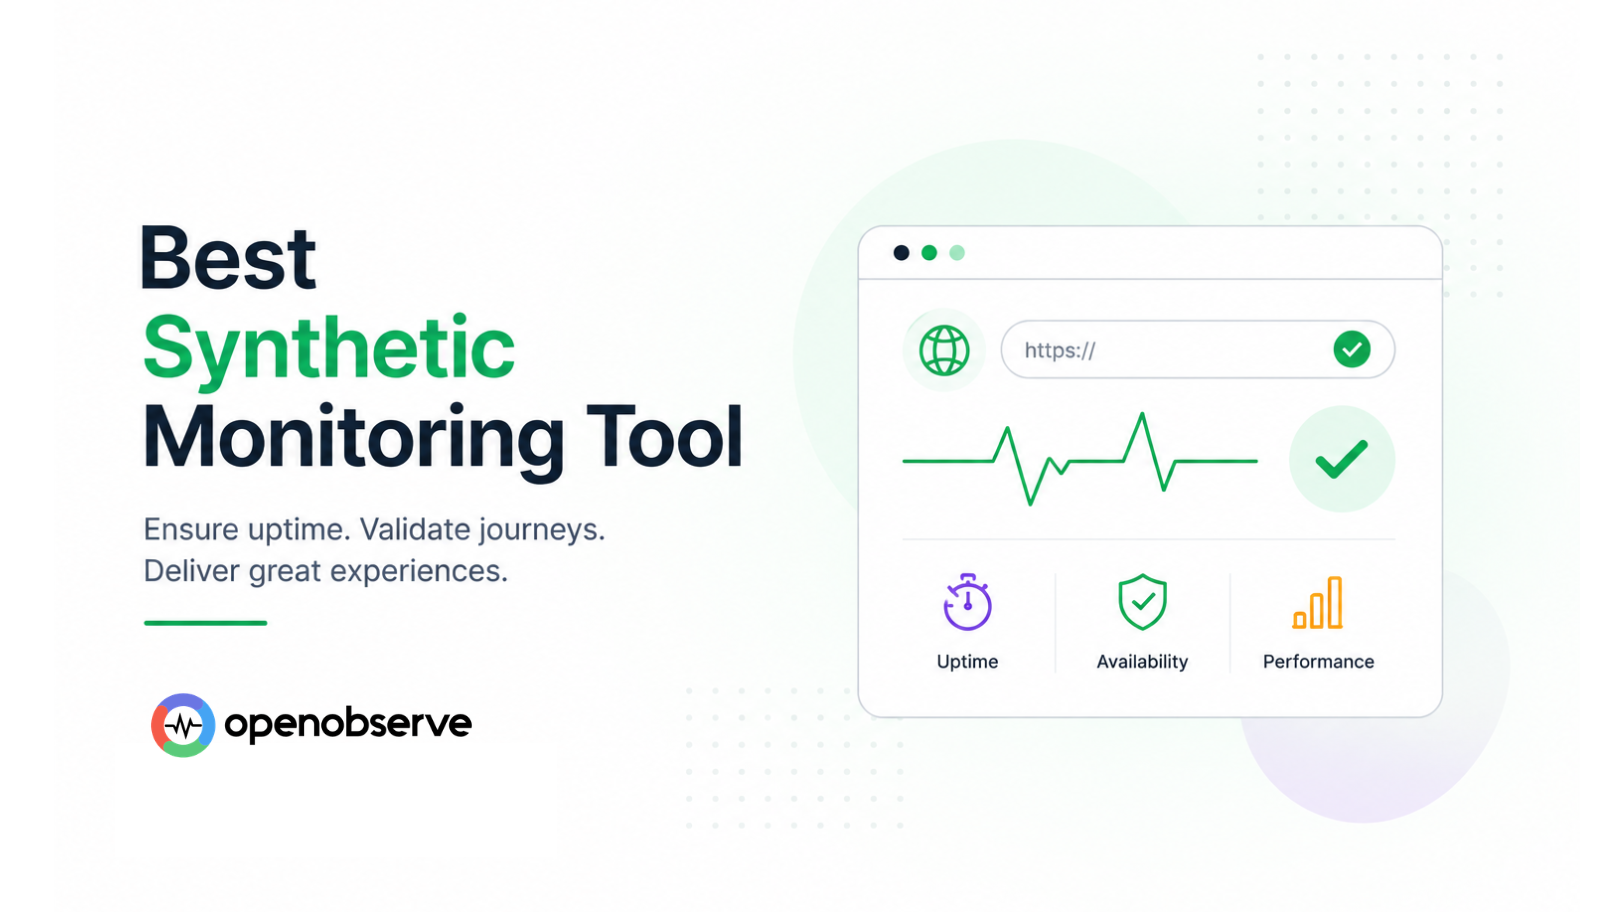
A complete comparison of the best synthetic monitoring tools in 2026: HTTP, TCP, TLS, SSH, and browser checks, private location support, alerting, and pricing, for engineering, SRE, and platform teams.

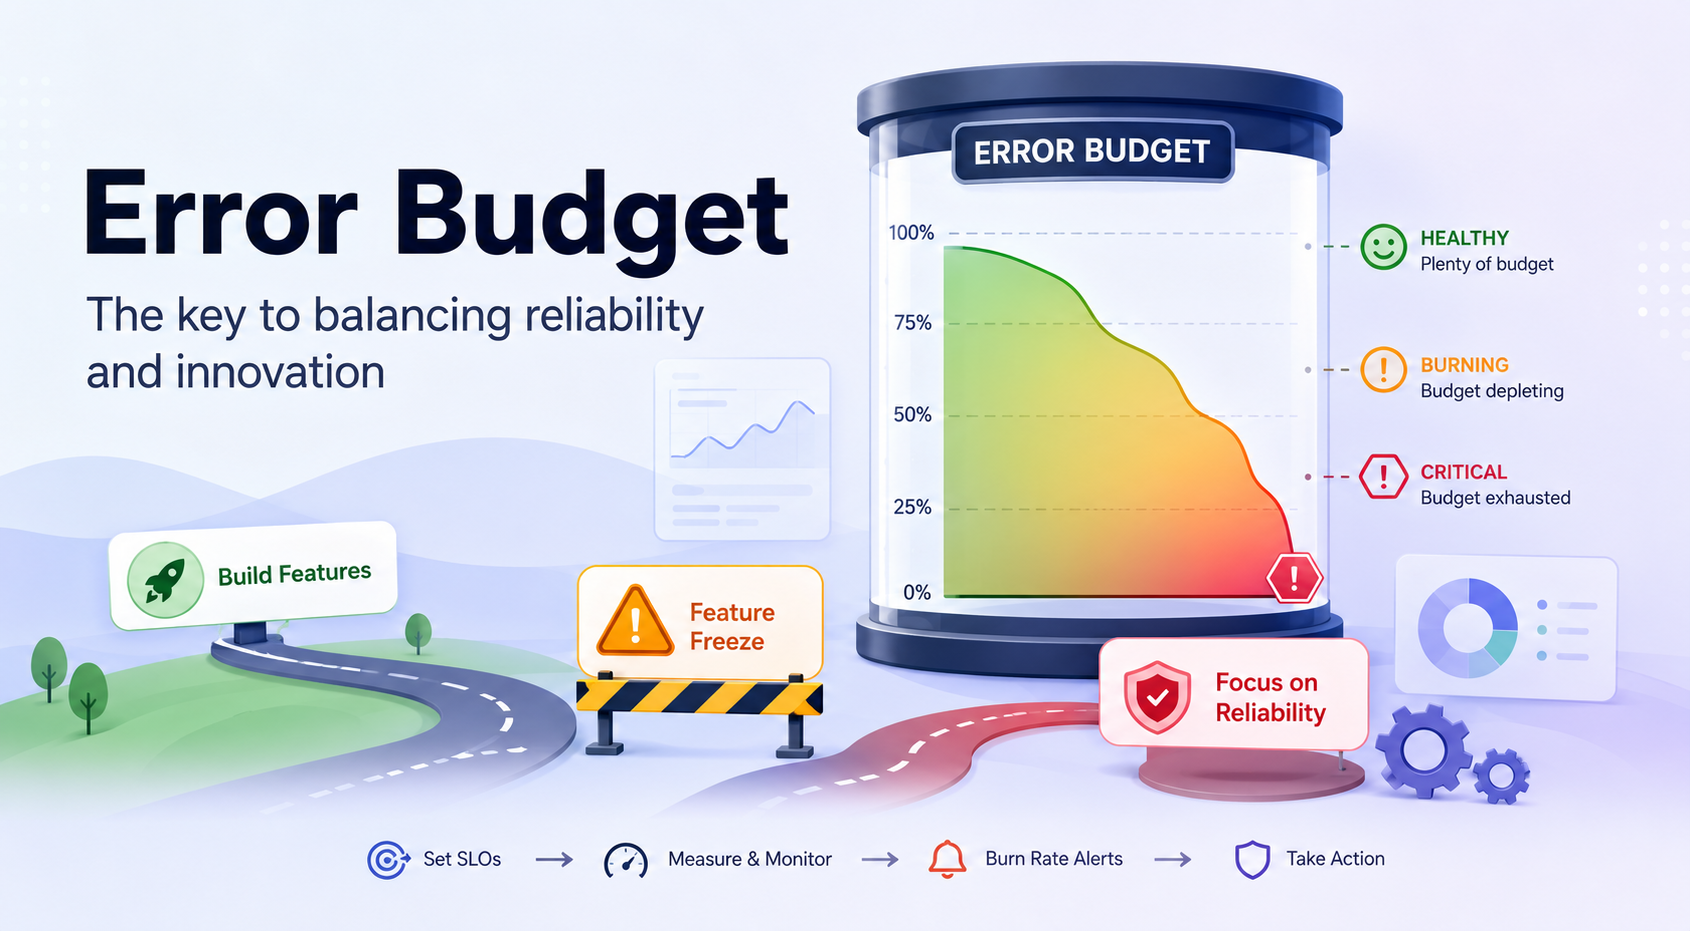
Error budgets explained: how they work, how to write an error budget policy, and what actually happens when the budget runs out.
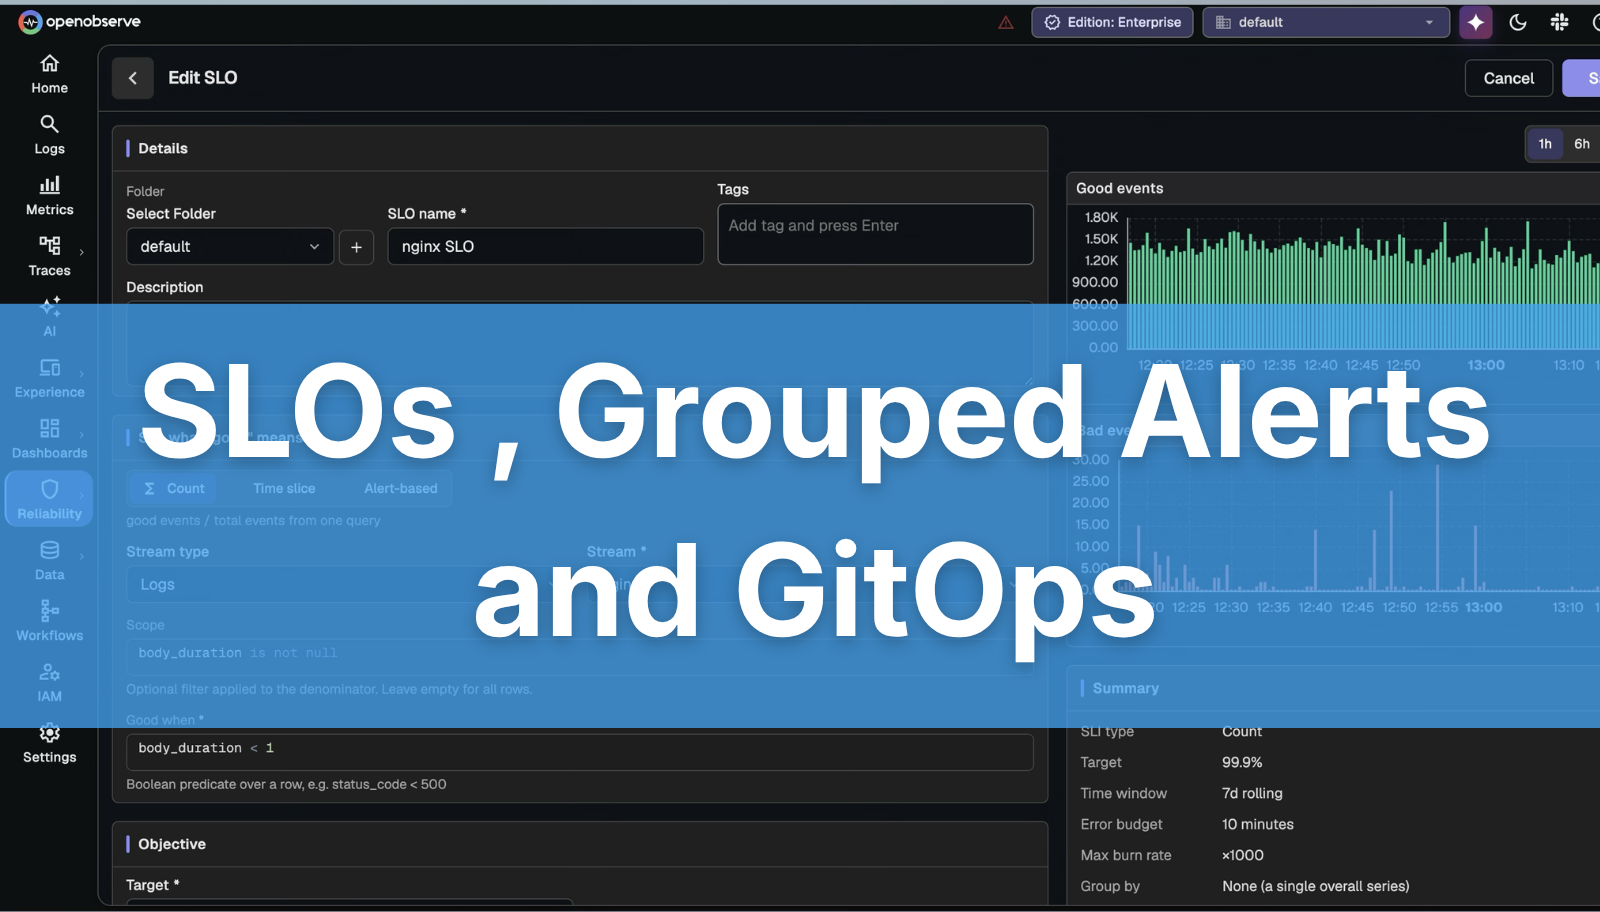
Struggling with SLOs? Learn how to set meaningful Service Level Objectives that reflect real user impact. Avoid common mistakes, define better SLIs, and build effective SLO-based alerting.
Struggling with alert fatigue? Learn how to reduce noisy alerts, improve signal quality, and build effective alerting strategies that actually help teams respond faster.
Twelve config-level tactics for observability cost optimization, sampling, pipeline filtering, retention tiers, and cardinality control, with before/after numbers and real config examples for logs, metrics, and traces.
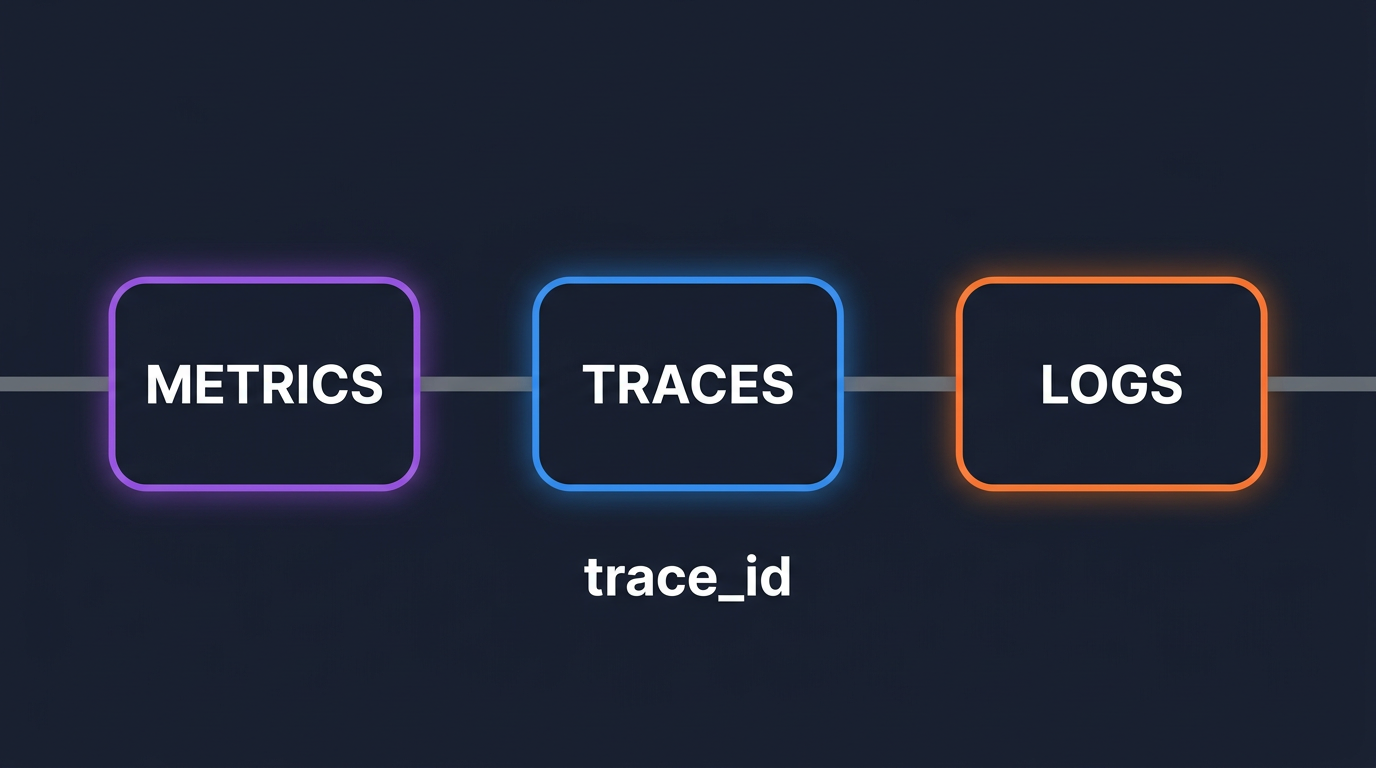
Stop tab-switching at 3AM. Wire trace_id into logs and exemplars into metrics so you can pivot from alert to root cause in seconds, not hours.
A practical on-call runbook template built for SREs and on-call engineers. Includes a 5-phase response framework, first-5-minutes checklist, and AI-assisted debugging with OpenObserve MCP.
OpenTelemetry is free, but your observability backend is not. Learn practical strategies for observability cost reduction using sampling, filtering, retention, and backend architecture choices.
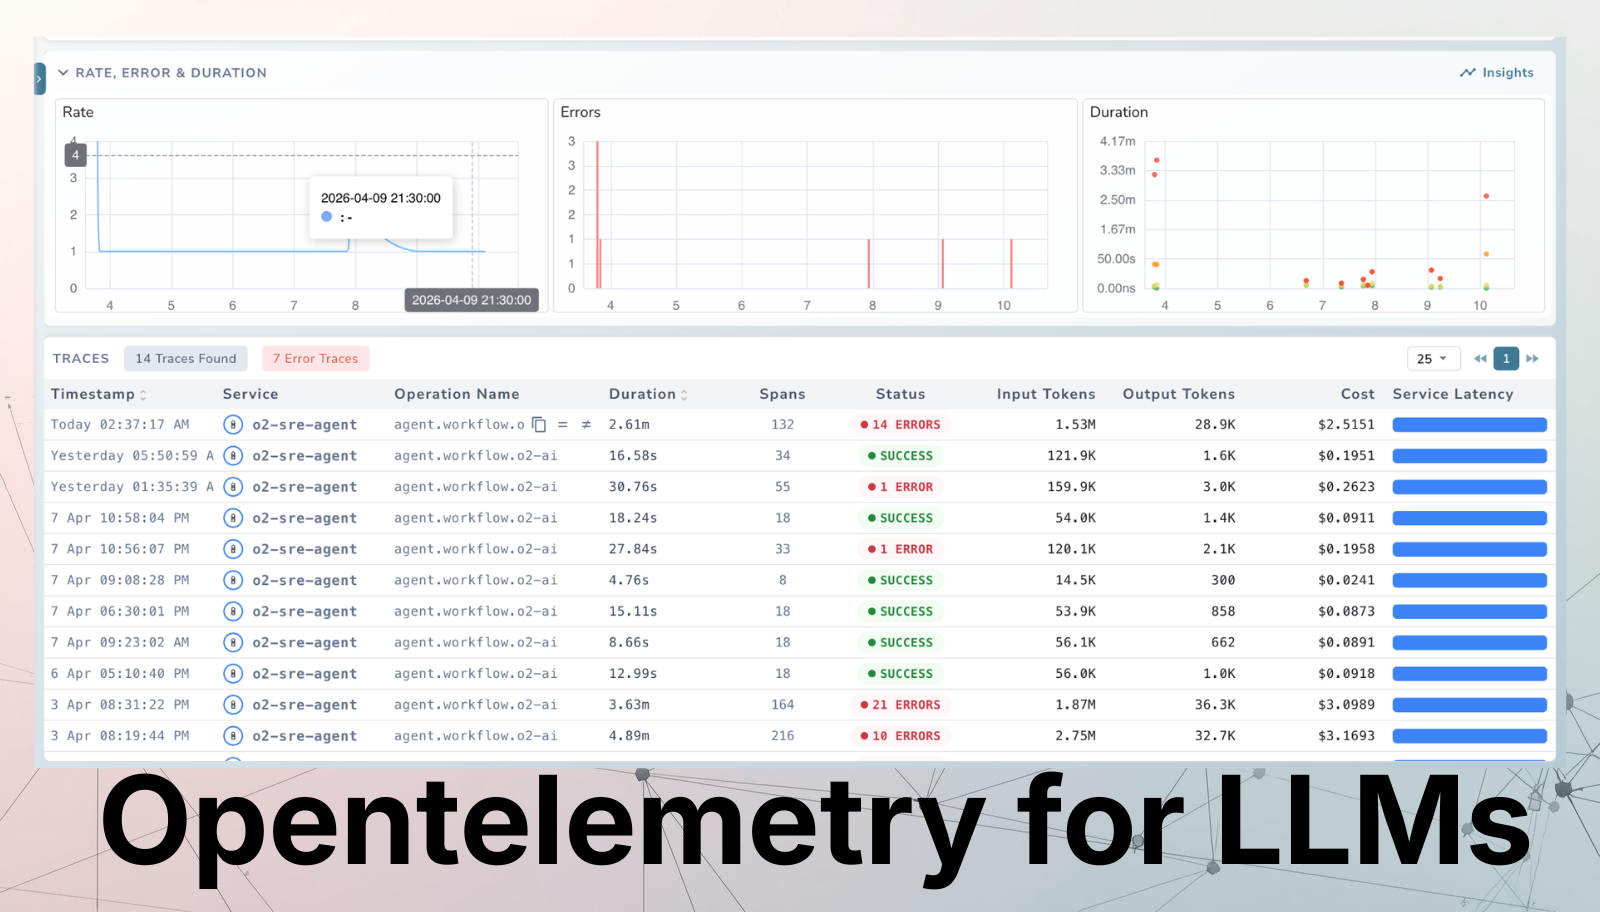
Learn how OpenTelemetry's GenAI Semantic Conventions bring production-grade observability to LLM workloads. A complete guide for DevOps and SRE teams covering traces, metrics, logs, and a hands-on RAG instrumentation walkthrough.