One platform for every signal,
everywhere you run it
Logs, metrics, traces, frontend and synthetic monitoring in one Rust-built engine - auto-correlated across your whole stack. Cloud, your own bucket, on-prem or fully air-gapped.
- No credit card
- 50 GB/day free self-hosted
- Deploy in under 2 minutes
















Four reasons teams switch to OpenObserve
Every claim is measured against a named product - not an industry average.
Keep a year of logs on 1/140th the storage and 1/30th the compute
Columnar Parquet storage, written in Rust on the DataFusion engine. There is no index to build, so there is nothing to pay for twice.
See the benchmarks →5 PB/dayingested by a single customerProven at a scale most vendors quote as a roadmap item.Storage cost, same telemetry, same yearBoth bars drawn to scaleElasticsearch$140OpenObserve$1← that 4-pixel sliver is the entire bar140×lower storage costEvery $140 you spend keeping logs in Elasticsearch buys the same year of retention here for $1.
Explore the OpenObserve Platform
A modern, scalable architecture designed for high performance and low cost


- Service Catalog
- Anomaly Detection
- O11y 4.0










Explore the OpenObserve Platform
A modern, scalable architecture designed for high performance and low cost
- Service Catalog
- Anomaly Detection
- O11y 4.0
Every signal, one platform
Petabyte-scale log search
Ingest and query trillions of log lines with familiar SQL: no indexing tax, no surprise storage bills.
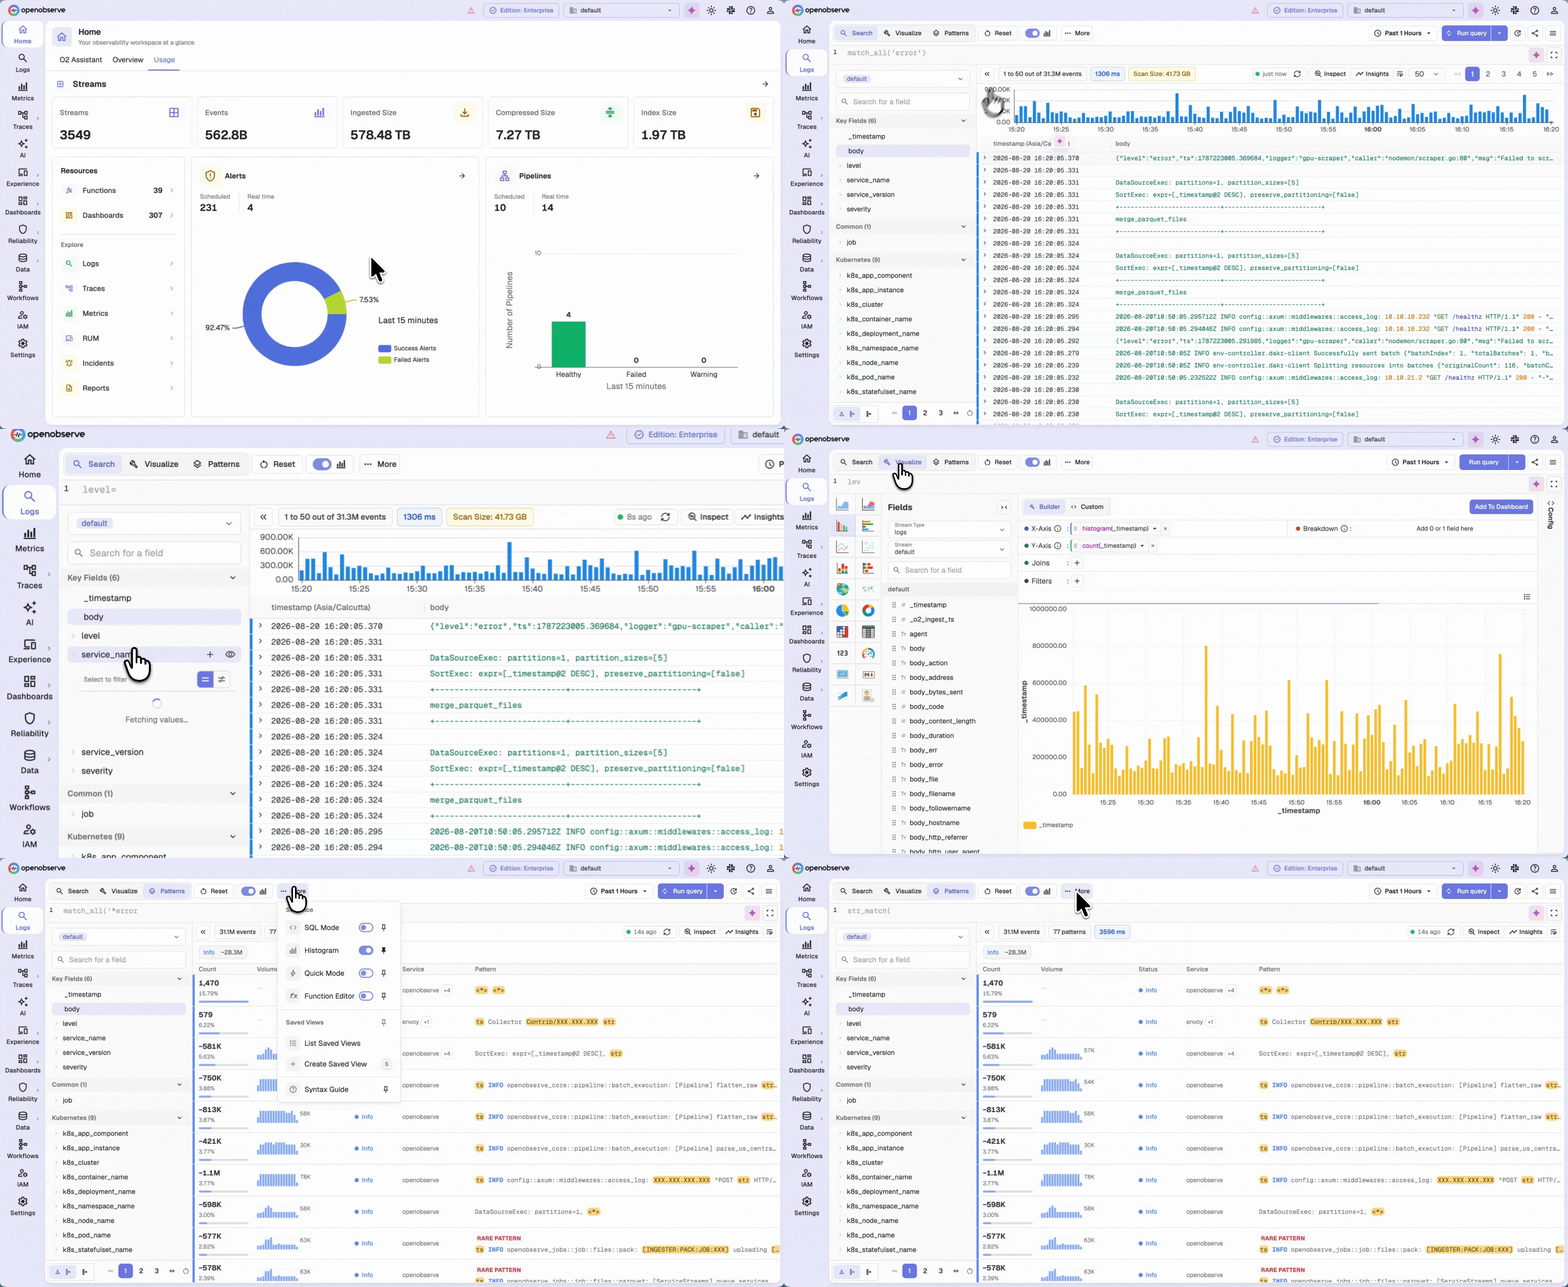
Petabyte-scale log search
Ingest and query trillions of log lines with familiar SQL: no indexing tax, no surprise storage bills.
Metrics
Store and query Prometheus-compatible metrics at any scale, with the same engine powering your logs.
Distributed tracing
Follow every request across services with full trace context, auto-correlated with logs and metrics.
Build dashboards in minutes
Drag-and-drop panels across every signal, or bring your existing Grafana boards straight over.
Alerts
Set real-time and scheduled alerts on logs, metrics and traces, and route notifications to Slack, PagerDuty, email and more.
AI SRE agent
An always-on agent that triages incidents, correlates root cause, and drafts the postmortem for you.
AI assistant
Ask natural-language questions across every log, metric, and trace. Get an answer, not another query language.
LLM Observability
Trace prompts, completions, token usage and cost across your LLM applications to debug quality and spend.
Real user monitoring
See exactly how real users experience your app: session traces, Core Web Vitals, and errors, correlated with backend traces.
Synthetic monitoring
Proactively monitor your applications and services from outside-in.
Index 100%. Query it in seconds.
Sampling is a cost workaround that costs you the incident. We index everything and stay fast - there is no hot tier, cold tier or re-indexing step.
A 10 TB dashboard query, fully indexed
5 PB/day
largest single customer ingest
95×
compression on ingested volume
1 TB/day
on a single node
What makes it fast
Written in Rust
Predictable memory, no GC pauses under load
Columnar Parquet + high compression
Scan the two columns you asked for, not the row
Object storage native
Stateless nodes, no replication to manage
Federated search
Query across regions and clouds without egress bills
12,400 alerts. One incident. One root cause.
With separate tools this outage would have paged four teams with thousands of alerts. Because every layer is in one engine, the AI SRE collapses it into a single incident with a timeline, impacted services, an executive summary and corrective actions.
- Root cause across app, database, network and cloud - not just the layer you instrumented
- Pivot between any signal mid-incident without writing a query
- Workflows open and close the ServiceNow ticket automatically
INC-2471 · Checkout degradation
P1 · 14 min
Raw alerts
12,400
Delivered
4
Incidents
1
Timeline
- 09:12RUM: checkout LCP regression, 6.2% of sessions
- 09:14Traces: payments-api p95 4.2 s, connection pool at 100%
- 09:15Postgres: seq scans on orders ×340, planner stats stale
- 09:16Root cause identified · corrective action proposed
Corrective action
ANALYZE orders; - planner reverted to seq scan after the 09:04 bulk load. Re-enable autovacuum analyze threshold on orders.
New since your last look
If you evaluated OpenObserve six months ago, this is what changed.
AI SRE
Automated triage, root-cause analysis and corrective actions across every layer you monitor.
SLOs
Define the availability or latency you committed to and track error-budget burn against it.
Synthetic monitoring
Playwright browser tests, API and SSH checks, run on your cadence from multiple geographies.
Workflows
Dynamic routing per service, plus open and close ServiceNow tickets on incident lifecycle.
Metric graph library
Every metric ships with its three most useful graphs pre-built. No panel-building mid-incident.
Rebuilt UI
A significantly faster, more modern interface - the biggest gap in the product, closed.
Plug into the stack you already have
Native OpenTelemetry plus every collector your estate already runs. Pick a source and the setup is right there - no proprietary agent to roll out, and none to rip out later.
Recommended / Kubernetes
Kubernetes
Deploy the OpenObserve collector to your cluster - container logs, Kubernetes events and cluster metrics, plus zero-code traces for your workloads.
Loading setup steps...
Questions evaluators actually ask
What the OpenObserve platform includes and how it differs from a pieced-together stack.

Ready to get started?
Try OpenObserve today for more efficient and performant observability.
