What Is LLM Observability? The Complete 2026 Guide




Ready to get started?
Try OpenObserve Cloud today for more efficient and performant observability.
TL;DR
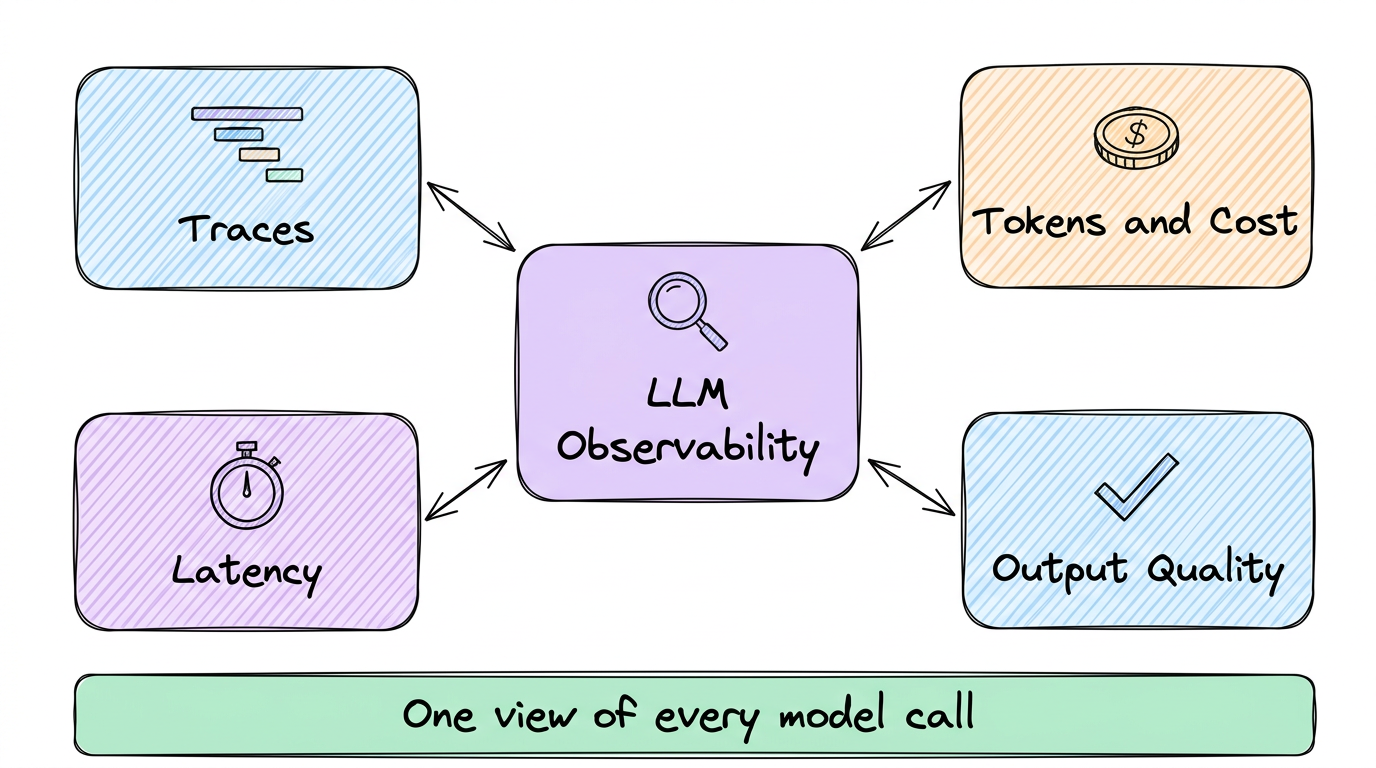
LLM observability is the practice of collecting and correlating telemetry from large language model applications, prompts, responses, token usage, latency, tool calls, and quality scores, so you can explain what the model did and why. It exists because LLM apps fail silently: a request can return HTTP 200 in normal latency and still be wrong.
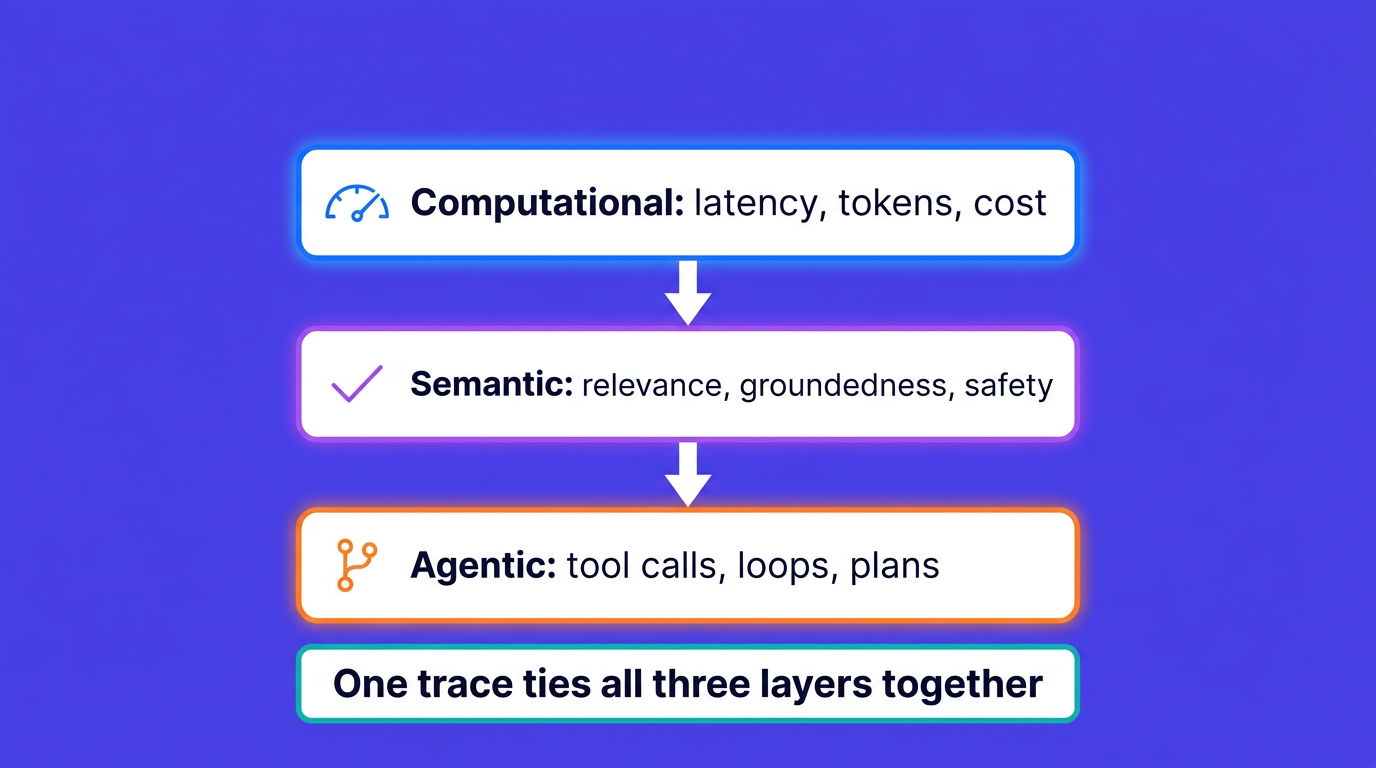
- It covers three layers: computational (latency, tokens, cost), semantic (relevance, groundedness, safety), and agentic (tool calls, loops, reasoning paths)
- Traditional APM cannot see the failures that matter: hallucinations, bad retrievals, and prompt drift never raise an error
- OpenTelemetry GenAI semantic conventions (gen_ai.* span attributes) are becoming the instrumentation standard, still pre-stable but widely emitted
- The trace is the unit of debugging: one user interaction, with every model call, retrieval, and tool call as spans
- Tooling splits two ways: LLM-native point tools (Langfuse, LangSmith) versus unified platforms that keep LLM traces next to logs, metrics, and infrastructure traces
What is LLM observability?
LLM observability is the set of practices and tooling that gives engineering teams visibility into how a large language model application behaves in production: what went into the model, what came out, what it cost, how long it took, and whether the output was any good. Where classic observability answers "is the service up and fast," LLM observability also has to answer "was the response correct, grounded, and safe," a question that no status code will ever answer for you.
In practice it covers four things:
- Tracing: recording each user interaction end to end, including prompts, model calls, retrievals, and tool calls as structured spans
- Quality evaluation: scoring outputs for relevance, groundedness, and safety, automatically or with human feedback
- Cost and token accounting: attributing input and output tokens, and the dollars behind them, to requests, users, and features
- Prompt and context visibility: knowing which prompt version, retrieved documents, and parameters produced a given response
The need is not niche anymore. McKinsey's State of AI survey reports that 78 percent of organizations now use AI in at least one business function. Most of those systems ship on top of a model the team does not control, cannot step through with a debugger, and pays for by the token. Observability is the only instrument panel you get.
Why traditional APM misses LLM failures
Application performance monitoring was built for deterministic software. The same input produces the same output, failures surface as exceptions or status codes, and a green dashboard means the system works. None of those assumptions hold for an LLM application.
The model is non-deterministic, so the same prompt can produce different answers on consecutive runs. The dangerous failures are silent: a support bot that confidently invents a refund policy returns HTTP 200 in perfectly normal latency. And the unit of work is no longer one request to one service, it is a chain: user input, retrieval, prompt assembly, one or more model calls, tool invocations, post-processing. When the final answer is wrong, the fault can sit in any link.
| Traditional APM signal | What it misses in an LLM app |
|---|---|
| Error rate | Wrong answers return 200 OK |
| Latency percentiles | A fast hallucination is still a hallucination |
| Throughput | Says nothing about cost, which scales with tokens, not requests |
| CPU and memory | The expensive resource is the model API, not your pods |
| Uptime checks | The service is "up" while quality quietly degrades after a prompt change |
This is why LLM observability is additive, not a replacement. You still need infrastructure metrics, logs, and distributed traces, the practices covered in our LLM monitoring best practices guide. The new discipline layers model-specific signals on top of them.
The three layers of LLM observability
The clearest way to think about what to collect is three layers, each answering a different question.
Computational: is it fast and affordable?
The layer closest to classic APM. These metrics come straight from the API response and your instrumentation:
| Metric | Why it matters |
|---|---|
| Latency p50 / p95 / p99 | Model APIs have long, fat tails; averages hide them |
| Time to first token | The latency users actually feel in streaming UIs |
| Input / output tokens per request | The real unit of spend and context-window pressure |
| Cost per request, per user, per feature | Token prices vary by model; attribution finds the expensive path |
| Error and rate-limit counts by provider | 429s and 5xxs from the provider need retries and fallbacks |
Cost deserves its own dashboards and budget alerts. Our LLM cost monitoring guide covers per-model and per-user attribution in depth.
Semantic: is the output any good?
The layer APM has no equivalent for. Semantic signals score the content of responses:
| Metric | Why it matters |
|---|---|
| Answer relevance | Did the response address the question at all |
| Groundedness / faithfulness | Is the answer supported by the retrieved context, or invented |
| Eval pass rate | Share of sampled production traffic passing automated checks |
| Safety and PII flags | Toxicity, prompt-injection attempts, sensitive data in prompts |
| User feedback rate | Thumbs-down clicks are the cheapest eval you will ever run |
Semantic scores usually come from automated evaluators, often an LLM judging another LLM's output on a sample of traffic, attached to the trace so a low score is one click from the prompt that caused it. Since prompts and responses routinely carry sensitive data, plan for PII redaction in LLM telemetry before you store any of this.
Agentic: did the system make good decisions?
Agents add a control-flow problem. The model decides which tools to call and when to stop, so you need to observe decisions, not just calls:
| Metric | Why it matters |
|---|---|
| Tool call count and failure rate | A flaky tool silently degrades every downstream answer |
| Loop iterations per task | Runaway retry loops burn tokens fast |
| Cost per completed task | An agent that succeeds in 40 steps may cost more than it saves |
| Trajectory length and dead ends | Reveals planning failures no single span shows |
We cover this layer in detail in our AI agent monitoring guide.
What to monitor in production: the trace is the unit
All three layers hang off one structure: the trace. A trace records a single user interaction end to end; each step, retrieval, prompt assembly, model call, tool call, is a span with its own attributes, timings, and parent. When something goes wrong, you do not grep logs, you open the trace and walk the tree.
A useful production trace for an LLM app captures:
- The full prompt and response (or a redacted version) on the model-call span
- Model name, parameters, and prompt version as span attributes
- Input and output token counts, and computed cost, per span
- Retrieval spans with the query, document IDs, and similarity scores
- Tool-call spans with arguments, results, and errors
- A session or conversation ID that groups related traces per user
That last item matters more than it looks. Aggregates tell you something is wrong; sessions tell you who it is happening to and how it unfolds across turns.
How instrumentation works: OpenTelemetry GenAI semantic conventions
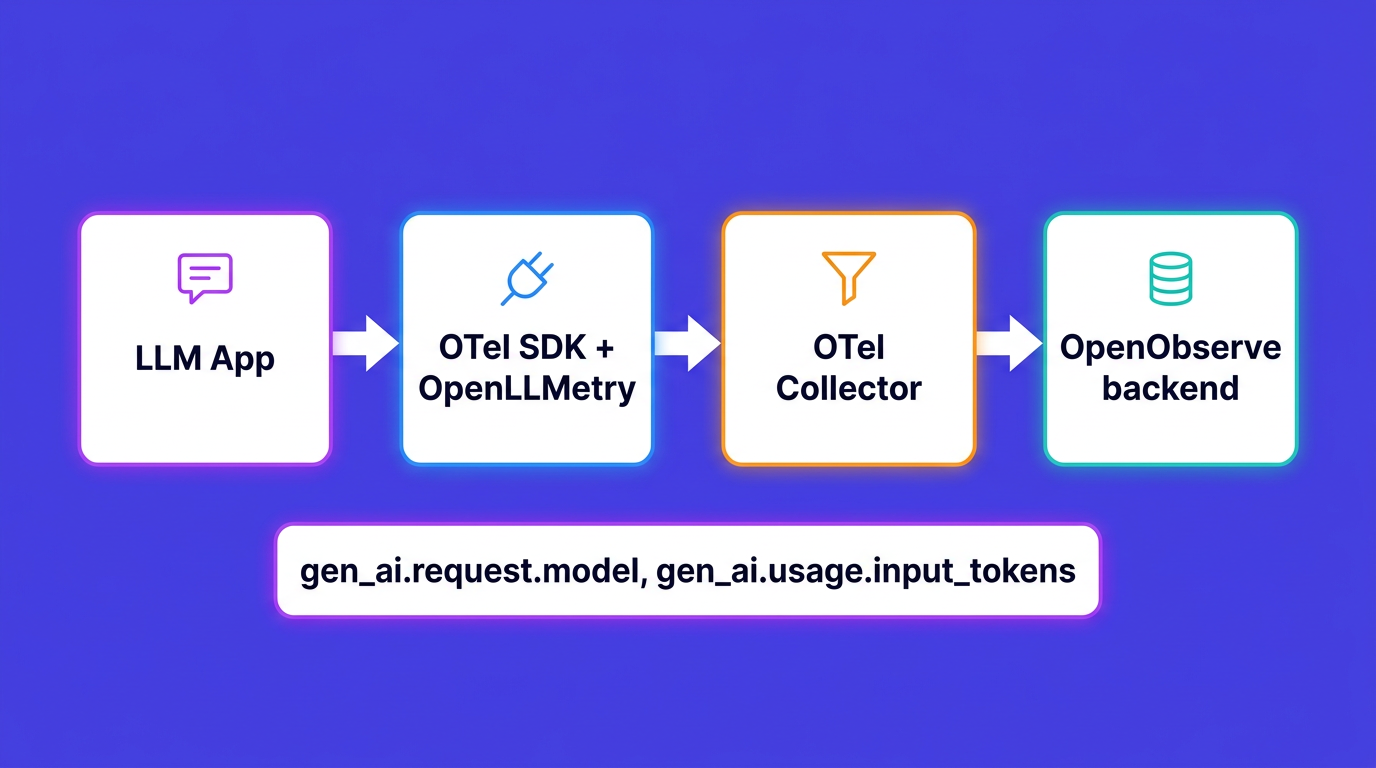
In 2026 the instrumentation question has a default answer: OpenTelemetry. The GenAI semantic conventions define standard span attributes for model calls, so every tool speaks the same schema:
| Attribute | Example |
|---|---|
gen_ai.operation.name |
chat |
gen_ai.request.model |
claude-sonnet-5 |
gen_ai.usage.input_tokens |
1874 |
gen_ai.usage.output_tokens |
312 |
gen_ai.response.finish_reasons |
["stop"] |
The conventions are still marked as in development, so expect some churn in attribute names between versions. The practical posture: adopt now, pin the convention version your instrumentation emits, and treat upgrades as schema migrations.
You rarely write these spans by hand. Instrumentation libraries such as OpenLLMetry and OpenLIT patch the OpenAI, Anthropic, and other provider SDKs and emit gen_ai spans automatically. Because the output is plain OTLP, pointing it at a backend is two environment variables:
OTEL_EXPORTER_OTLP_ENDPOINT="https://api.openobserve.ai/api/<your-org>"
OTEL_EXPORTER_OTLP_PROTOCOL="http/protobuf"
OTEL_EXPORTER_OTLP_HEADERS="Authorization=Basic <your-token>"
The alternative to SDK instrumentation is a proxy: route provider traffic through a gateway that logs every request. Proxies win on setup speed and lose on depth, they see model calls but not your retrieval steps, tool calls, or app logic, so chain and agent debugging stays dark. For the full instrumentation walkthrough, including manual spans, see OpenTelemetry for LLMs.
Observability for RAG pipelines and AI agents
Retrieval-augmented generation multiplies the places an answer can go wrong. The model can be fine while retrieval returns the wrong documents, the reranker buries the right one, or the chunking splits the answer across fragments. RAG observability means every hop is a span: the query, the retrieved chunk IDs and similarity scores, the rerank decision, and the final generation, so "why did it say that" becomes a lookup instead of an investigation.
Agents raise the stakes again. A single task fans out into dozens of model and tool calls with loops and branches, and the failure modes are behavioral: an agent that picks the wrong tool, retries forever, or wanders into a dead end. Trace trees with per-step attributes are the only way to reconstruct what the agent was "thinking" when it went sideways.
A real debugging walkthrough: the runaway token spike
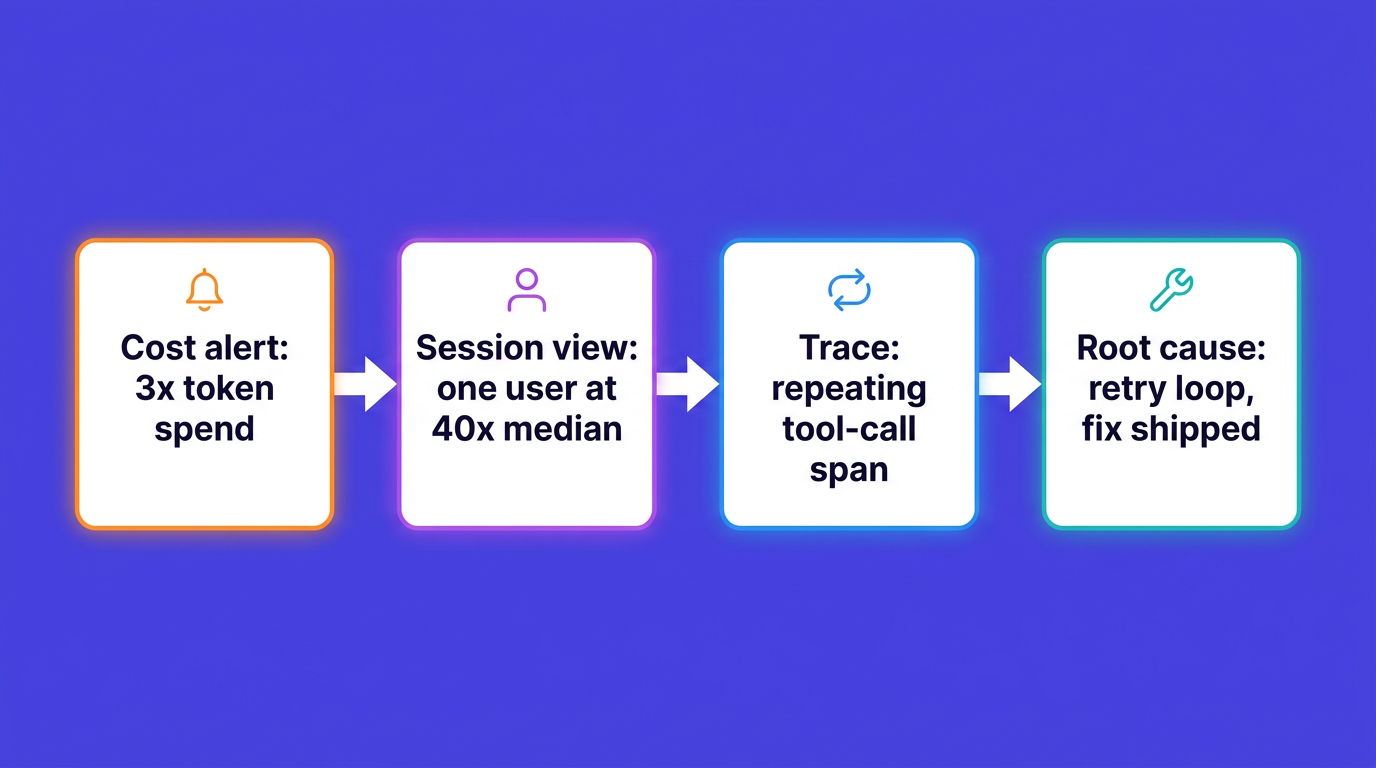
Here is what the discipline looks like when it pays off. A cost alert fires: token spend is 3x baseline for the day. Aggregate dashboards show the spike but not the cause.
- Session view: sorting sessions by token usage shows one user session consuming 40x the median. Not a traffic surge, a single conversation.
- Trace view: opening the session's traces shows the same tool-call span repeating. An agent hit a tool that returned a truncated response, decided the call failed, and retried, appending each failed attempt to the context window.
- Root cause: every retry made the prompt longer, so every retry cost more than the last. The fix was a retry cap and a validation check on tool output, a five-line change.
Total time from alert to root cause: minutes, because sessions, traces, and cost lived in the same place. We wrote up the full incident, from the RUM session to the trace to the fix, in tracing a runaway LLM token spike. Without session-level cost attribution, this class of bug shows up as an unexplainable invoice at the end of the month.
LLM-native tools vs unified platforms
The tooling market splits into two camps, and the honest answer is that each wins in different situations.
LLM-native tools (Langfuse, LangSmith, Arize Phoenix, Opik) go deep on the model layer: prompt management, playgrounds, evaluation pipelines, dataset curation. If your team's daily work is iterating on prompts and evals, that depth is real. The cost is a silo: your LLM traces live in one system while your logs, metrics, and infrastructure traces live in another, and correlating "the model got slow" with "the vector database got slow" means two tabs and two bills.
Unified platforms treat LLM telemetry as traces with special attributes, stored next to everything else. One query language, one alerting system, one place where an LLM latency spike and the Kubernetes event behind it appear on the same screen. The trade-off is that evaluation and prompt-management features are thinner, typically handled by pairing with an eval library.
When a point tool is enough: you are pre-production, one team, iterating on prompt quality, and infrastructure correlation does not matter yet. When unification matters: you run production workloads where cost, latency, and reliability incidents cross the boundary between model and infrastructure, which in our experience is most of them, usually starting the first week after launch. For a full comparison of the open source options in both camps, see our LLM observability tools roundup; for commercial and enterprise platforms like Datadog, Arize AI, and LangSmith, see Top 10 LLM Observability Tools in 2026.
Monitor LLM apps with OpenObserve
OpenObserve is an OpenTelemetry-native backend that stores LLM traces, gen_ai attributes included, next to your logs, metrics, and infrastructure traces, with SQL to query across all of them and session views that group model calls by conversation and cost. It is open source and self-hostable, so prompts and responses stay on your infrastructure. See the LLM observability feature overview or start free on OpenObserve Cloud.
Frequently Asked Questions
About the Author
Gorakhnath Yadav


Gorakhnath is a passionate developer advocate, working on bridging the gap between developers and the tools they use. He focuses on building communities and creating content that empowers developers to build better software.
Follow OpenObserve on Google
Add OpenObserve as a preferred source to see more of our articles in Google Search and Top Stories.













