ClickHouse vs OpenObserve for Logs, Metrics & Traces (2026)




Ready to get started?
Try OpenObserve Cloud today for more efficient and performant observability.
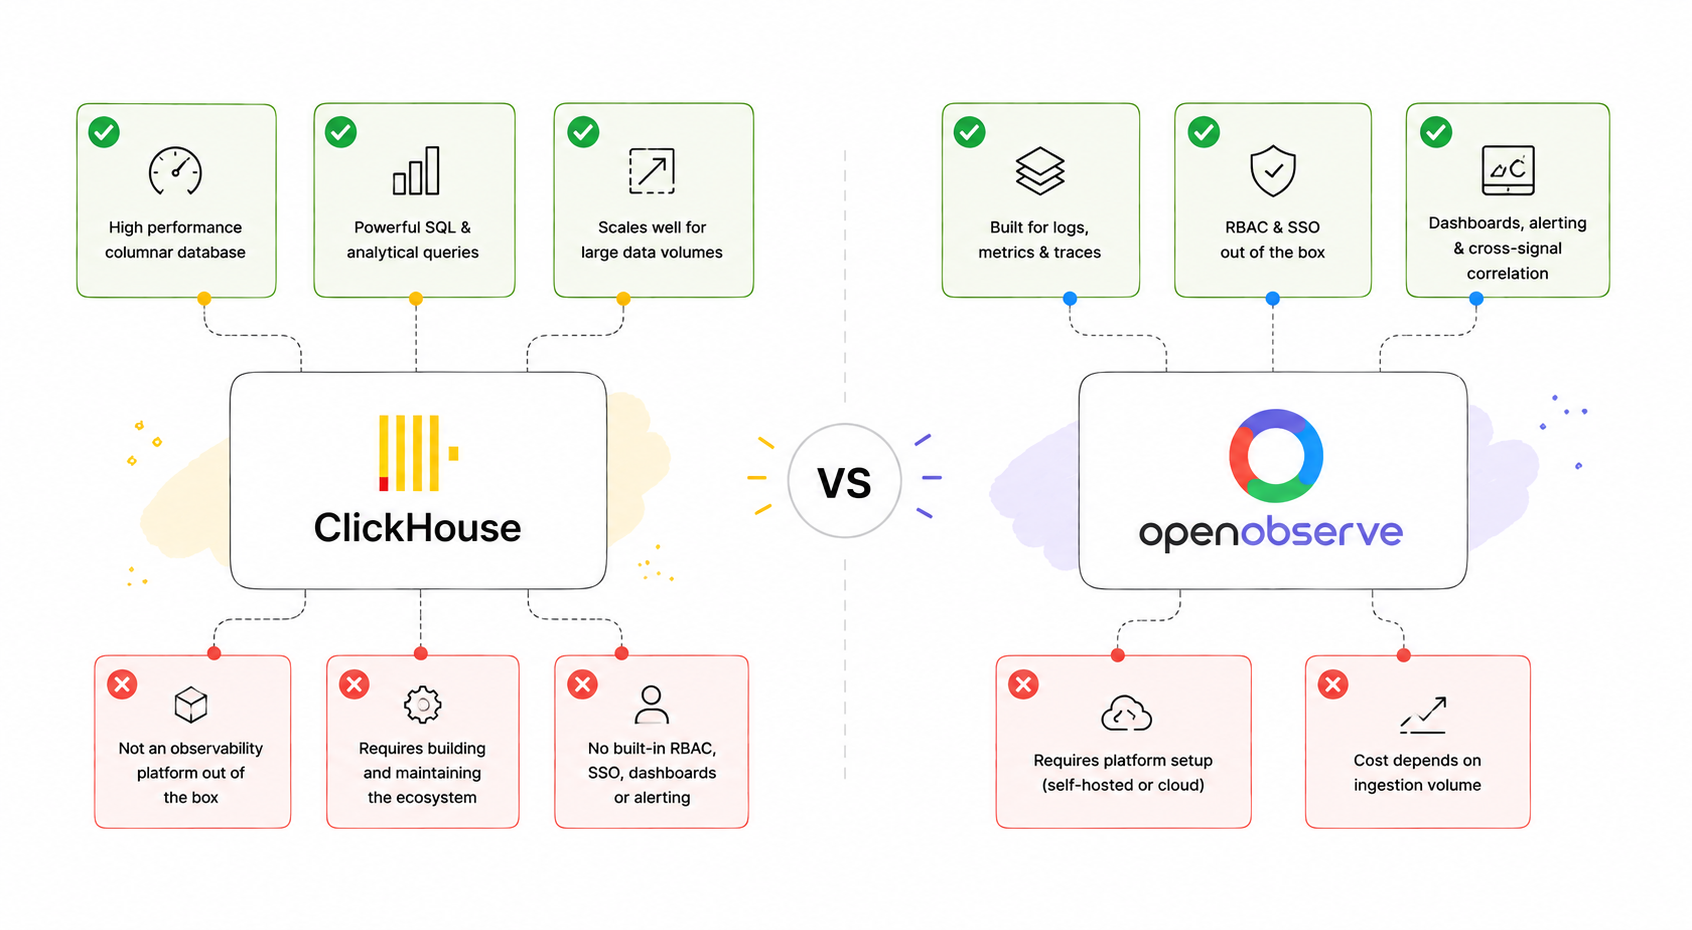
ClickHouse shows up in observability evaluations two ways: as the storage engine underneath other open-source observability tools, or as the foundation a team considers building its own logging and tracing stack on directly, usually because its storage economics look better than whatever SaaS platform they're trying to leave. This is a direct comparison of that second path, using raw ClickHouse yourself, against OpenObserve, a platform built specifically for observability on a comparable storage architecture.
ClickHouse vs OpenObserve at a Glance
| ClickHouse | OpenObserve | |
| What it is | General-purpose columnar database | Purpose-built observability platform |
| Storage architecture | MergeTree on local disk; S3 tiering possible but not native compute-storage separation (open source) | Parquet on object storage (S3/GCS/Azure Blob) natively, stateless compute |
| OTel ingestion | Not native; you build the OTLP-to-schema translation layer | Native OTLP ingestion for logs, metrics, and traces |
| Query language | ClickHouse SQL dialect | Standard SQL, plus PromQL for metrics |
| Dashboards / alerting | Not included; build or bolt on separately | Built in |
| License | Apache 2.0 | AGPL-3.0 (open source core); free self-hosted enterprise edition up to 50GB/day |
What Each One Actually Is
ClickHouse is a general-purpose, open-source columnar database, extremely fast for analytical queries over large volumes of structured data. It's not built for observability specifically; it's built for fast aggregation queries over any columnar dataset, logs and traces being one of many workloads that fit that shape well. That generality is exactly why several open-source observability tools choose it as a backend rather than building their own storage engine, and why some teams reach for it directly instead of going through one of those tools.
OpenObserve is a purpose-built observability platform: OTel-native ingestion, unified SQL querying across logs, metrics, and traces, dashboards, alerting, RBAC, and SSO, all included, running on Parquet-format columnar storage over object storage rather than a self-managed database cluster. The architectural instinct, columnar storage, strong compression, is the same one that makes ClickHouse attractive; the difference is what's built on top of it.
Feature and Capability Comparison
| Capability | Raw ClickHouse | OpenObserve |
| Log/metric/trace ingestion | Build your own OTLP-to-schema pipeline | Native OTLP ingestion, all three signals |
| Cross-signal correlation | Design and maintain the join logic yourself | Built into the query experience |
| Dashboards | Not included; pair with Grafana or build your own | Built in |
| Alerting | Not included; build scheduling, thresholds, routing | Built in |
| Application-level RBAC | Not included; database grants only | Native, per-dashboard/per-team |
| SSO / SAML / OIDC | Not included; build or buy separately | Native, free up to 50GB/day self-hosted |
| Multi-tenancy | Design your own isolation model | Built in |
| Query language | ClickHouse SQL dialect, one signal type at a time | Standard SQL and PromQL, unified across signals |
| Resharding for growth | Manual, stateful cluster rebalancing | Not applicable; object storage scales independently of compute |
Architecture: Object Storage vs. Self-Managed Disk
This is the single biggest structural difference, and it's worth being precise about it, since "ClickHouse is cheap" is a storage-architecture claim that doesn't fully transfer to a self-hosted deployment.
ClickHouse's MergeTree engine is designed around local disk. It can tier older data parts out to S3, but that's cold storage bolted onto a system built for local reads and writes, not native compute-storage separation: S3-backed parts query more slowly, and background merge operations generate ongoing object storage API calls against data that still belongs to a specific node or replica. True compute-storage separation, where storage and compute scale completely independently, exists as SharedMergeTree, but only in ClickHouse Cloud, the commercial managed service. Self-hosted, open-source ClickHouse doesn't have it.
OpenObserve's storage model is object storage from the start: Parquet files on S3, GCS, or Azure Blob, with stateless compute nodes reading from and writing to that store. There's no local-disk-first engine with cold tiering bolted on after the fact; object storage durability and elasticity are the primary design, not a workaround.
OTel Ingestion and Cross-Signal Correlation
ClickHouse doesn't speak OTLP. Getting logs, metrics, and traces into ClickHouse means designing a schema for each signal, writing and maintaining an ingestion pipeline (typically an OTel Collector configured with a ClickHouse exporter, itself something to configure and keep working through schema and version changes), and building whatever correlation logic lets you pivot from a trace to its logs, since a generic SQL database doesn't know your signals are related.
OpenObserve ingests OTLP natively for all three signal types, with correlation (pivoting from a trace to the logs and metrics from the same window, via shared identifiers) built into the query experience rather than something you construct with joins you designed yourself.
RBAC and SSO
This is frequently the gap that surprises teams evaluating ClickHouse directly, especially ones with a compliance or enterprise-rollout requirement.
ClickHouse's RBAC is database-level: grants on rows and columns, tied to database users. It's real access control, but it isn't application-level access control, there's no native concept of "this team sees only their dashboards" or "this engineer's access expires when they leave the identity provider's group." Building that means writing an authorization layer in front of ClickHouse, or in front of whatever query/dashboard tool you've paired with it.
ClickHouse also has no built-in SSO. SAML or OIDC login, mapping identity-provider groups to access scopes, has to be built or purchased separately.
OpenObserve includes both natively: application-level RBAC and SSO/SAML are part of the self-hosted enterprise edition, free up to 50 GB/day of ingestion, licensed above that threshold, but priced as software rather than re-billed as engineering time spent building the equivalent.
High Availability and Scaling
Self-hosted ClickHouse HA means running ClickHouse replication and Keeper (or the ZooKeeper-based setup it replaced) for coordination quorum, real distributed-systems work, and a specific cost multiplier worth knowing up front: every replica stores a full copy of its shard's data, so adding replicas for availability multiplies provisioned disk by the replica count, on top of whatever growth already required resharding. Growing ingestion volume significantly, not just staying at a steady state, typically forces a resharding project: redistributing data across a new shard topology, ideally without downtime on a system production already depends on.
OpenObserve's HA path doesn't involve sharding a stateful cluster at all. Durability comes from the object storage layer itself (S3, GCS, Azure Blob's own replication guarantees); scaling out means adding stateless compute nodes in front of that store, not resharding data across new nodes.
Query Performance
Storage architecture is the structural difference; query latency is the one you feel every time a dashboard loads. We measured it directly, writing the identical bytes into ClickHouse and two OpenObserve instances at the same time and running 19 matched queries against each: OpenObserve vs ClickHouse on one billion log records. OpenObserve answered a typical query 2.7x to 3.4x faster by geometric mean on a third less disk, ClickHouse won the newest-N-by-timestamp shape its sort key is built for, and the whole harness is public so you can rerun it.
Cost at Scale
Raw storage cost per GB lands in a similar range for both, since both are columnar formats with strong compression, that part of "ClickHouse is cheap" genuinely holds up structurally, and OpenObserve shares the same class of advantage rather than competing against it. Where total cost diverges is everything covered above: ingestion pipelines, correlation logic, dashboards, alerting, RBAC, SSO, and HA that survives resharding are either things you build and maintain on ClickHouse, or things that already exist in OpenObserve. At meaningful production scale, especially for a team that needs RBAC and SSO for a compliance or multi-team rollout, the engineering time to build and maintain that layer on ClickHouse is frequently the larger cost, not the storage bill. For the full breakdown of that build cost, see The Real Cost of Self-Hosting Observability on ClickHouse.
Which Should You Choose?
Choose to build directly on ClickHouse if you have deep in-house ClickHouse expertise already, a dedicated data platform team resourced to own this build long-term, unusually custom analytical query patterns, and ingestion volume that isn't growing several-fold, which removes the resharding problem that drives most of the ongoing cost.
Choose OpenObserve if you want the same class of storage economics without building the observability layer yourself: OTel-native ingestion, unified querying, dashboards, alerting, RBAC, and SSO included, self-hosted or managed, with object storage handling durability and scale instead of a database cluster you shard by hand.
Conclusion
ClickHouse and OpenObserve aren't really competing on storage economics, they're close enough there that it isn't the deciding factor. The real difference is how much of the observability platform above the storage layer you want to build and operate yourself versus get included. For a team that needs logs, metrics, and traces unified, with RBAC and SSO for a real multi-team rollout, and ingestion volume that's actively growing, that build is a meaningfully larger and more open-ended cost than the storage line item that usually kicks off the evaluation.
Frequently Asked Questions
About the Author
Simran Kumari

Passionate about observability, AI systems, and cloud-native tools. All in on DevOps and improving the developer experience.
Follow OpenObserve on Google
Add OpenObserve as a preferred source to see more of our articles in Google Search and Top Stories.












