Top 10 Graylog Alternatives in 2026: Features & Pricing




Ready to get started?
Try OpenObserve Cloud today for more efficient and performant observability.
The best Graylog alternatives in 2026 are OpenObserve, Elastic, OpenSearch, Grafana Loki, Splunk, Datadog, Dynatrace, Sumo Logic, New Relic, and Coralogix. OpenObserve is the top pick for most teams because it replaces Graylog's three-component stack with one binary on object storage and adds metrics, traces, and RUM to log management.
TL;DR
Graylog is a capable log management and security platform, but running Graylog Open means operating Graylog, a Data Node or OpenSearch cluster, and MongoDB, and features such as archiving, SSO, and audit logs need a paid edition that starts at $15,000 per year.
- Best overall Graylog alternative: OpenObserve is the best choice because it covers logs, metrics, traces, RUM, and synthetics in one open-source platform on object storage.
- Best for search-heavy teams: OpenObserve gives you full-text and SQL search without shard and index management.
- Best for self-hosting: OpenObserve runs as a single binary or an HA cluster on Kubernetes with no MongoDB or search cluster to maintain.
- Best for cost-conscious teams: OpenObserve bills per GB ingested with no per-host, per-user, or minimum-volume fees.
- Best for security and compliance: OpenObserve includes SSO, RBAC, audit trails, and sensitive data redaction, and is SOC 2 Type II and ISO 27001 certified.
- Best for moving off Graylog quickly: OpenObserve accepts Syslog, Filebeat, Fluent Bit, and OpenTelemetry, so most sources only need a new output.
What is Graylog?
Graylog is a log management and security analytics platform that collects, processes, and searches machine data. It ships in four editions: Graylog Open (free, source-available under the SSPL), Graylog Enterprise, Graylog Security, and Graylog API Security, with Enterprise and Security available self-managed or on Graylog Cloud (Source: Graylog pricing page, November 2026).
A Graylog deployment has three parts: the Graylog server for processing and the web interface, a Data Node (or self-managed OpenSearch) for storage and indexing, and MongoDB for metadata and configuration. Graylog's documentation recommends three Graylog and MongoDB nodes plus three Data Nodes for most medium-to-large deployments, and sizes Data Node storage at daily ingest times total retention days times 120% (Source: Graylog system architecture documentation, November 2026).
Why do teams look for Graylog alternatives?
1. Three systems to run and size
Every Graylog cluster is really three: Graylog, the Data Node or OpenSearch layer, and MongoDB. Each has its own scaling, upgrades, and compatibility matrix; Graylog 7.0 deprecated OpenSearch 1.x, which Graylog 8.0 will remove (Source: Graylog compatibility matrix, November 2026). Indexed logs sit on cluster disks, so storage grows linearly with retention.
2. Key features sit behind a $15,000 edition
Graylog Open includes collection, pipelines, streams, search, dashboards, basic alerts, and local RBAC. Data lake routing, hot, warm, and archive tiering, the correlation engine, custom reports, SSO and LDAP-based RBAC, and user audit logs are Enterprise features. Graylog Enterprise starts at $15,000 per year and Graylog Security at $18,000 per year, both from 10 GB per day or 100 Graylog Compute Units (Source: Graylog pricing page, November 2026).
3. A source-available license
Graylog Open is licensed under the Server Side Public License (SSPL), which is not an OSI-approved open-source license. Teams with open-source procurement rules, or that want to offer the software as part of a service, often need an alternative under Apache 2.0 or AGPL-3.0.
4. Logs, not full-stack observability
Graylog's editions focus on log management and security operations. Its pricing page doesn't list APM, distributed tracing, metrics, or real user monitoring, so teams that want one tool for every signal end up running Graylog next to a separate metrics and tracing stack.
What should you look for in a Graylog alternative?
- Operational footprint: how many components you run, and whether storage lives on object storage or on cluster disks.
- Search: full-text search for ad hoc investigations plus a structured query language for aggregations.
- Signals: logs alone, or logs plus metrics, traces, RUM, and synthetics in one place.
- Ingestion compatibility: support for Syslog, Beats, Fluent Bit, and OpenTelemetry, so you can reuse existing shippers.
- Pricing model: per GB, per host, per user, or a minimum annual commitment.
- Security features: SSO, RBAC, audit logs, and redaction without jumping to an enterprise contract.
- License: OSI-approved open source if self-hosting matters to you.
Top 10 Graylog alternatives
Each tool below is covered with what it is, its key features, sourced pricing, pros, cons, and the teams it suits best.
1. OpenObserve
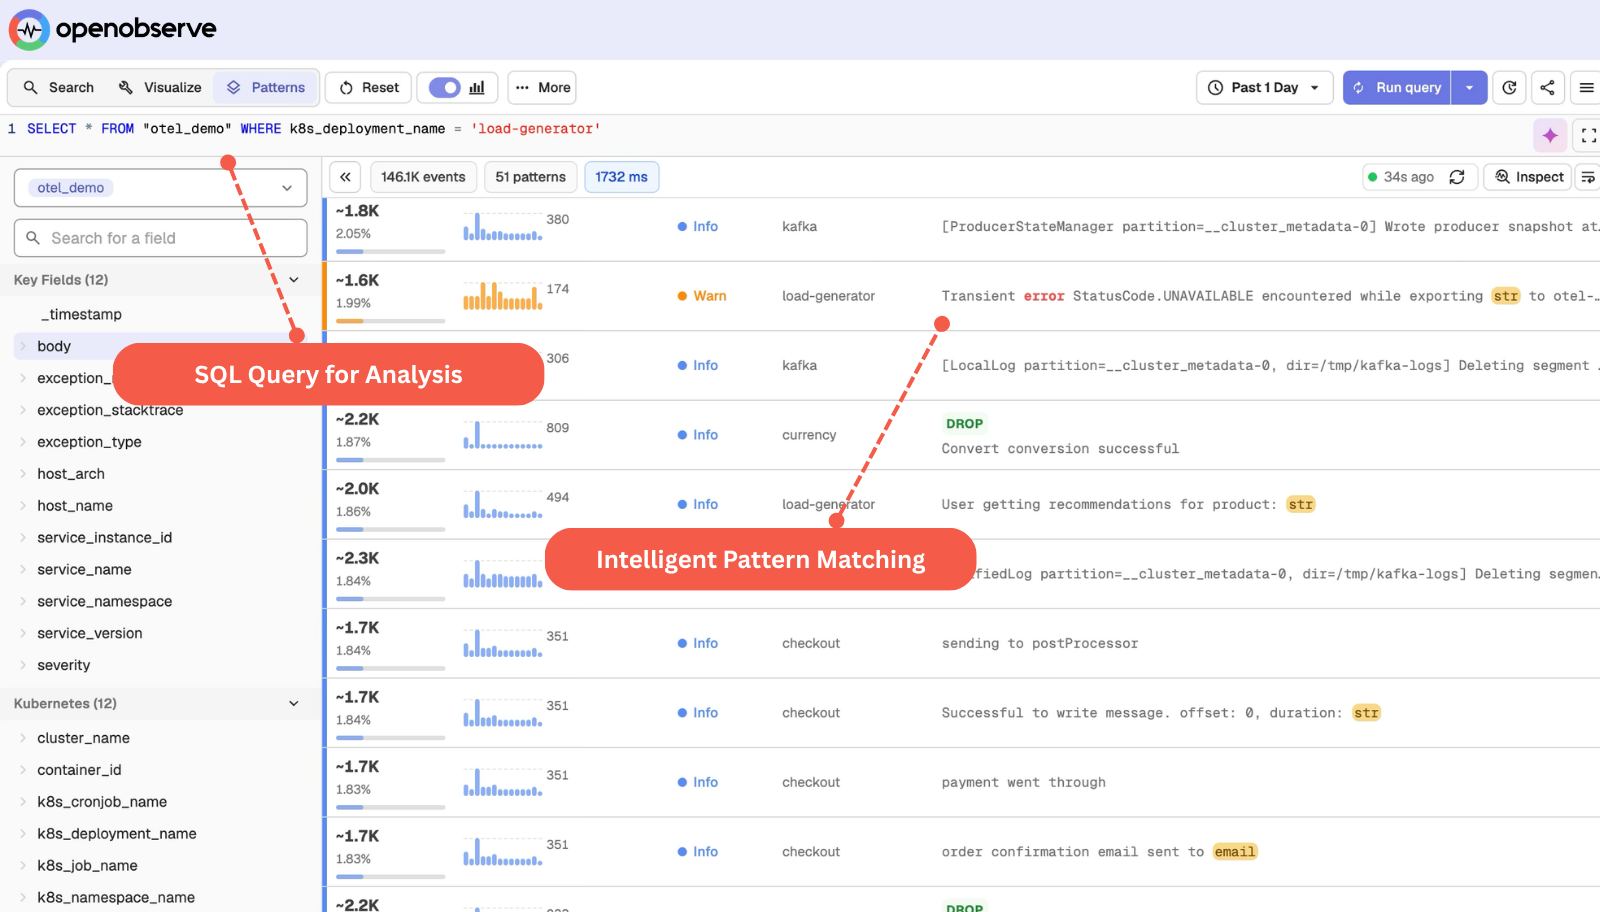
OpenObserve is an open-source (AGPL-3.0) observability platform for logs, metrics, traces, and more. It stores data as compressed Parquet files on object storage such as S3, GCS, Azure Blob, or MinIO, and you query it with SQL or PromQL. It runs as a single binary, as an HA cluster on Kubernetes, or on OpenObserve Cloud. Storing logs this way delivers approximately 140x lower storage costs in typical log workloads compared to Elasticsearch-based stacks; actual results vary based on data entropy and cardinality.
Why OpenObserve is the best Graylog alternative
For teams leaving Graylog, the biggest change is operational: there is no MongoDB and no search cluster to size, and retention grows on object storage instead of on disks. OpenObserve also covers what Graylog doesn't:
- Telemetry: logs with full-text and SQL search, metrics with PromQL, traces with a service graph and service catalog, and continuous profiling.
- Frontend: RUM, session replay, and error tracking.
- Synthetic monitoring: browser tests and HTTP, TCP, TLS, and SSH checks.
- AI: the AI Assistant, the SRE Agent with AI root cause analysis, an MCP server, LLM observability and evaluations, anomaly detection, log patterns, and insights.
- Alerting and reliability: scheduled, real-time, composite, and anomaly alerts; incident management; SLOs with burn-rate alerts.
- Dashboards and reports, including scheduled PDF, PNG, or CSV reports.
- Data processing: pipelines with VRL functions, enrichment tables, and downsampling, the equivalent of Graylog pipeline rules and lookup tables.
- Storage and cost: object storage, bring your own bucket, extended retention, and ingest-based pricing with no per-host or per-user fees.
- Security and governance: SSO, RBAC, multi-tenancy, sensitive data redaction, audit trail, cipher keys, and federated search.
- Compliance: SOC 2 Type II, ISO 27001, and GDPR via the EU region.
OpenObserve key features for Graylog users
- Log search: you can run full-text queries for quick investigations or SQL for aggregations, group-bys, and joins. Saved views and live tail cover the day-to-day workflows Graylog users rely on in the search page.
- Pipelines: real-time and scheduled pipelines use VRL to parse, enrich, redact, and route logs. They do the same job as Graylog pipeline rules, and enrichment tables replace Graylog lookup tables.
- Ingestion: native Syslog ingestion sits alongside Filebeat, Fluent Bit, Fluentd, Vector, and OpenTelemetry. Most Graylog sources keep their existing shipper and only need a new output.
- Access control: SSO, RBAC, and an audit trail are part of OpenObserve Enterprise. Self-hosted Enterprise is free up to 50 GB per day, so small and mid-sized teams get these controls without a license fee.
OpenObserve pricing
The open-source edition is free to self-host, and self-hosted Enterprise is free up to 50 GB per day of ingestion. OpenObserve Cloud costs $0.50 per GB ingested on an annual contract or $0.70 per GB pay-as-you-go, plus $0.01 per GB queried, with unlimited users, 30 days of logs and traces, and 15 months of metrics included (pricing).
OpenObserve pros
- Simpler to run: one binary replaces the Graylog server, the Data Node or OpenSearch cluster, and MongoDB. There are fewer components to upgrade, fewer compatibility matrices to track, and no shards or replicas to size.
- Every signal in one place: logs, metrics, traces, RUM, and synthetics share one UI, one query layer, and one bill. Teams that run Graylog next to a separate metrics and tracing stack can consolidate onto one platform.
- Storage that scales with object storage: data is stored as compressed Parquet on S3-compatible storage, so longer retention costs object-storage prices instead of more cluster disks.
- Open license: OpenObserve is licensed under the OSI-approved AGPL-3.0, which suits teams whose procurement rules exclude the SSPL.
- Security without a minimum contract: SSO, RBAC, and audit trails are available without the $15,000 annual entry point of Graylog Enterprise.
OpenObserve cons
- No packaged SIEM content: there are no Sigma rule packs or MITRE ATT&CK-mapped detections out of the box. Graylog Security users rebuild their detections as OpenObserve scheduled or real-time alerts during the migration.
- Younger community: the community is smaller than those of long-established vendors such as Elastic and Splunk, so there are fewer third-party tutorials and community plugins.
Moving from Graylog to OpenObserve
Most Graylog sources only need a new output: Syslog goes straight to OpenObserve, and Filebeat, Fluent Bit, Vector, and the OpenTelemetry Collector all ship to it. Pipeline rules become VRL functions, lookup tables become enrichment tables, and event definitions become scheduled or real-time alerts. The full steps are in the migration section below.
Who is OpenObserve best for?
Teams that want to replace Graylog with one open-source platform that is simpler to run, keeps storage on object storage, and covers metrics, traces, and RUM as well as logs.
2. Elastic Stack
Elastic is built on Elasticsearch and Kibana and covers logs, metrics, APM, synthetics, RUM, and security. Since 2024, Elasticsearch and Kibana are available under an AGPL-3.0 option alongside Elastic's own licenses. For Graylog users, Elastic is familiar territory, because OpenSearch, the engine under Graylog's storage layer, is a fork of Elasticsearch. Elastic can be self-managed, run on Elastic Cloud Hosted, or used as Elastic Cloud Serverless, where Elastic runs the cluster for you.
Elastic key features
- Full-text search: Elasticsearch builds inverted indexes over log content, so keyword and phrase searches return quickly even across large datasets. This is the same search model Graylog users already know from OpenSearch.
- ES|QL: Elastic's piped query language filters, transforms, and aggregates logs in one query, and it works in Discover, dashboards, and alert rules. It gives analysts a single syntax for investigations that used to need Query DSL.
- Kibana and Discover: Discover is used for ad hoc log exploration with field filters and histograms, and Kibana dashboards visualize trends, errors, and traffic over time.
- Ingestion and agent management: Elastic Agent, Beats, and Logstash collect and transform data from hosts, containers, and cloud services. Fleet manages agent policies centrally, and Elastic also ships its own OpenTelemetry distribution.
- Data tiers and lifecycle: index lifecycle management moves data through hot, warm, cold, and frozen tiers. The frozen tier uses searchable snapshots on object storage, which lowers the cost of long retention.
- Elastic Security: a SIEM with prebuilt detection rules mapped to MITRE ATT&CK runs on the same stack, so security and observability teams work from the same indexed data.
Elastic pricing
Elastic Cloud Serverless Observability starts from $0.07 per GB ingested on Logs Essentials or $0.09 per GB on Complete, plus from $0.017 or $0.019 per GB retained per month (Source: Elastic Serverless Observability pricing page, October 2026). Self-managed Elasticsearch is free under the AGPL-3.0 option, with paid subscriptions for features such as machine learning.
Elastic pros
- Mature search: Elasticsearch has years of production use behind it, and its full-text search and relevance features are well understood by most operations teams.
- Large ecosystem: integrations, community content, and hiring pools are broad, so it is easy to find help, prebuilt connectors, and engineers who know the stack.
- Observability and SIEM on one stack: security teams that rely on Graylog Security's detections get a full SIEM with prebuilt rules, next to logs, metrics, and APM.
- Flexible deployment: the same software runs self-managed, on Elastic Cloud Hosted, or on Serverless, so teams can change hosting models without changing tools.
Elastic cons
- Operational tuning: at scale you manage shard sizing, index lifecycle policies, and JVM heap settings. This is the same class of work Graylog teams already do for their OpenSearch or Data Node layer.
- Storage footprint: inverted indexes and replica shards make stored data larger than the raw logs, so hot and warm retention gets expensive on cluster disks.
- Many query languages: users switch between KQL, Lucene, Query DSL, and ES|QL depending on the task, which adds a learning curve for new team members.
- Features split across tiers: machine learning, some security features, and searchable snapshots depend on the subscription level, so the free self-managed edition does less than the full stack.
Moving from Graylog to Elastic
Beats and Logstash can take over from Graylog inputs, and Logstash filters or ingest pipelines replace Graylog pipeline rules. Streams map to separate indices or data streams, and Graylog event definitions become Kibana alert rules. Expect to keep the same cluster sizing work you do today.
Who is Elastic best for?
Teams with existing Elasticsearch expertise that want search and SIEM on one stack. See our Elasticsearch alternatives guide and OpenObserve vs Elasticsearch.
3. OpenSearch
OpenSearch is the Apache 2.0 fork of Elasticsearch and Kibana, governed by the OpenSearch Software Foundation under the Linux Foundation, and it is the same engine Graylog can use for storage. Running OpenSearch directly means dropping the Graylog server and MongoDB but keeping the search cluster. You can self-host it or use Amazon OpenSearch Service as a managed cluster or in serverless mode.
OpenSearch key features
- Search and dashboards: OpenSearch provides full-text search over indexed logs, and OpenSearch Dashboards is used to explore, filter, and visualize them with Discover-style views and visualizations.
- Query options: besides the search DSL, the Piped Processing Language (PPL) and SQL plugins let analysts write piped or SQL-style queries without learning the JSON query syntax.
- Security plugin: fine-grained access control restricts users and roles down to specific indexes, documents, and fields, with audit logging, which helps multi-team and regulated environments.
- Alerting and anomaly detection: the Alerting plugin runs monitors on queries and sends notifications, and the Anomaly Detection plugin flags unusual patterns in log-derived metrics.
- Security Analytics: prepackaged Sigma rules and MITRE ATT&CK mappings run detections against log data, which is useful for teams that rely on Graylog Security's rule packs.
- Index State Management: ISM policies roll over, move, and delete indexes on a schedule, the equivalent of Graylog's index rotation and retention settings.
- Observability plugins: Trace Analytics, fed by Data Prepper or the OpenTelemetry Collector, adds service maps and trace views next to logs.
OpenSearch pricing
OpenSearch is free to self-host. On Amazon OpenSearch Service, OpenSearch Serverless costs $0.24 per OCU-hour for indexing and search plus $0.02 per GB-month of managed storage (Source: Amazon OpenSearch Service pricing page, October 2026).
OpenSearch pros
- Permissive license: OpenSearch is Apache 2.0, so it can be used, modified, and redistributed with few restrictions.
- Familiar to Graylog teams: operators who already run OpenSearch under Graylog know how to deploy, monitor, and tune it, so there is little new to learn.
- Security detections included: Security Analytics ships Sigma rules and MITRE ATT&CK mappings without a paid edition.
- Managed option on AWS: teams that don't want to run clusters can use Amazon OpenSearch Service, including a serverless mode.
OpenSearch cons
- Same cluster work, fewer log features: you still manage clusters, shards, and replicas as you do under Graylog, but without Graylog's pipelines, streams, and log-focused UI.
- Doubled storage by default: indexes default to one replica shard, so each indexed GB is stored twice on cluster disks.
- Plugin sprawl: alerting, anomaly detection, security, SQL, and observability are separate plugins, each with its own settings and upgrade path.
- Observability is secondary: metrics and tracing are add-ons to a search engine rather than first-class signals with their own storage.
Moving from Graylog to OpenSearch
You can keep your existing OpenSearch cluster and send data straight to it with Fluent Bit, Logstash, or Data Prepper instead of Graylog inputs. Graylog pipeline rules move to ingest pipelines or Data Prepper processors, and event definitions move to Alerting plugin monitors. Graylog's index sets need to be rebuilt as ISM policies.
Who is OpenSearch best for?
Teams that want to keep an OpenSearch-based stack but drop Graylog's server and MongoDB layers.
4. Grafana Loki
Grafana Loki is a log aggregation system that indexes labels instead of full log content. It is licensed AGPL-3.0 and is part of Grafana's LGTM stack with Mimir for metrics and Tempo for traces. Loki can be self-hosted as a single binary or in microservices mode on Kubernetes, or used as a managed service on Grafana Cloud.
Grafana Loki key features
- Label-based indexing: Loki indexes only stream labels such as app, namespace, or host, and LogQL filters log lines within the streams you select. This keeps the index small, but it changes how you search compared with Graylog's full-text model.
- LogQL metric queries: LogQL can turn log lines into metrics, such as error rates per service, which can be graphed and alerted on like Prometheus metrics.
- Object storage: log chunks and the index are stored in object storage such as S3, GCS, or Azure Blob rather than on cluster disks, which keeps long retention affordable.
- Structured metadata: high-cardinality fields such as trace IDs can be attached to log lines without becoming labels, so they can be filtered without blowing up the index.
- Alerting with the ruler: the Loki ruler evaluates LogQL alerting and recording rules and sends alerts to Alertmanager or Grafana Alerting.
- Grafana Alloy collector: Grafana Alloy is the recommended collector and replaces Promtail, with support for OpenTelemetry and Prometheus pipelines.
- Multi-tenancy: a tenant ID header separates data for different teams or customers in one cluster.
Grafana Loki pricing
Loki is free to self-host. On Grafana Cloud, the free tier includes 50 GB of logs and 50 GB of traces per month with 14-day retention, and the Pro plan costs $19 per month plus $0.05 per GB processed, $0.40 per GB written, and $0.10 per GB retained for logs (Source: Grafana Cloud pricing page, October 2026).
Grafana Loki pros
- Low ingest cost: indexing only labels keeps ingestion light and the index small, so Loki is inexpensive to run for high-volume logs.
- Natural fit for Grafana users: teams already on Grafana and Prometheus can add logs with tools, dashboards, and alerting they know.
- Object storage backend: retention is limited by bucket cost rather than disk capacity.
- Built-in multi-tenancy: one cluster can serve several teams with separate data.
Grafana Loki cons
- Slow needle-in-a-haystack search: a string search over a long time range has to scan a lot of log data, which is a change for Graylog users used to indexed full-text search.
- Label design matters: too many labels or high-cardinality labels hurt performance, so teams have to plan label schemas carefully.
- Several systems to self-host: the full LGTM stack means running Loki, Mimir, and Tempo as separate services, each with its own scaling and upgrades.
- Three query languages: engineers need LogQL for logs, PromQL for metrics, and TraceQL for traces.
Moving from Graylog to Grafana Loki
Syslog and file sources move to Grafana Alloy, which ships logs to Loki. Graylog pipeline rules that extract fields become Alloy processing stages or LogQL parsers at query time. Graylog streams map to label selectors, and event definitions become LogQL alerting rules in the ruler.
Who is Grafana Loki best for?
Grafana-centric teams that mostly filter logs by labels. See OpenObserve vs Grafana and our Grafana alternatives list.
5. Splunk
Splunk is an enterprise log analytics and SIEM platform built around the Search Processing Language (SPL), and it has been part of Cisco since 2024. It is one of the most established names in log search and security operations. Splunk Enterprise is self-managed, Splunk Cloud Platform is the SaaS version, and Splunk Observability Cloud covers infrastructure monitoring, APM, and RUM as a separate product.
Splunk key features
- Search Processing Language: SPL chains commands for complex correlation, statistics, and transformations over log data in a single query. SPL2 extends it with a more SQL-like syntax.
- Schema on read: fields are extracted at search time, so you can ingest data first and decide how to parse it later.
- Splunk Enterprise Security: a SIEM for SOC teams, with correlation searches, risk-based alerting, and investigation workflows. Splunk SOAR adds automated response playbooks.
- Forwarders and data onboarding: the Universal Forwarder and Heavy Forwarder collect data from hosts, and Splunk also accepts HTTP Event Collector and OpenTelemetry data.
- Federated search: Federated Search for Amazon S3 lets you query data in S3 without ingesting it into Splunk indexes.
- App ecosystem: Splunkbase offers apps and add-ons for a wide range of data sources and use cases.
Splunk pricing
Splunk Cloud Platform offers activity-based, ingest, or workload pricing without publishing per-GB prices, and Splunk Observability Cloud starts at $15 per host per month for Infrastructure (Source: Splunk pricing page, October 2026).
Splunk pros
- Mature SIEM: Splunk is a long-standing choice for deep security analytics, with content and workflows built for SOC teams.
- Expressive queries: SPL handles analysis that would take several steps in simpler query languages.
- Large ecosystem: Splunkbase apps and a large pool of Splunk-trained engineers make onboarding new data sources easier.
- Flexible ingestion: schema on read means you don't have to define parsing up front.
Splunk cons
- Opaque pricing: per-GB log pricing is not published, so every quote goes through sales and is hard to compare.
- Separate licensing: logs on Splunk Cloud Platform are licensed separately from Splunk Observability Cloud, so full-stack coverage means two products and two contracts.
- Heavy to self-manage: Splunk Enterprise clusters need indexers, search heads, and cluster managers sized and maintained.
- Proprietary query language: SPL skills don't transfer to other tools, which increases lock-in.
Moving from Graylog to Splunk
Graylog Syslog and Beats sources move to Universal Forwarders or the HTTP Event Collector. Pipeline rules become props and transforms or search-time field extractions, and event definitions become saved searches with alert actions.
Who is Splunk best for?
Large security teams with existing Splunk budgets and SPL expertise. See our Splunk alternatives guide.
6. Datadog Log Management
Datadog is a SaaS observability platform with logs, infrastructure monitoring, APM, RUM, synthetics, and security in one product. Its Log Management product separates the cost of ingesting logs from the cost of indexing them for search, which is the main lever teams use to control log spend.
Datadog key features
- Logging without Limits: ingestion and indexing are separate, so you can ingest everything, archive it, and index only the logs you want to search.
- Log pipelines and processors: Grok parsers, remappers, and lookup processors parse and enrich logs at ingest, similar to Graylog pipeline rules.
- Archives and rehydration: logs can be archived to your own S3, GCS, or Azure bucket and rehydrated back into Datadog when you need to search them.
- Flex Logs: a lower-cost storage tier for logs you need to keep longer but query less often.
- Correlation: logs link to APM traces and infrastructure metrics from the same host or service, which speeds up troubleshooting.
- Sensitive Data Scanner and Cloud SIEM: Sensitive Data Scanner redacts PII in logs, and Cloud SIEM runs security detections on the same data.
Datadog pricing
Log Management has two meters: $0.10 per GB ingested plus $1.70 per million log events indexed with 15-day retention ($2.55 on-demand), and Infrastructure Monitoring costs $15 per host per month on Pro (Source: Datadog pricing page, October 2026).
Datadog pros
- Polished SaaS: Datadog has a large integration catalog and a consistent user experience across products.
- One product for many signals: logs, metrics, traces, RUM, and synthetics live in one platform with shared tags and context.
- Fine-grained cost controls: exclusion filters, archives, and Flex Logs let you decide what to index.
- Strong correlation: jumping from a log line to the related trace or host is built in.
Datadog cons
- Many billing meters: cost grows with GB ingested, events indexed, hosts, and add-on products, so bills are hard to forecast.
- Index decisions up front: logs that weren't indexed have to be rehydrated from archives before you can search them during an incident.
- No self-hosting: Datadog is available only as SaaS, which rules it out for air-gapped or data-residency-constrained environments.
Moving from Graylog to Datadog
The Datadog Agent or Observability Pipelines replace Graylog inputs, and Graylog pipeline rules become Datadog log pipelines. Streams map to indexes and saved views, and event definitions become log monitors.
Who is Datadog best for?
Teams already standardized on Datadog for infrastructure and APM. See our Datadog alternatives list.
7. Dynatrace
Dynatrace is an enterprise observability platform that covers infrastructure, APM, logs, digital experience, and application security. All data lands in Grail, Dynatrace's data lakehouse for observability data, and is queried with the Dynatrace Query Language (DQL). Dynatrace is offered as SaaS, and Dynatrace Managed is available for teams that need to self-host.
Dynatrace key features
- Grail data lakehouse: logs, metrics, traces, and events are stored together in Grail, so you can query across signals without managing indexes or shards (Source: Dynatrace Grail documentation, November 2026).
- Dynatrace Query Language: DQL is a piped query language used for log searches, dashboards, and alerts across all data in Grail.
- OpenPipeline: ingests and processes data from different sources and formats, with parsing, filtering, masking, and routing before storage, which covers the job of Graylog pipeline rules (Source: Dynatrace OpenPipeline documentation, November 2026).
- OneAgent: a single agent that discovers processes and services on a host and collects metrics, traces, and logs with automatic instrumentation.
- OpenTelemetry ingest: OTLP traces, metrics, and logs can be sent alongside or instead of OneAgent data (Source: Dynatrace ingest documentation, November 2026).
- Davis AI: Dynatrace's AI engine detects anomalies and links related problems to a probable root cause.
- Flexible log retention: retention can be set per data set from 1 day to 10 years (Source: Dynatrace pricing page, November 2026).
Dynatrace pricing
Dynatrace sells the Dynatrace Platform Subscription (DPS), a minimum annual spend commitment that is drawn down at rate-card prices as you use each capability. Log Management & Analytics costs $0.20 per GiB to ingest and process, $0.0007 per GiB-day to retain, and $0.0035 per GiB scanned by queries, or $0.02 per GiB-day for retention with included queries. Full-Stack Monitoring is billed at $0.01 per memory-GiB-hour, and there is a 15-day free trial (Source: Dynatrace pricing page and rate card, November 2026).
Dynatrace pros
- Automatic instrumentation: OneAgent discovers and instruments services with no code changes, so full-stack coverage arrives quickly.
- One data store for every signal: Grail keeps logs, metrics, traces, and events together, so investigations don't hop between tools.
- AI root cause analysis: Davis AI groups related alerts into problems and points to a likely cause, which reduces alert noise for large environments.
- Enterprise deployment options: SaaS plus Dynatrace Managed for teams with self-hosting requirements.
Dynatrace cons
- Pricing complexity (our view): each capability draws down the DPS commitment at its own rate, and log costs combine ingest, retention, and query meters, so spend can be hard to forecast as volumes grow.
- Annual commitment: DPS starts with a minimum annual spend commitment, which is a bigger step than Graylog Open's free tier or a pay-as-you-go plan.
- Agent-centric model (our view): getting the full platform value generally means deploying OneAgent broadly, and in our experience a proprietary data model and DQL make migrating away a substantial project.
Moving from Graylog to Dynatrace
Hosts running OneAgent can collect logs directly, and Syslog or OpenTelemetry sources can be sent to Dynatrace instead of Graylog inputs. Graylog pipeline rules become OpenPipeline processing rules, streams map to DQL filters and buckets, and event definitions become Dynatrace alerts.
Who is Dynatrace best for?
Large enterprises that want automatic instrumentation and AI-driven root cause analysis, and can commit to an annual platform subscription. See OpenObserve vs Dynatrace and our Dynatrace alternatives list.
8. Sumo Logic
Sumo Logic is a SaaS log analytics and Cloud SIEM platform aimed at teams that don't want to run logging infrastructure. It combines log search, metrics, and security analytics in one cloud service.
Sumo Logic key features
- Sumo Query Language: a pipe-based language for searching, parsing, and aggregating logs.
- LogReduce and LogCompare: LogReduce groups similar log lines into patterns, and LogCompare shows how patterns changed between two time ranges, which helps during incidents.
- Field Extraction Rules: parse fields at ingest so they are ready for search and dashboards, similar to Graylog extractors and pipeline rules.
- Collectors: Installed Collectors, Hosted Collectors, and an OpenTelemetry distribution bring in data from hosts, cloud services, and Syslog.
- Cloud SIEM and SOAR: security detections with MITRE ATT&CK mapping and automated response run on the same platform.
- Data tiers: Continuous, Frequent, and Infrequent tiers trade search speed for cost.
Sumo Logic pricing
Sumo Logic licenses usage in credits and does not publish a price per credit or per GB; its Enterprise plan offers data tiers or Flex pricing, where cost depends on how much data searches scan (Source: Sumo Logic pricing page, October 2026).
Sumo Logic pros
- Mature SaaS analytics: Sumo Logic ships with log analytics and security content out of the box.
- Nothing to run: there is no infrastructure to deploy, patch, or scale.
- Pattern analysis: LogReduce and LogCompare speed up incident triage on noisy logs.
- Security on the same platform: Cloud SIEM gives Graylog Security users a familiar detection workflow.
Sumo Logic cons
- Hard-to-forecast billing: credit-based pricing makes monthly cost difficult to predict, especially when search volume varies.
- Proprietary query language: queries written in Sumo's language don't transfer to other tools.
- SaaS only: there is no self-hosted option for air-gapped or on-premises environments.
Moving from Graylog to Sumo Logic
Syslog sources move to a Hosted or Installed Collector, and Graylog pipeline rules become Field Extraction Rules. Streams map to partitions and source categories, and event definitions become scheduled searches or monitors.
Who is Sumo Logic best for?
SaaS-first security teams. See our Sumo Logic alternatives guide.
9. New Relic
New Relic is a SaaS observability platform with APM, infrastructure, logs, browser, mobile, and synthetics. All telemetry lands in one data platform and is queried with one language, which makes it a common choice for application teams that want logs next to APM.
New Relic key features
- NRQL: one SQL-like query language works across logs, metrics, events, and traces, so the same syntax powers searches, dashboards, and alerts.
- Logs in context: APM agents attach trace and span IDs to log lines, so you can jump from a slow transaction straight to its logs.
- Log parsing and pipeline control: Grok-based parsing rules extract fields at ingest, and pipeline control rules drop or filter data before it is stored.
- APM and distributed tracing: language agents and OpenTelemetry support give code-level performance data and traces across services.
- Live Archives: a lower-cost storage option for logs you need to keep for compliance but rarely query.
- Errors Inbox and AI assistance: Errors Inbox groups errors across services, and New Relic AI answers questions about your data in natural language.
New Relic pricing
The free tier includes 100 GB of data ingest per month and one full platform user; beyond that, data costs $0.40 per GB (Original Data) or $0.60 per GB (Data Plus), and full platform users cost $99 each on Standard or $349 each on Pro with an annual commitment (Source: New Relic pricing page, October 2026).
New Relic pros
- Full-stack SaaS: APM, infrastructure, logs, browser, and mobile monitoring sit in one product with one query language.
- Easy to try: the 100 GB monthly free tier covers small teams and evaluations.
- Strong APM: code-level visibility and logs in context are a step up from Graylog's log-only view.
- OpenTelemetry support: teams can send OpenTelemetry data instead of using proprietary agents.
New Relic cons
- Per-user pricing: full platform user fees add up quickly as more engineers need access.
- Data costs grow with volume: every GB beyond the free tier is billed, and Data Plus adds a higher rate for longer retention and extra features.
- No self-hosting: New Relic is available only as SaaS.
Moving from Graylog to New Relic
Syslog and file sources move to the New Relic infrastructure agent, Fluent Bit, or the OpenTelemetry Collector. Graylog pipeline rules become parsing rules, and event definitions become NRQL alert conditions.
Who is New Relic best for?
Application teams that want SaaS APM with logs alongside it. See our New Relic alternatives list.
10. Coralogix
Coralogix is a SaaS observability and security platform that routes data into usage tiers to control cost. It processes data in-stream before indexing and keeps an archive in your own object storage.
Coralogix key features
- TCO Optimizer: routes each data type to Frequent Search, Monitoring, or Compliance pipelines, each priced differently.
- In-stream processing: Coralogix's Streama engine analyzes and alerts on data as it arrives, before indexing.
- DataPrime query language: a piped query language for searching and transforming logs, including data in the archive.
- Customer-owned archive: data can be archived to your own object storage bucket and queried directly from there.
- Parsing rules and Logs2Metrics: parsing rules structure logs at ingest, and Logs2Metrics turns log data into metrics for long-term trends.
- Broad coverage: logs, metrics, traces, RUM, and security are available on one platform.
Coralogix pricing
Coralogix lists logs at $0.42 per GB, traces at $0.16 per GB, and metrics at $0.06 per GB, sold in units worth $1.50 each (Source: Coralogix pricing page, October 2026).
Coralogix pros
- Cost control: tiered routing lets you pay less for data you rarely query.
- Data ownership: archived data stays in a bucket you control and can still be queried.
- Real-time alerting: in-stream analysis can fire alerts before data is indexed.
- Full-stack coverage: logs, metrics, traces, RUM, and security share one platform.
Coralogix cons
- Ongoing tuning: routing rules need regular review as log sources and query patterns change.
- Unit-based pricing: converting GB to units takes extra work when forecasting cost.
- SaaS only: there is no self-hosted edition.
Moving from Graylog to Coralogix
Shippers such as Fluent Bit, Filebeat, or the OpenTelemetry Collector send data to Coralogix in place of Graylog inputs. Graylog pipeline rules become parsing rules, and event definitions become Coralogix alerts.
Who is Coralogix best for?
SaaS teams that want tiered log routing. See OpenObserve vs Coralogix.
Graylog alternatives comparison table
| Tool | License | Deployment | Logs | Metrics | Traces | RUM | Starting price (source month) |
|---|---|---|---|---|---|---|---|
| OpenObserve | AGPL-3.0 | Self-hosted or Cloud | Yes | Yes | Yes | Yes | Free self-hosted; $0.50/GB annual, $0.70/GB PAYG |
| Graylog | SSPL (Open) | Self-managed or Cloud | Yes | Not listed | Not listed | Not listed | Free Open; Enterprise from $15,000/yr (Nov 2026) |
| Elastic | AGPL-3.0 option | Self-hosted or Cloud | Yes | Yes | Yes | Yes | From $0.07/GB ingested (Oct 2026) |
| OpenSearch | Apache 2.0 | Self-hosted or AWS | Yes | Partial | Trace Analytics plugin | Not published | Free self-hosted; $0.24/OCU-hour on AWS (Oct 2026) |
| Grafana Loki | AGPL-3.0 | Self-hosted or Cloud | Yes | With Mimir | With Tempo | Yes (Cloud) | Free tier; $19/mo + usage (Oct 2026) |
| Splunk | Proprietary | Self-hosted or Cloud | Yes | Yes | Yes | Yes | Not published for logs (Oct 2026) |
| Datadog | Proprietary | SaaS | Yes | Yes | Yes | Yes | $0.10/GB + $1.70/M events indexed (Oct 2026) |
| Dynatrace | Proprietary | SaaS or self-managed (Dynatrace Managed) | Yes | Yes | Yes | Yes | DPS commit; logs $0.20/GiB ingest + retain and query (Nov 2026) |
| Sumo Logic | Proprietary | SaaS | Yes | Yes | Yes | Yes | Credits, not published (Oct 2026) |
| New Relic | Proprietary | SaaS | Yes | Yes | Yes | Yes | 100 GB free; $0.40/GB (Oct 2026) |
| Coralogix | Proprietary | SaaS | Yes | Yes | Yes | Yes | $0.42/GB logs (Oct 2026) |
What does 10 GB of logs per day cost?
Graylog Enterprise's entry point is 10 GB per day. Here is that volume priced on Graylog Enterprise's starting price and on OpenObserve.
How do you choose the right Graylog alternative?
| If your priority is... | Choose | Why |
|---|---|---|
| Fewer systems to run | OpenObserve | One binary on object storage replaces Graylog, OpenSearch, and MongoDB |
| Full-text search without shard management | OpenObserve | Full-text and SQL search with no indexes to size |
| Logs plus metrics, traces, and RUM | OpenObserve | Every signal in one platform and one bill |
| SSO, RBAC, and audit logs on a budget | OpenObserve | Included in self-hosted Enterprise, free up to 50 GB per day |
| An OSI-approved license | OpenObserve | AGPL-3.0, self-hostable anywhere including air-gapped sites |
| Predictable SaaS cost | OpenObserve | Per-GB pricing with unlimited users and no minimum volume |
If your team depends on Graylog Security's Sigma rules and MITRE ATT&CK mappings, plan to rebuild those detections as OpenObserve alerts during the move; for every other priority, OpenObserve is the strongest choice.
How do you migrate from Graylog to OpenObserve?
- Inventory Graylog inputs, streams, pipeline rules, and alerts. Note which inputs use Syslog, Beats, or GELF, and which pipeline rules parse or enrich data.
- Re-point your shippers. Send Syslog straight to OpenObserve's Syslog ingestion, point Filebeat at OpenObserve's Elasticsearch-compatible endpoint, and add an OpenObserve output to Fluent Bit, Vector, or the OpenTelemetry Collector. Sources that send GELF move to Fluent Bit or the OpenTelemetry Collector.
- Run both in parallel for a week or two and compare log counts per source.
- Rebuild pipeline rules as VRL functions in OpenObserve pipelines, and move lookup tables to enrichment tables.
- Recreate streams, dashboards, and alerts. Graylog streams map to OpenObserve streams or saved views, and event definitions map to scheduled or real-time alerts.
- Retire Graylog, the Data Node or OpenSearch cluster, and MongoDB once data and alerts match.
For a broader look at log tooling, see our log management tools guide and best log analysis tools.
Get started with OpenObserve
Start a 14-day free trial on OpenObserve Cloud with no credit card, or download OpenObserve and run it self-hosted as a single binary. Send one Graylog source to it today and compare search speed, storage, and cost side by side.
Frequently Asked Questions
About the Author
Simran Kumari

Passionate about observability, AI systems, and cloud-native tools. All in on DevOps and improving the developer experience.
Follow OpenObserve on Google
Add OpenObserve as a preferred source to see more of our articles in Google Search and Top Stories.