Database Monitoring with OpenTelemetry: Postgres Case Study




Ready to get started?
Try OpenObserve Cloud today for more efficient and performant observability.
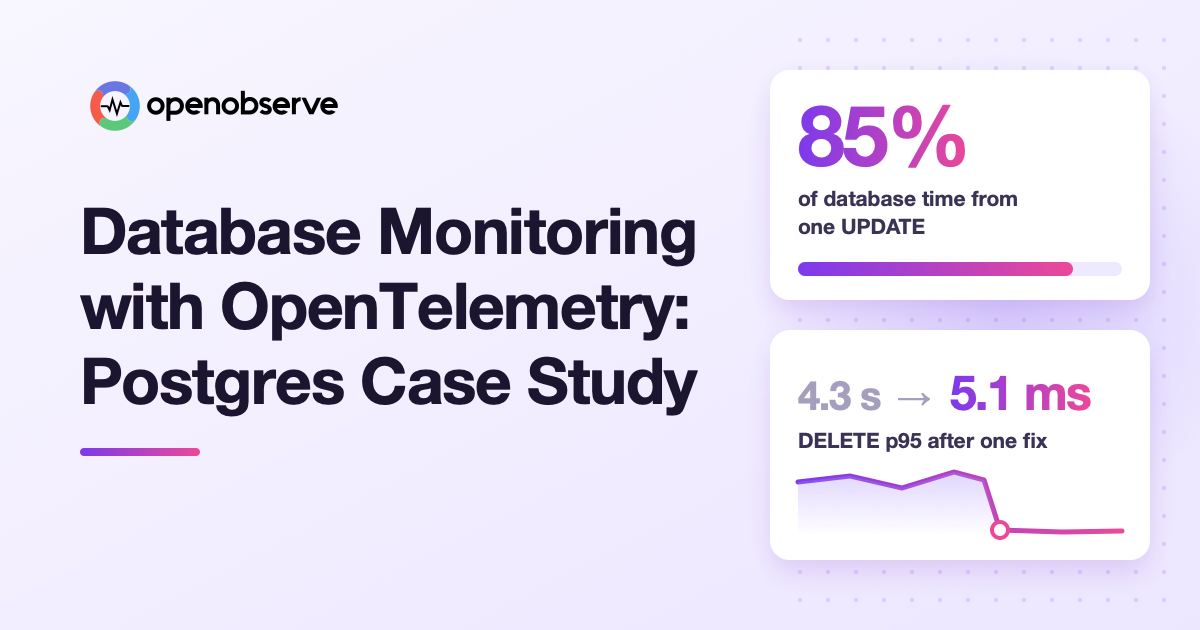
Database monitoring with OpenTelemetry ranks every query your database runs by the total time it costs, shows its plan and what it waits on, and links it to the traced requests that call it. We pointed OpenObserve's Database Monitoring at our own PostgreSQL meta store and found three slow query patterns, one of them an UPDATE using 85% of database time.
This post walks through each finding in our compactor, the fix and what changed, then shows how to set up the same monitoring on your database.
TL;DR
- Biggest cost: one UPDATE used 85% of database time rewriting unchanged rows.
- Slowest read: a cache reload fetched 40,700 rows per call, up to 31 s.
- Partition miss: the partition key cut a DELETE's p95 from 4.3 s to 5.1 ms.
- Setup: upstream OpenTelemetry Collector,
pg_stat_statements, a monitoring role. - Why OpenObserve: open source and OpenTelemetry-native, with no per-host fee.
How we pointed database monitoring at our own meta store
OpenObserve keeps its metadata in a relational meta store: stream settings, the list of Parquet files, compactor jobs and discovered services. On a PostgreSQL meta store, the compactor and service discovery talk to it constantly.
We merged Database Monitoring at the end of August 2026. Before it shipped in v1.0.0, we pointed it at the PostgreSQL meta store, an Amazon RDS instance, behind one of our internal OpenObserve clusters. Our clusters feed it from an internal agent that reads the same PostgreSQL views as the Collector receivers in the setup section, mainly pg_stat_statements and pg_stat_activity. Nothing was down. The database was just busier than it should have been, and nobody could say which query was responsible.
We opened Infra > Databases, went to Top queries, sorted by Database time and looked at a 12-hour window. One query dwarfed everything else. The activity samples brought up two more. All three came from the compactor and service-discovery pipeline.
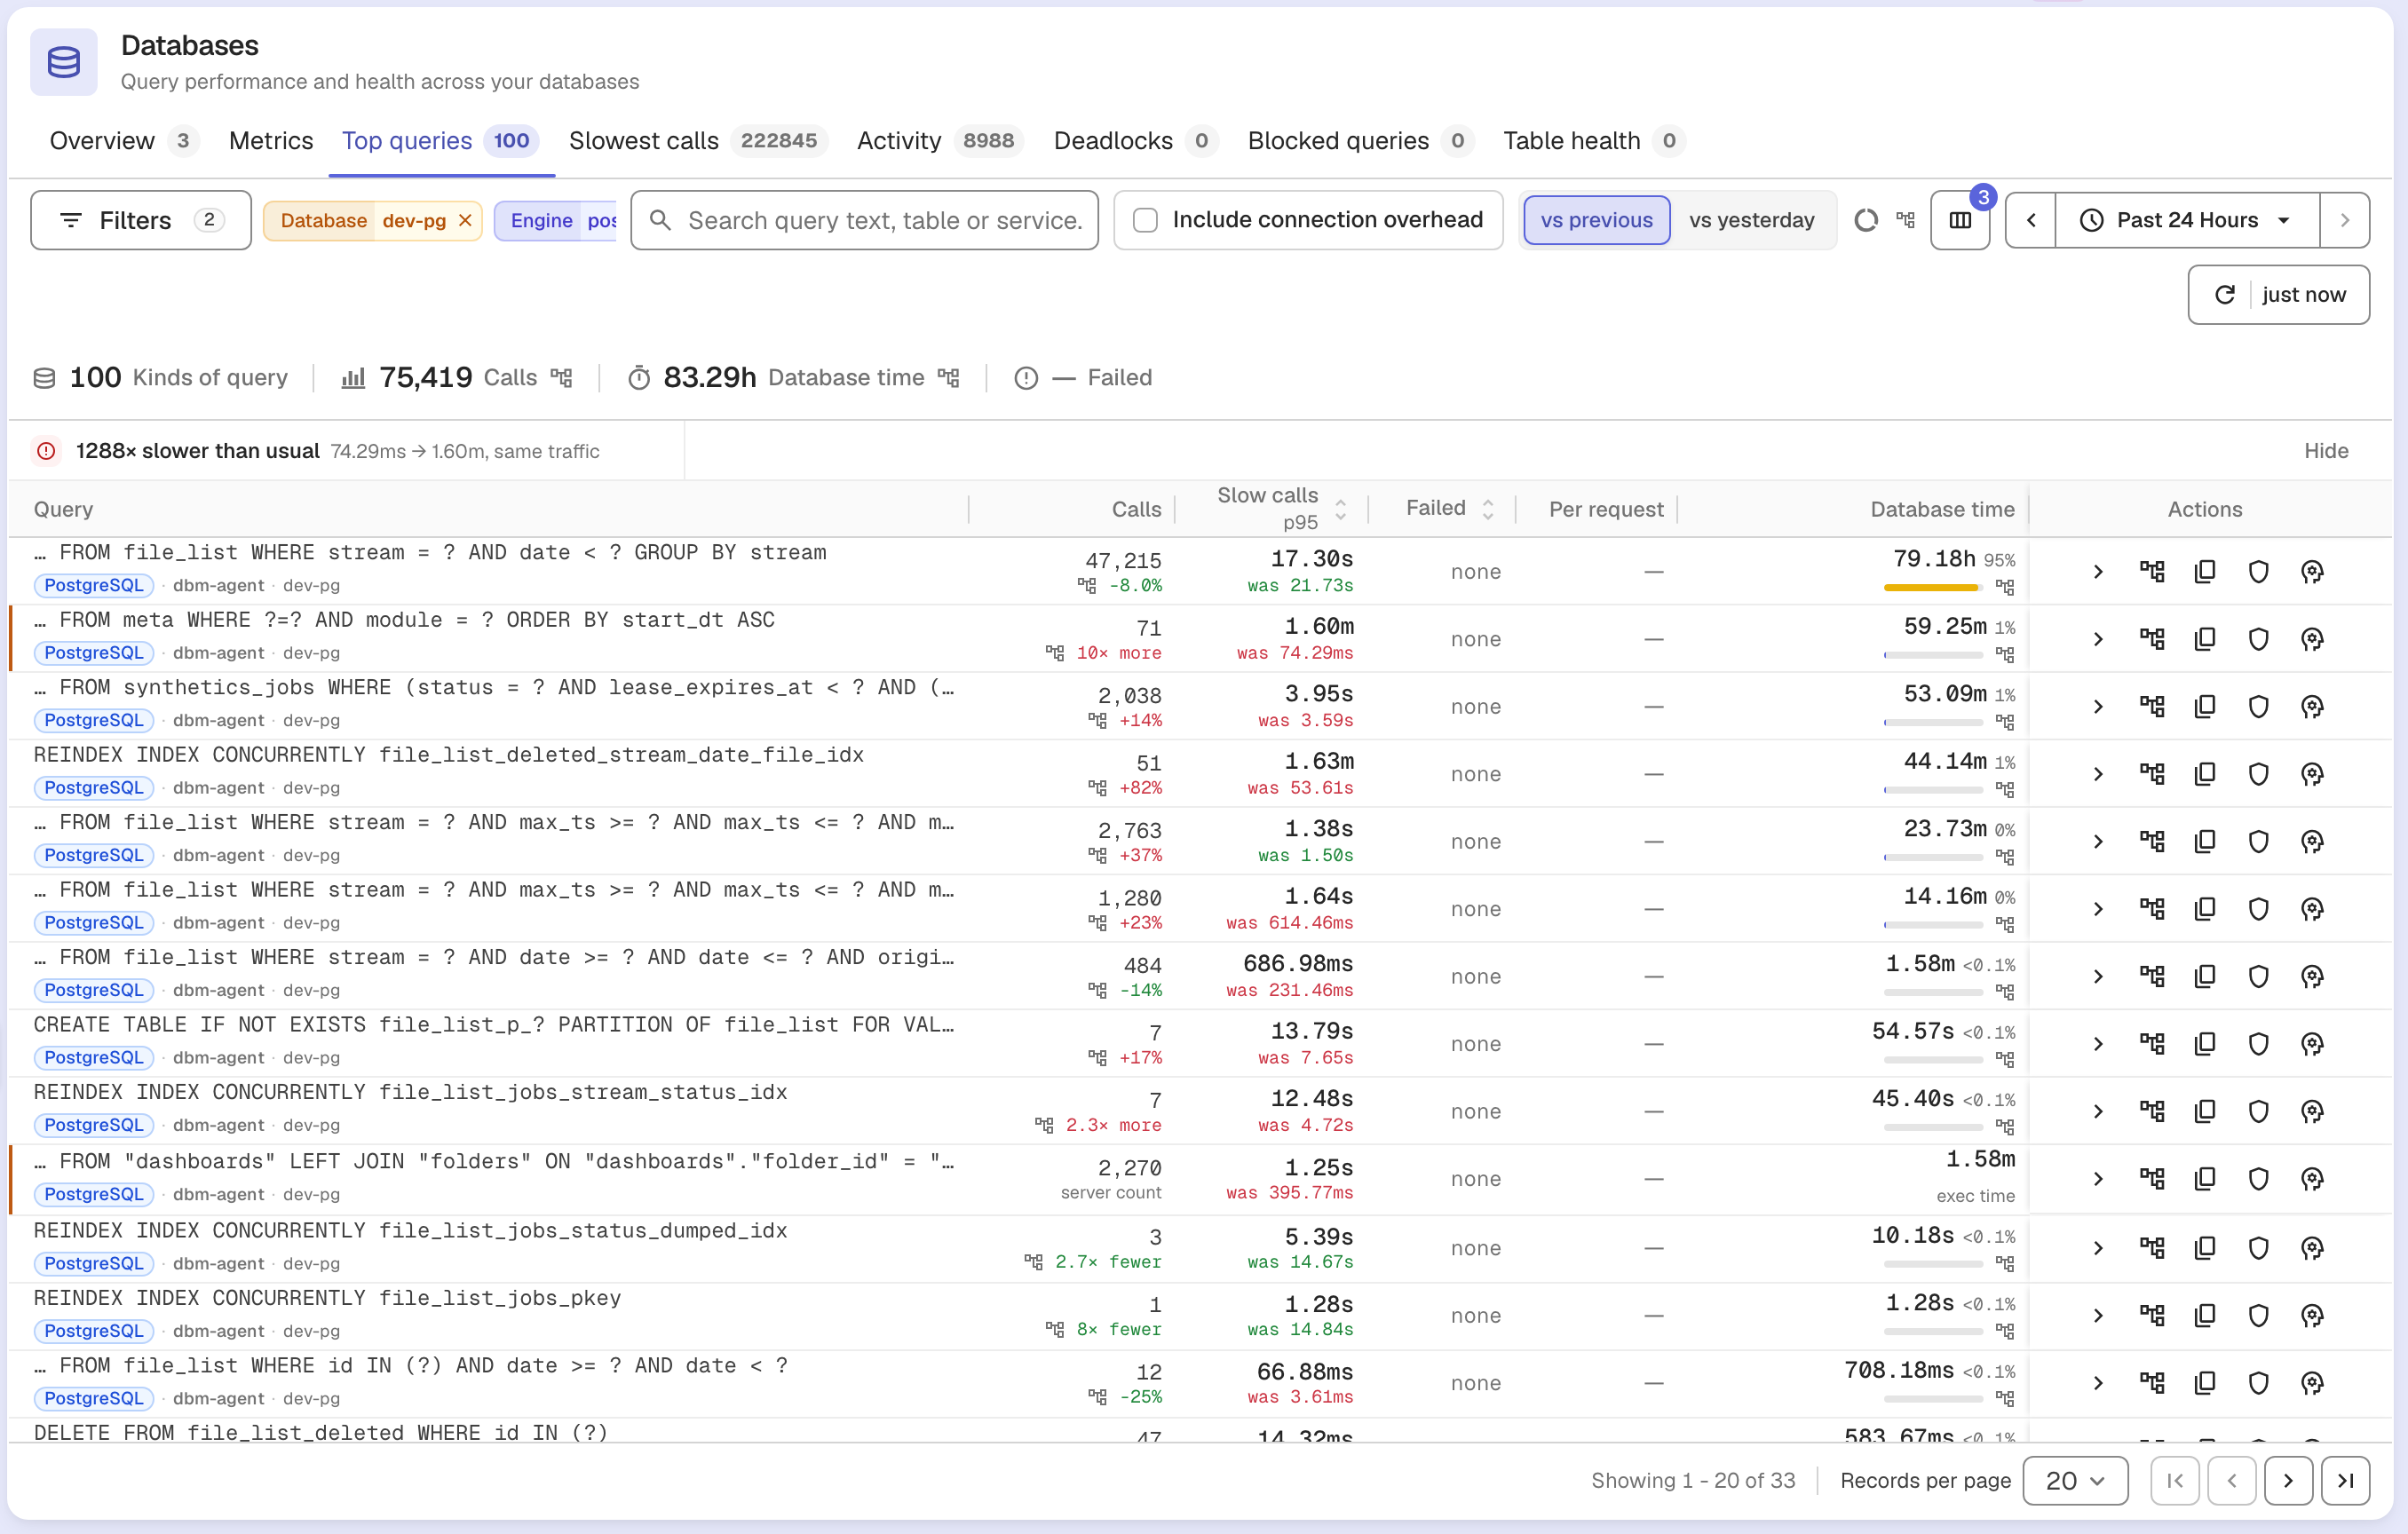
The numbers in the findings come from that run. The screenshots are newer: we took them on the current release against our databases today, so they show the same pages with different queries. Here is Top queries on one of our development databases:.
Finding 1: an UPDATE that rewrote rows that had not changed
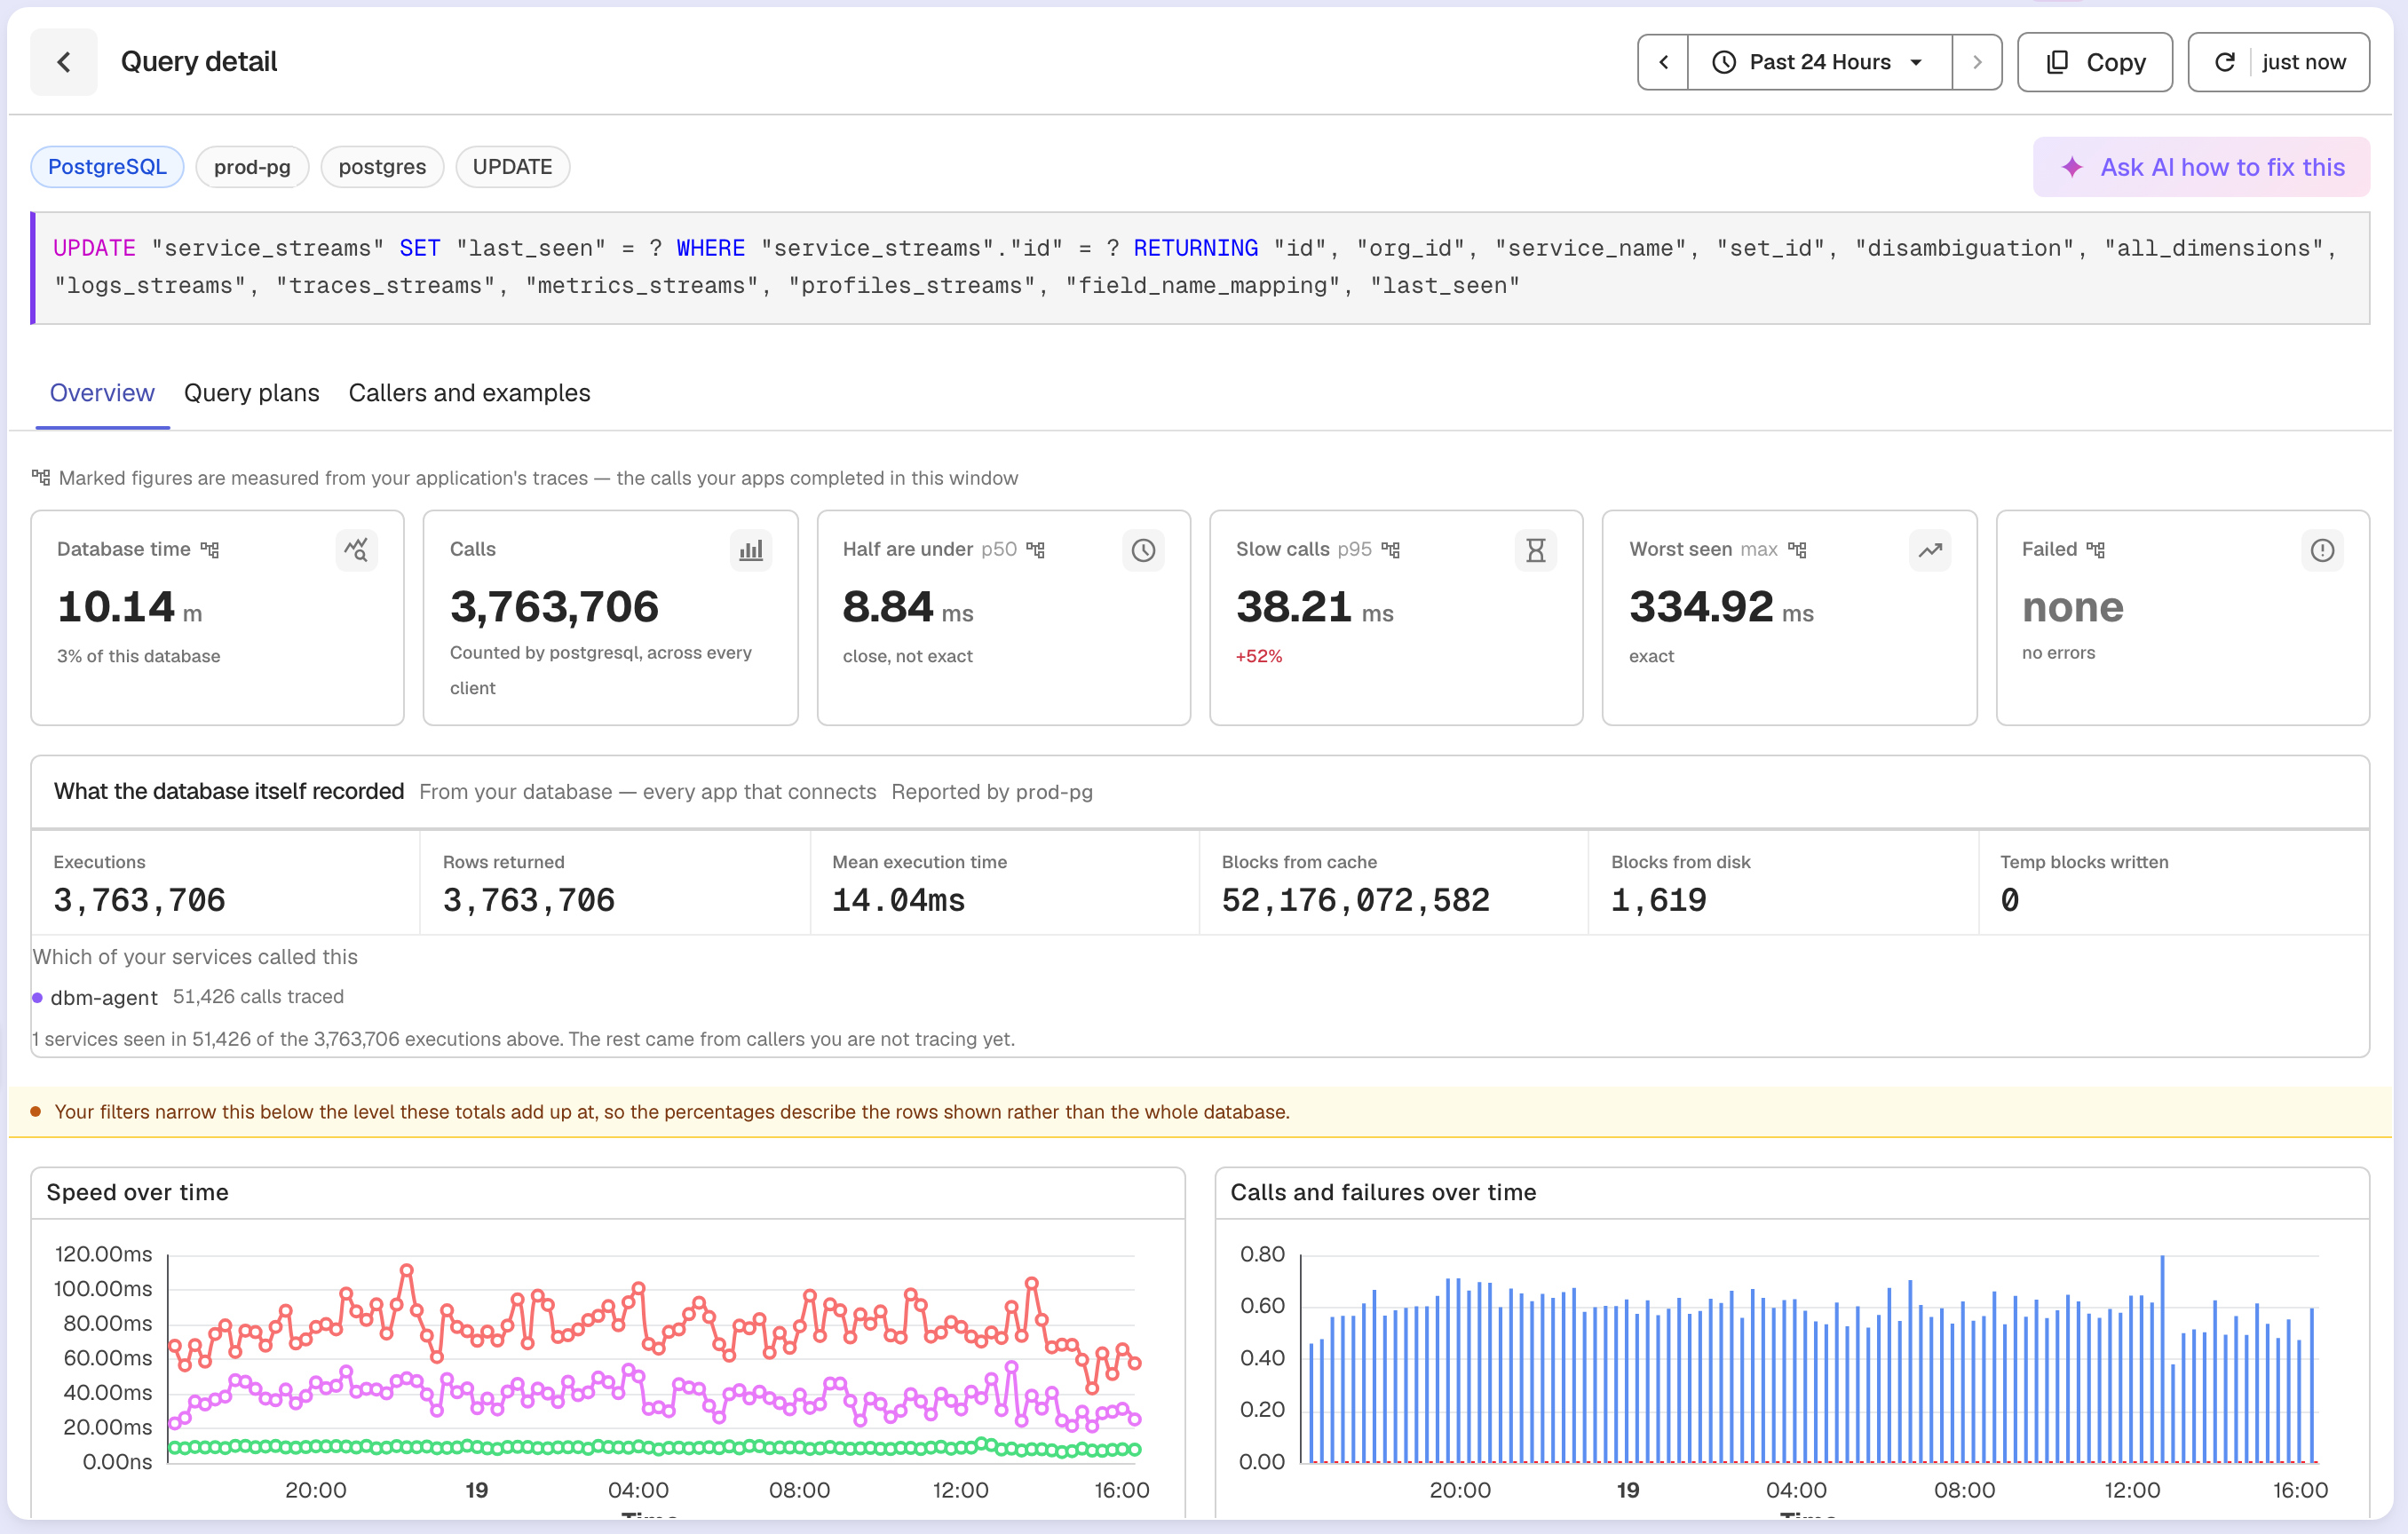
What Database Monitoring showed: the top query by database time was an UPDATE on the service_streams table, at 85% of all database time: 8.6 million calls in 12 hours, 55 ms each on average. About 11 connections were running it at any moment. When its samples waited, they waited on WAL writes (LWLock/WALWrite and IO/WalSync).
What it told us: no single call was slow enough to notice, so the volume was the cost, and the WAL waits said each call wrote more than it needed to. Service discovery re-observes every service on each flush. The code wrote all six columns back each time, four of them JSON, even when nothing had changed.
Fix: compare each field with the stored value and leave unchanged columns out of the SET clause. A re-observation with no changes now writes only SET "last_seen" = $1.
PostgreSQL still writes a new row version for every UPDATE, so the saving is not "one column instead of six". It is the JSON. Large JSON values are stored out of line in TOAST, and setting one, even to identical content, writes it to TOAST and WAL again. Leaving the column out of SET lets the new row version reuse the stored value.
Result: we could not measure this one in production afterwards, because our monitoring capture on that cluster changed during the rollout. In a test capture on the fixed build under real OTLP load (75 services, 4,434 writes), the dominant UPDATE shape became the single-column last_seen write. Partial changes write exactly the changed field.
On another of our clusters today, the UPDATE that runs is that single-column last_seen write: 3.8 million calls in 24 hours, 14 ms each on average.
Finding 2: a cache reload on every flush
What Database Monitoring showed: activity samples kept catching a SELECT that read an organization's entire service table, one of them still running after 31.3 seconds. pg_stat_statements counted 15,960 calls in 12 hours, about 40,700 rows per call. Every slow sample of it waited on Client/ClientWrite: PostgreSQL had the rows ready and was waiting for the client to take them.
What it told us: the database was not the bottleneck; a client was asking for too much data, too often. Database Monitoring could not name that client, because our own services did not yet send database spans, so we found it in the code. Every non-empty flush sent a cache-invalidation event, even when the flush changed nothing, and each querier node then reloaded the organization's whole table. With database spans from your services, the query page links straight to the caller.
Fix: send the event only when a data column changed, a row was inserted or an orphan was deleted. A last_seen update alone no longer counts.
Result: as with Finding 1, we have no production before and after for this one. With the fix, a flush that only refreshes last_seen no longer sends the event, so querier nodes reload an organization's services only when one of them changed.
Finding 3: a DELETE that probed every partition
What Database Monitoring showed: activity samples kept catching the compactor's delete from file_list, which is partitioned by date, still running after seconds. Across those samples, p95 was 4.3 seconds and the longest run 23.3 seconds, against a 2.9 ms average per call. When the samples waited, they waited on IO/DataFileRead, reading pages from disk.
DELETE FROM file_list WHERE id IN (...);
What it told us: a delete by id should not read that much. Without the partition key in the WHERE clause, PostgreSQL cannot prune partitions, so it checked every partition's local index for every delete.
We expected the Query plans tab to confirm it and found it empty: every EXPLAIN attempt had failed with permission denied for table file_list, because our monitoring role could read statistics but not the table. That is why the setup steps below grant SELECT on the tables whose plans you want. Instead, we ran EXPLAIN ANALYZE on a test table with 30 partitions and 3 million rows: the old statement scanned all 30 partitions and held 187 relation locks.
Fix: carry the date with each id and group the deletes by date:.
DELETE FROM file_list WHERE date = $1 AND id IN (...);
Result: in activity samples, the delete's p95 fell from 4.3 seconds to 5.1 milliseconds and its longest run from 23.3 seconds to 65 milliseconds, comparing a 12-hour window before the fix with one the day after. Over the 12 hours either side of the fix, pg_stat_statements agrees: the average call went from 2.9 ms to 0.55 ms while the compactor deleted three times as many rows. On the test table, the new statement scanned 1 partition and held 13 locks, about 20x faster on a cold cache.
Prepared statements can change this picture. The ids are written into the SQL text, so each delete is a new statement and PostgreSQL plans it fresh, pruning at plan time. With a cached generic plan, the new shape still scans one partition, but PostgreSQL 17 and earlier lock every partition before pruning.
The fixes shipped in openobserve#14023. Its description quotes smaller figures (58% of database time, 251,333 UPDATEs) taken from 2-second activity samples, which miss most short calls; for calls and database time, this post uses pg_stat_statements, which counts every execution.
What slow query patterns should you look for?
The three findings map to patterns worth checking in any PostgreSQL database:.
- High-volume fast queries. Rank by total database time, not latency. Finding 1 averaged 55 ms per call and still used 85% of database time.
- Writes that change nothing. An UPDATE that sets identical values still writes a new row version, WAL and, for large values, fresh TOAST data.
- Missing partition keys. On a partitioned table, every query that knows the partition key should include it.
How does database monitoring with OpenTelemetry work?
Query-level database monitoring tracks each distinct query a database runs: how often, how much total time, what it waits on, and the plan the database chose. OpenObserve builds it from two OpenTelemetry sources.
- Application traces. Any OpenTelemetry client span with database attributes, such as
db.system.name,db.query.textandserver.address, gives query timings with no database-side setup. See the traces documentation. - The database itself. An upstream OpenTelemetry Collector Contrib next to the database sends activity samples, top queries, plans, blocking chains and deadlock logs to the
_o2_dbm_serverstream. This side works on its own, so you can try it before any service is traced.
At ingest, OpenObserve normalizes every query (literals and bind parameters become ?, IN lists collapse, comments are stripped) and hashes it into a fingerprint. The same query from your application and from pg_stat_statements gets the same fingerprint, so one page shows its database time, its plans and the traced endpoints that call it. From a slow span in a trace you can open the query it ran, and from the query you can open its plan.
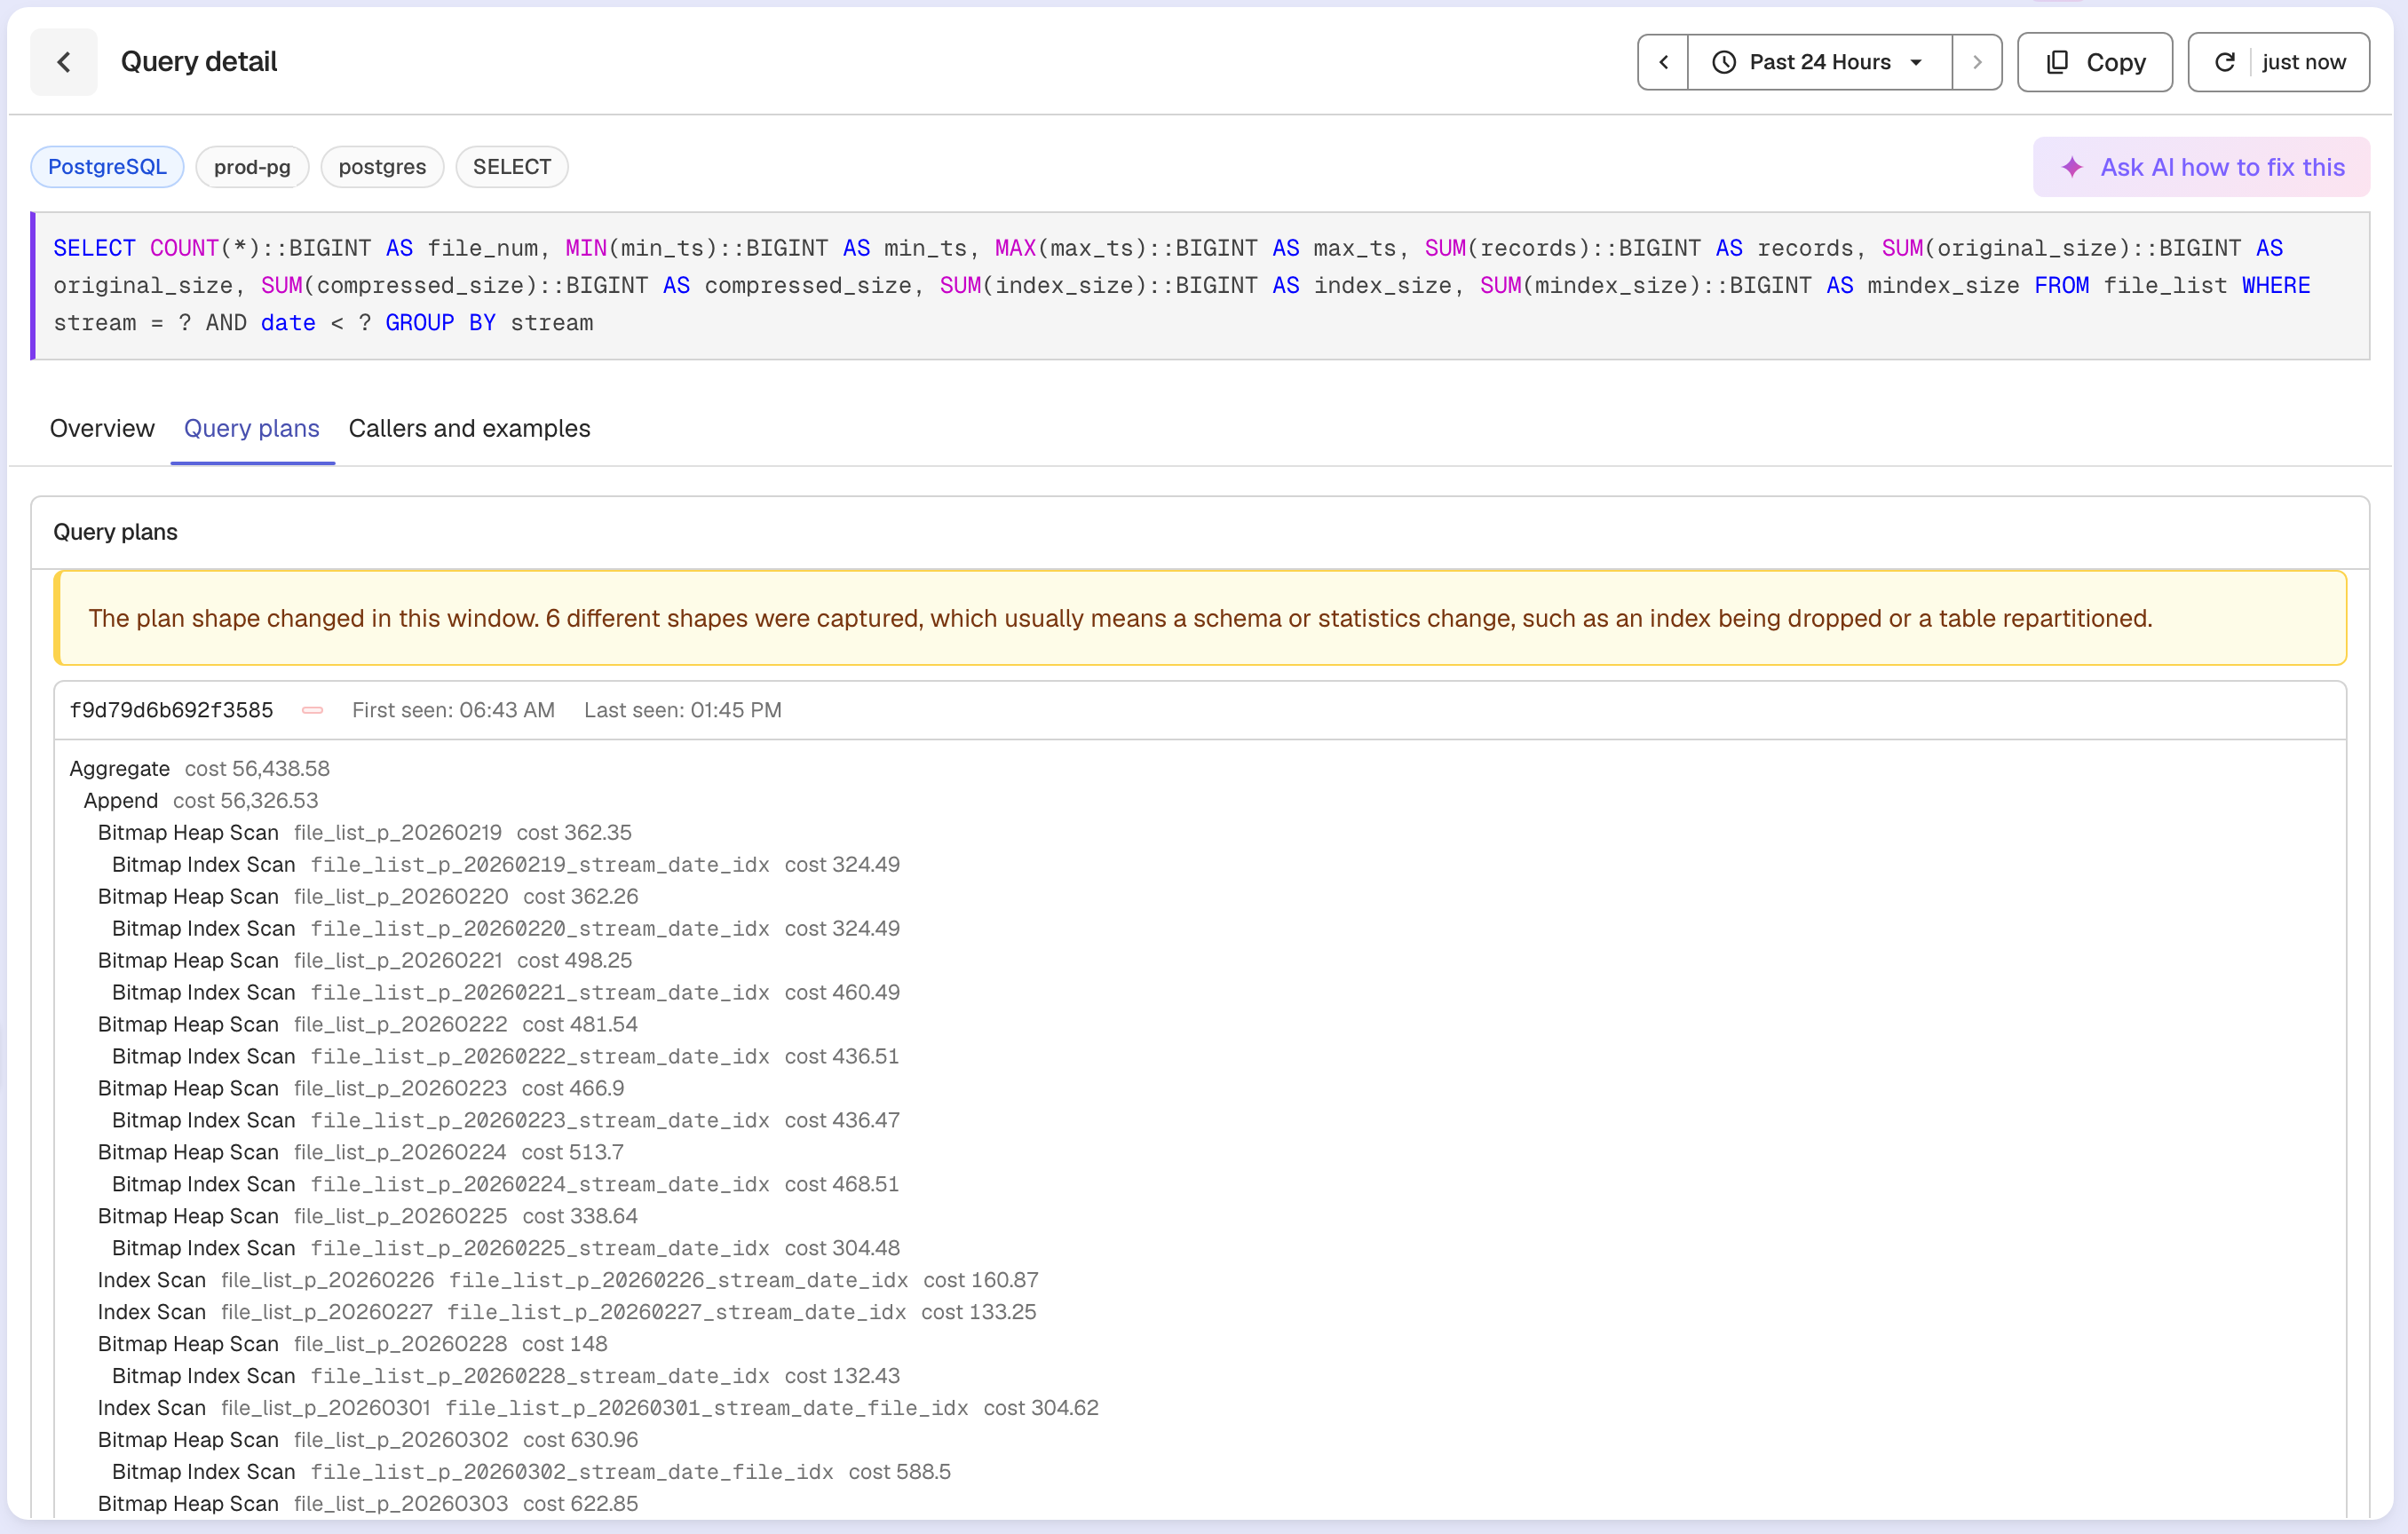
Here is the Query plans tab for a query on our date-partitioned file_list table. The plan appends one scan per partition, and the callout at the top flags that the plan's shape changed during the window:.
How to set up database monitoring with OpenTelemetry
Database Monitoring is on by default: OpenObserve fingerprints database spans and builds the query pages as soon as data arrives, with nothing to enable on the server. For PostgreSQL:.
Prepare PostgreSQL. Add
pg_stat_statementstoshared_preload_libraries(plusauto_explainif you want executed plans) and restart; this is the only step that needs a restart. Then, as a superuser, runCREATE EXTENSION IF NOT EXISTS pg_stat_statements;, create a monitoring role andGRANT pg_monitorto it. Also grant itSELECTon the tables whose plans you want to see.Configure the Collector. Open Data sources > Databases > Postgres in OpenObserve. The setup card generates the full config. Its core is the
postgresqlreceiver with query events turned on:.receivers: postgresql/dbm_events: endpoint: "db.example.com:5432" transport: tcp username: ${env:PGUSER} password: ${env:PGPASS} databases: [app] tls: ca_file: /etc/otelcol/db-ca.pem collection_interval: 10s query_sample_collection: max_rows_per_query: 1000 top_query_collection: top_n_query: 200 max_explain_each_interval: 200 query_plan_cache_size: 1000 collection_interval: 15s events: db.server.query_sample: { enabled: true } db.server.top_query: { enabled: true }Run upstream
otelcol-contrib, v0.148.0 or newer. The OpenObserve Collector build does not include the database receivers. Our post on OpenTelemetry Collector Contrib covers installing it.Open Infra > Databases and sort Top queries by Database time.
A few details catch people out:.
- The Collector's query events are off by default since v0.148.0. Without the
eventsblock, the Collector looks healthy and sends nothing. eventsis a top-level receiver key. Nesting it insidetop_query_collectionis a fatal config error.- The setup card's
postgresql/dbm_eventsreceiver ships withinsecure: true, which sends plain text. Outside a local test, replace it withca_filepointing at your server's CA, as in the snippet above. The card's SQL receivers already usesslmode=require.
Monitoring many databases. The SQL receivers do not have to run on the database host: any host that can reach the database port works, which is how you monitor managed databases. The exception is the log-file features (deadlock details, auto_explain plans and the server-side Slowest calls timings), which need the Collector on the database host itself.
One Collector can carry a receiver set per instance, or you can run one Collector per instance. Each monitored PostgreSQL instance uses about 13 connections in our test setup: the generated config caps 11 of them, and the activity and top-query feeds usually hold 2 more, so check max_connections on small instances. Point the postgresql receivers at the primary; the table and index stats queries can run against a standby.
For MySQL 8.0 or newer, grant SELECT, PROCESS, REPLICATION CLIENT, run SET PERSIST innodb_print_all_deadlocks = ON; and start from the MySQL setup card, because the mysql receiver names its options differently. The MySQL integration guide covers the metrics receiver. Our earlier posts on PostgreSQL metrics and MySQL metrics cover the receiver basics.
How much overhead does database monitoring add?
On our PostgreSQL 16 test rig with the shipped Collector config, monitoring measured 0.060% of database execution time and 13 connections per monitored instance, which come from the receivers' small connection pools. Top queries are collected every 15 seconds, activity samples and blocking every 10 seconds, and table and index stats every 5 minutes. Query plans and activity samples are the high-volume feeds; on our busiest meta store, plans were more than half of each day's Database Monitoring data. Lower top_n_query to track fewer queries and their plans, set enabled: false on db.server.query_sample if you only need top queries, or set a shorter retention on the _o2_dbm_server stream.
What should you know before rolling out OpenTelemetry database monitoring?
These points mostly follow from how PostgreSQL exposes data, so any tool that monitors it over SQL works within the same limits.
- Log-based extras need the database host. Deadlock details, executed plans from
auto_explainand the server-side Slowest calls timings come from the server's log file, so they need the Collector on the database host. On managed services such as RDS, Aurora and Cloud SQL, everything else runs over a SQL connection, as it does on our own RDS instances. - Point the Collector at the primary. That is where writes, locks and deadlocks happen; a standby sees only the reads it serves.
- Plans are estimated by default. Grant the monitoring role
SELECTon the tables you care about so their plans fill in, and on PostgreSQL add the optionalauto_explainstep to see executed plans for slow statements. - Blocking is sampled every 10 seconds, so very brief lock waits can fall between samples.
- Spans keep the SQL your application sends. Redact sensitive values in the SDK or Collector, or with OpenObserve's sensitive data redaction rules, and set a retention period on
_o2_dbm_serverthat matches your policy.
Should you use OpenObserve for database monitoring?
- What you get: top queries ranked by database time, plans collected automatically, database load by wait event, activity samples, a callout when a query's plan changes, and per-query alerts. Each query links to the traces that run it.
- Coming from another database monitoring tool: that daily workflow carries over: top queries, plans, database load, activity and per-query alerts. For index work, the Enterprise Table health page flags indexes with no scans since statistics were last reset, which are candidates to drop.
- Pricing: OpenObserve is ingest-based, with no per-host fee, so the bill follows the data you send, not how many instances you watch. Query plans and activity samples are most of that data; the overhead section above lists the settings that trim it.
- What is free: top queries, plans, plan-change callouts, database load, activity and per-query alerts work in every build, including open source. Deadlocks, Blocked queries (with lock-wait and deadlock alerts) and Table health (table sizes, dead rows, vacuum and analyze history) are in OpenObserve Enterprise and Cloud.
- No lock-in: it uses the standard OpenTelemetry Collector receivers and semantic conventions, so the receiver config works with any OTLP backend.
Where Database Monitoring fits in OpenObserve
OpenObserve is an open source (AGPL-3.0), OpenTelemetry-native observability platform, and Database Monitoring shares its storage and query engine. A slow query sits next to the traces that call it, the logs around it and the alerts on it, and its raw data is a normal stream you can query with SQL. OpenObserve is ingest-based, with no per-host or per-user fees, so adding another database instance costs only the data it sends.
The rest of the platform, grouped:.
- Telemetry: logs, metrics, traces (service graph, service catalog) and profiles.
- Frontend and synthetics: RUM, session replay and error tracking; synthetic browser and protocol checks.
- AI: AI Assistant, SRE Agent with AI root cause analysis, MCP server, LLM observability and evaluations, anomaly detection, log patterns and insights.
- Alerting and reliability: scheduled, real-time, composite and anomaly alerts, incident management, SLOs with error budgets and burn rate.
- Dashboards and reports.
- Data processing: pipelines, VRL functions, enrichment tables and downsampling.
- Storage: Parquet on object storage, bring your own bucket and extended retention.
- Security and compliance: SSO, RBAC, multi-tenancy, sensitive data redaction, audit trail, cipher keys and federated search; SOC 2 Type II, ISO 27001 and GDPR via the EU region.
- Open standards: OpenTelemetry, PromQL and SQL.
Get started with OpenObserve
- Sign up for OpenObserve Cloud with a 14-day free trial, then open Data sources > Databases to connect your first database.
- To self-host, follow the getting started guide, then use the setup steps above.
- The PostgreSQL integration guide covers the metrics receiver.
- Related reading: how to monitor PostgreSQL performance and OpenTelemetry Collector Contrib.
Frequently Asked Questions
About the Author
Ashish Kolhe


Ashish leads Engineering at OpenObserve. Ashish is obsessed with building high performance systems with simplicity in mind. He has vast experience in multiple disciplines like streaming, analytics, big data and more.
Follow OpenObserve on Google
Add OpenObserve as a preferred source to see more of our articles in Google Search and Top Stories.