Why Log Analytics at Scale Gets So Hard in 2026




Ready to get started?
Try OpenObserve Cloud today for more efficient and performant observability.
Log analytics at scale gets hard because the costs and limits of most log platforms grow faster than the data itself. Five challenges appear as volume moves from gigabytes to terabytes a day: index bloat, rising storage costs, slow queries, retention trade-offs, and high cardinality. Each has a structural cause, and each is avoidable with a different storage architecture.
TL;DR
- The five biggest log analytics challenges at scale are index bloat, hot storage cost, slow queries from shard fan-out, retention trade-offs, and high cardinality.
- The common cause is coupling storage to compute: index-based systems keep replicated data on the same nodes that query it, so every extra gigabyte costs disk, memory, and shards.
- Storing one compressed copy on object storage changes the math: on AWS list prices, two copies on block storage with headroom cost about 8x more per raw gigabyte than one copy on S3, before compression.
- OpenObserve is built for log analytics at scale, with Parquet on object storage, stateless queriers, time-partitioned files, and per-stream retention.
What is log analytics at scale?
Log analytics is searching, filtering, and aggregating log data to debug incidents, spot trends, and answer operational questions. Log analytics at scale is doing that when volume reaches hundreds of gigabytes to many terabytes a day, across hundreds of services, with retention measured in weeks or months.
At that size, collecting logs is the easy part. The hard part is keeping three things under control as volume keeps growing: what storage costs, how fast queries return, and how long logs stay searchable.
Why is log analytics at scale so hard?
At 10 GB a day, almost any log tool works. Data fits on a few disks, queries scan everything quickly, and nobody thinks about shards. At 1 TB a day, the same design meets hard limits: indexes outgrow memory, storage costs dominate the bill, dashboards time out, and retention gets cut to stay in budget.
The five breakpoints below appear in roughly this order as volume grows.
What are the biggest log analytics challenges at scale?
1. Index bloat and field mapping limits
Full-text log search engines build an inverted index and a field mapping for the data they store. Two effects show up at volume:
- Indexes take space and memory. The index is stored alongside the data, so it adds to every byte you keep, and frequently used parts need RAM to be fast.
- Field mappings explode. Logs from many services bring many field names. Elasticsearch caps fields per index with
index.mapping.total_fields.limit, which defaults to 1,000, to "prevent mappings and searches from becoming too large." (Source: Elasticsearch docs, Mapping limit settings, November 2026) Teams that hit it either drop fields or split indexes.
When mappings conflict, data is rejected. In our 1.1 TB benchmark of Elasticsearch and OpenObserve, Elasticsearch dropped 62% of Kubernetes-format log data because of schema mapping conflicts, while OpenObserve accepted all of it.
2. Rising log storage costs
Most index-based platforms keep searchable data on block storage attached to their nodes, and multiply it:
- Replicas. Elasticsearch keeps one replica per shard by default, so every byte is stored twice. (Source: Elasticsearch docs, Index settings, November 2026)
- Headroom. It stops placing shards on a node above 85% disk use, so you provision free space. (Source: Elasticsearch docs, Cluster-level shard allocation settings, November 2026)
- Media. Block storage costs more per gigabyte than object storage.
Shard counts add a second limit: Elastic recommends shards of 10 GB to 50 GB and allows 1,000 non-frozen shards per node by default, so 30 days of 1 TB a day with one replica already needs about 1,200 shards. (Source: Elastic docs, Size your shards, November 2026)
3. Slow log queries during incidents
Query speed matters most during an incident, which is exactly when queries cover the widest time ranges. A query over the last 24 hours has to find every piece of data in that window. In a shard-based system, the query fans out to every shard covering the range, waits for the slowest one, and merges results. Shard count grows with volume and retention, so the same query gets slower as you store more.
Aggregations make it worse. Counting errors by service across billions of rows means reading the service and level of every row. Row-oriented storage reads whole documents to get two fields; columnar storage reads only those two columns. In the same 1.1 TB benchmark, OpenObserve was faster on 14 of 15 queries, up to 32x on aggregations, while Elasticsearch was faster on COUNT(*) queries by 1.5x to 1.6x.
4. Log retention vs. cost trade-offs
When searchable storage is expensive, retention is the first thing cut. The usual pattern:
- Keep 7 to 15 days searchable.
- Move older logs to an archive tier or a bucket you can't query directly.
- Rehydrate or reindex an archive when an incident, audit, or security review needs older data.
That makes old logs technically retained but practically unusable: by the time a 60-day-old log is rehydrated, the question that needed it has often moved on. The fix is a single searchable tier that's affordable for months, plus retention set per log type rather than one global number.
5. High-cardinality log data
Cardinality is the number of unique values in a field. Logs are full of high-cardinality fields: user IDs, request IDs, trace IDs, pod names, IP addresses. They're the fields you most want to search by.
Systems that index or partition on such fields struggle. Grafana Loki's documentation says high cardinality causes Loki "to create many streams," which "causes Loki to build a huge index, and to flush thousands of tiny chunks to the object store," and that it "can lead to significant performance degradation." (Source: Grafana Loki docs, Cardinality, November 2026) Metrics systems have the same problem with labels, as our guide to Prometheus data cardinality explains.
In a columnar store, a high-cardinality field is just another column. It doesn't create streams, partitions, or index entries per value, so you can keep user_id and trace_id as searchable fields.
How do you handle high-volume log analytics?
Teams that run log analytics at terabytes a day tend to follow the same practices:
- Cut noise before storage. Health checks, verbose debug output, and duplicate events add volume without adding answers. Drop, sample, or reshape them in a pipeline instead of paying to store them.
- Emit structured logs. Consistent JSON fields are cheaper to store and faster to filter than free text. Our guide to structured logging best practices covers the details.
- Separate storage from compute. Keep data on object storage and scale query nodes for query load, not for disk.
- Store logs in a columnar format. Columnar files compress well and let queries read only the fields they use.
- Set retention per log type. Debug logs might need 7 days and audit logs a year; one global number wastes money on one and loses data on the other.
- Keep high-cardinality values as fields, not labels. Search on
user_idortrace_idwithout turning each value into a stream or index entry.
Which log analytics architecture works at scale?
| Challenge | Cause | How a modern log architecture avoids it |
|---|---|---|
| Index bloat | Inverted indexes and per-index field mappings | Columnar files with schema evolution per stream |
| Storage cost | Replicas on block storage with free-space headroom | One compressed copy on durable object storage |
| Slow queries | Shards grow with volume and retention | Time-partitioned files; read only matching files and columns |
| Retention trade-offs | Searchable tier too expensive to keep long | One searchable tier on object storage; retention per stream |
| High cardinality | Indexing or partitioning on high-cardinality values | High-cardinality values stored as ordinary columns |
That's the design OpenObserve follows. Ingesters convert incoming data into Parquet, "a columnar, compressed on-disk file format optimized for analytical queries," grouped by time, and write it to object storage. Queriers are fully stateless, and a query uses the file list index to read only files in its time range. A compactor merges small files into larger ones and enforces retention. (Source: OpenObserve docs, Architecture, November 2026)
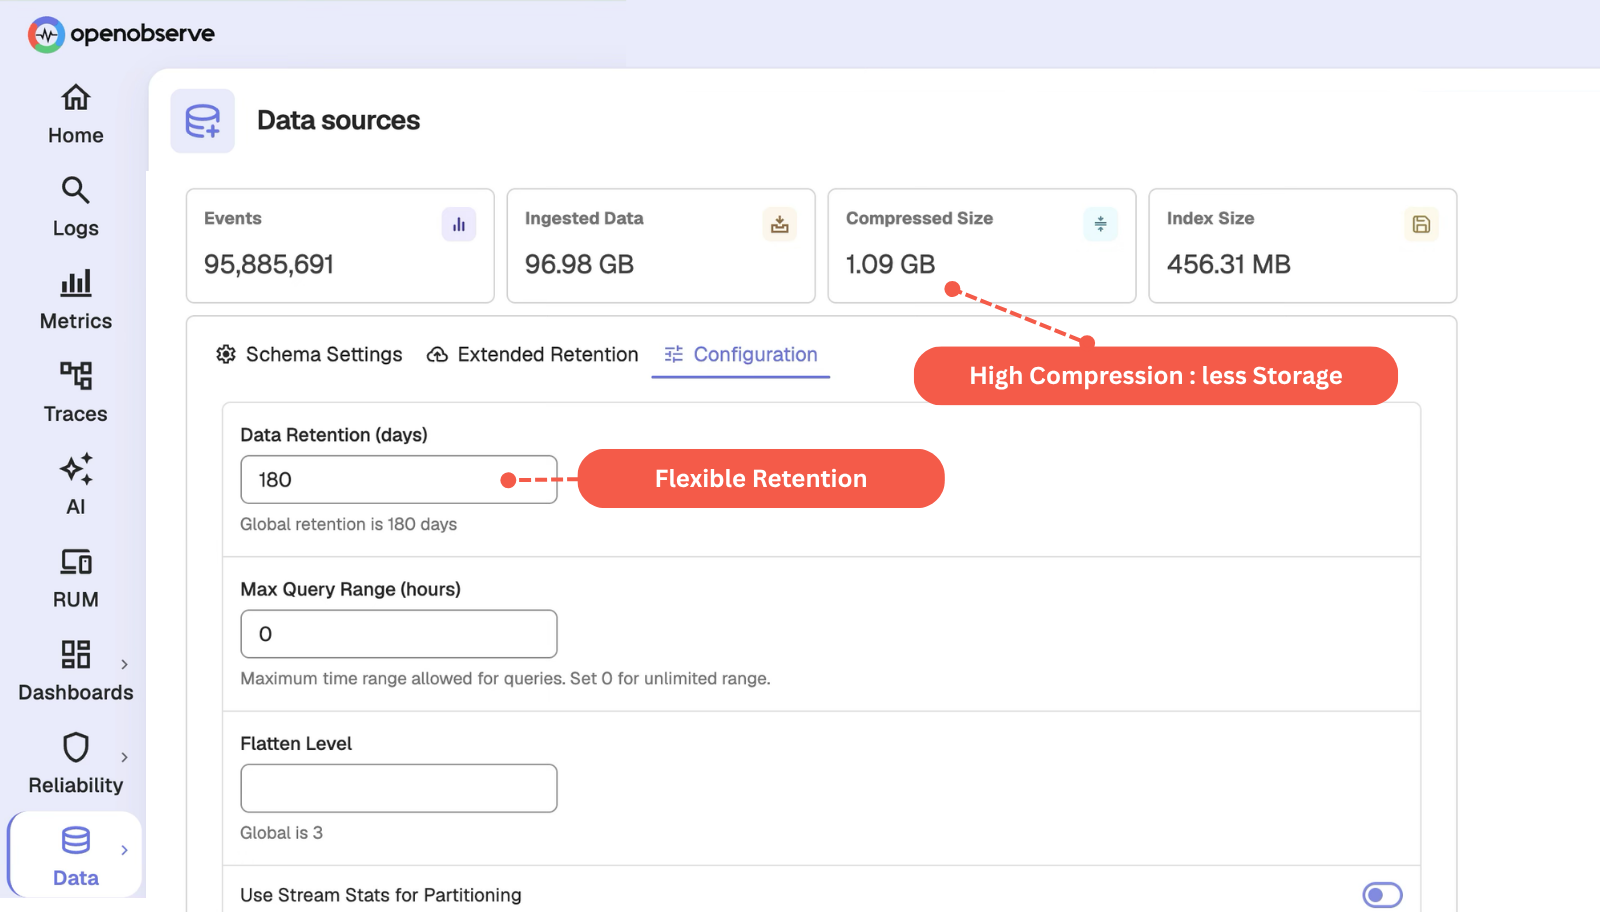
The result is approximately 140x lower storage costs in typical log workloads compared to Elasticsearch-based stacks; actual results vary based on data entropy and cardinality.
How OpenObserve handles log analytics at scale
OpenObserve is an open-source (AGPL-3.0) observability platform. For logs, it gives you SQL and full-text search over Parquet on object storage, per-stream retention, and extended retention for the time ranges that matter. A single node ingests and searches more than 2 TB per day, and HA mode on Kubernetes scales ingesters and queriers separately.
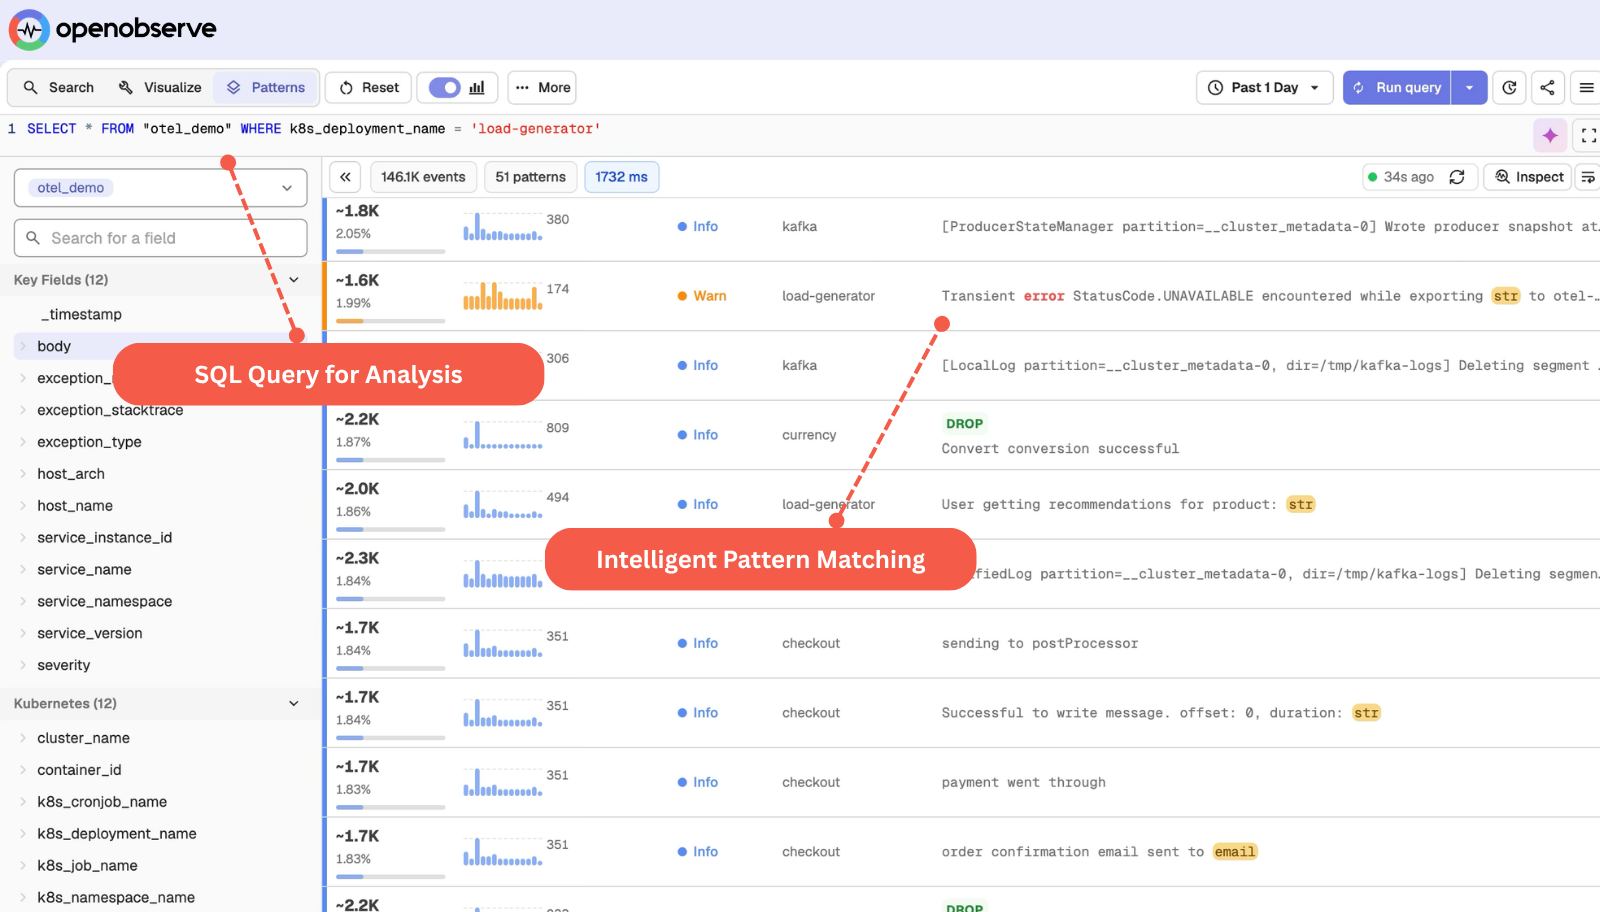
The same platform covers the rest of your telemetry:
- Telemetry: logs, metrics, and traces with a service graph and service catalog, plus continuous profiles.
- Frontend monitoring: real user monitoring (RUM), session replay, and error tracking.
- Synthetic monitoring: scheduled browser and protocol checks.
- AI: AI Assistant, SRE Agent for AI root cause analysis, an MCP server, LLM observability and evaluations, anomaly detection, log patterns, and insights.
- Alerting and reliability: scheduled, real-time, composite, and anomaly alerts, incident management, and SLOs with error budgets and burn rates.
- Dashboards and reports: real-time dashboards and scheduled PDF, PNG, or CSV reports.
- Data processing: pipelines, VRL functions, enrichment tables, and metrics downsampling.
- Storage and cost: Parquet on object storage, Bring Your Own Bucket, extended retention, and ingest-based pricing with no per-host or per-user fees.
- Security and governance: SSO, RBAC, multi-tenancy, sensitive data redaction, audit trail, cipher keys, and federated search.
- Compliance: SOC 2 Type II, ISO 27001, and GDPR via the EU-Central 1 (Frankfurt) region.
- Open standards: OpenTelemetry-native ingestion, PromQL and SQL querying, and open source under AGPL-3.0.
Get started with OpenObserve
- Send a copy of your log traffic to OpenObserve Cloud with a 14-day free trial and compare query times and storage.
- Read the architecture docs to plan a self-hosted deployment on object storage.
- Related reading: the top log management tools.
Frequently Asked Questions
About the Author
Manas Sharma


Manas is a passionate Dev and Cloud Advocate with a strong focus on cloud-native technologies, including observability, cloud, kubernetes, and opensource. building bridges between tech and community.
Follow OpenObserve on Google
Add OpenObserve as a preferred source to see more of our articles in Google Search and Top Stories.