API & Uptime Monitoring: The Complete Guide




Ready to get started?
Try OpenObserve Cloud today for more efficient and performant observability.
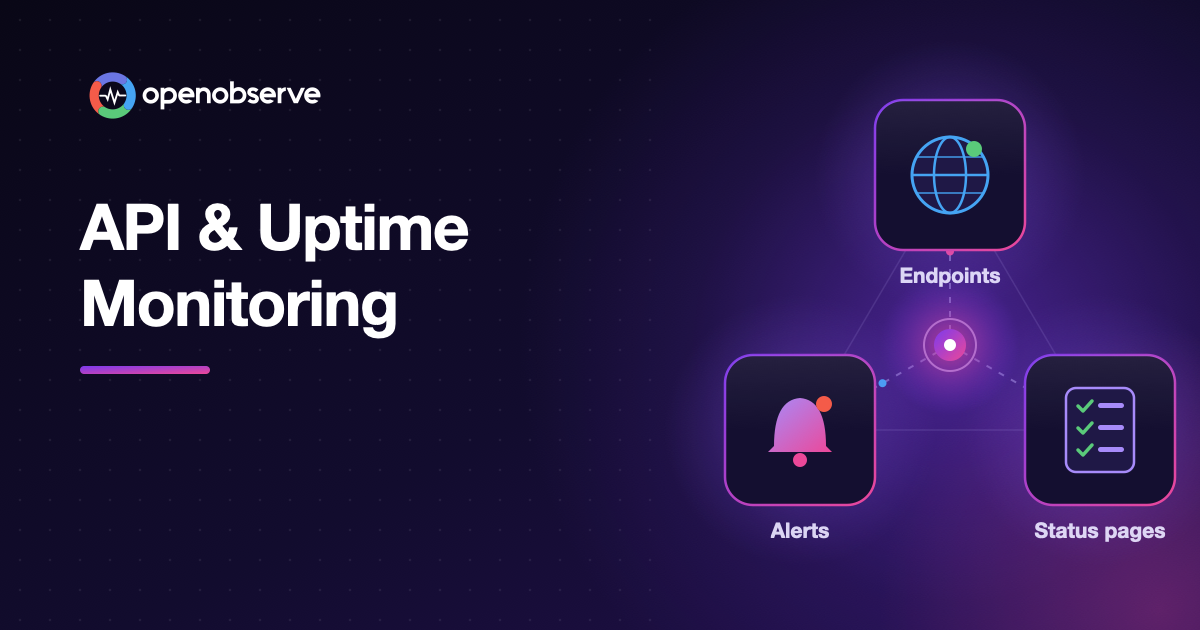
API and uptime monitoring is the practice of checking your endpoints on a schedule from outside your systems, asserting that each response is correct, and alerting when one fails. Uptime monitoring confirms a service is reachable; API monitoring also checks status codes, response bodies, and latency. Together they tell you something is broken before your customers do.
TL;DR
- Uptime monitoring tells you whether an endpoint, port, or TLS certificate is reachable and healthy, so you catch outages, DNS failures, and expiring certificates early.
- API monitoring sends real requests and asserts on the status code, response body, and response time, so it also catches a
200 OKthat returns an error or a response that is too slow. - Alerts should fire on two or three consecutive failures from more than one location, which filters out network blips without hiding real outages.
- Your uptime target sets your detection budget: 99.9% allows about 43 minutes of downtime a month, while 99.99% allows about 4 minutes.
- OpenObserve is the best setup for API and uptime monitoring because it runs the checks, alerts, and status page in the same platform as your logs, metrics, and traces, so you see why a check failed, not just that it did.
What is API monitoring?
API monitoring is the continuous testing of API endpoints to verify that they are available, return correct data, and respond fast enough. A monitor sends a real request, with the same method, headers, and body a client would send, and compares the response against rules called assertions.
A passing API check proves three things at once: the endpoint answered, it answered with the right content, and it answered within your latency budget. A failing check tells you which of the three broke.
API monitoring is a form of synthetic monitoring: the traffic comes from a probe, not from real users. That's what lets it find problems at 3 a.m., on an endpoint nobody has called yet, before the first customer hits it.
What is uptime monitoring?
Uptime monitoring is the practice of checking at regular intervals whether a website, API, server, or service is reachable, and recording how much of the time it was. The output is a pass or fail per check and an uptime percentage over a period, such as 99.95% over the last 30 days.
Uptime checks are deliberately simple. They request a URL, open a TCP connection to a port, inspect a TLS certificate, or log in over SSH. Because they are lightweight, you can point them at every public endpoint and every critical piece of infrastructure, not just the APIs you write. If you already run the OpenTelemetry Collector, its HTTP check receiver can probe URLs too; see uptime and SSL monitoring with the OpenTelemetry Collector.
API monitoring vs uptime monitoring: what's the difference?
Uptime monitoring asks "is it up?". API monitoring asks "is it right?". You need both, because a service can be reachable and still broken.
| Uptime monitoring | API monitoring | |
|---|---|---|
| Question it answers | Is it up? | Is it right, and fast enough? |
| Typical check | HTTP request, TCP port, TLS certificate, SSH login | HTTP request with headers, body, and assertions |
| Catches | Outages, DNS and network failures, closed ports, expired certificates | Wrong status codes, broken or empty responses, slow endpoints |
| Misses | A 200 response with an error in the body |
Failures in multi-step user flows |
| Where to use it | Every public endpoint and critical host | Critical API paths: login, search, checkout, payments |
| Output | Uptime percentage, up/down history | Pass rate, latency percentiles, assertion results |
Neither replaces browser monitoring, which replays a whole user journey in a real browser, or real user monitoring (RUM), which measures what actual visitors experience. Synthetic checks tell you what would happen if someone visited right now; RUM tells you what happened to the people who did. For how they fit together, see synthetic monitoring vs RUM.
Why API and uptime monitoring matter
Most outages are found in one of two ways: by a monitor, or by a customer. Every minute between the failure and the first alert is a minute in which customers hit errors, support tickets pile up, and your SLA budget drains. API and uptime monitoring exist to make sure the monitor always wins.
They matter for four reasons:
- Detection before customers. Checks run whether or not anyone is using the endpoint, so a broken release, an expired certificate, or a DNS change shows up at the next run, not at the next customer complaint.
- Proof for SLAs and SLOs. Uptime history is the evidence behind every availability promise you make. Without it, a "99.9%" commitment is a guess.
- Coverage of what your own telemetry can't see. Logs and traces only exist for requests that reached your service. If DNS, a load balancer, a CDN, or a certificate fails first, the request never arrives, and only an outside check notices.
- Faster resolution. A good check tells you which endpoint failed, from which location, and at which stage of the request (DNS, connect, TLS, or server). That narrows the search before anyone opens a dashboard.
How does API monitoring work?
Every API or uptime monitor follows the same loop: schedule, probe, measure, assert, and act.
- Schedule. A scheduler triggers the check at a fixed frequency, such as every minute, or on a cron expression.
- Probe. Agents in one or more locations send the request. Public locations test the path your users take over the internet; private locations sit inside your network and test internal APIs.
- Measure. Each run records the response and how long each stage took: DNS lookup, TCP connect, TLS handshake, and time to first byte (TTFB).
- Assert. The response is compared against your assertions. Any failed assertion, or no response at all, fails the run.
- Act. Results feed the run history and uptime percentage. Consecutive failures trigger an alert, open an incident on your status page, and send you into logs and traces to find the cause.
What metrics should you track in API and uptime monitoring?
The metrics below cover availability, speed, correctness, and the early warnings that come before an outage.
| Metric | What it tells you | Typical threshold |
|---|---|---|
| Uptime / availability | Share of time the endpoint passed its checks | 99.9% or higher for customer-facing APIs |
| Pass rate | Share of runs that passed in a window | Anything below 100% deserves a look |
| Response time (p95) | The slow tail, not the average | Set from your latency SLO, such as 500 ms |
| Timing breakdown | Whether time went to DNS, connect, TLS, or the server | A spike in one stage points to its owner |
| Status code | Whether the endpoint answered as expected | 200 (or your expected code) |
| Response correctness | Whether the body has the right content | Contains an expected field or value |
| Error rate by location | Whether a failure is regional or global | One location failing is usually the network |
| Certificate days remaining | How soon a TLS certificate expires | Fail 30 days before expiry |
| Retry and flaky rate | How often a run only passed after a retry | A rising rate means an unstable endpoint |
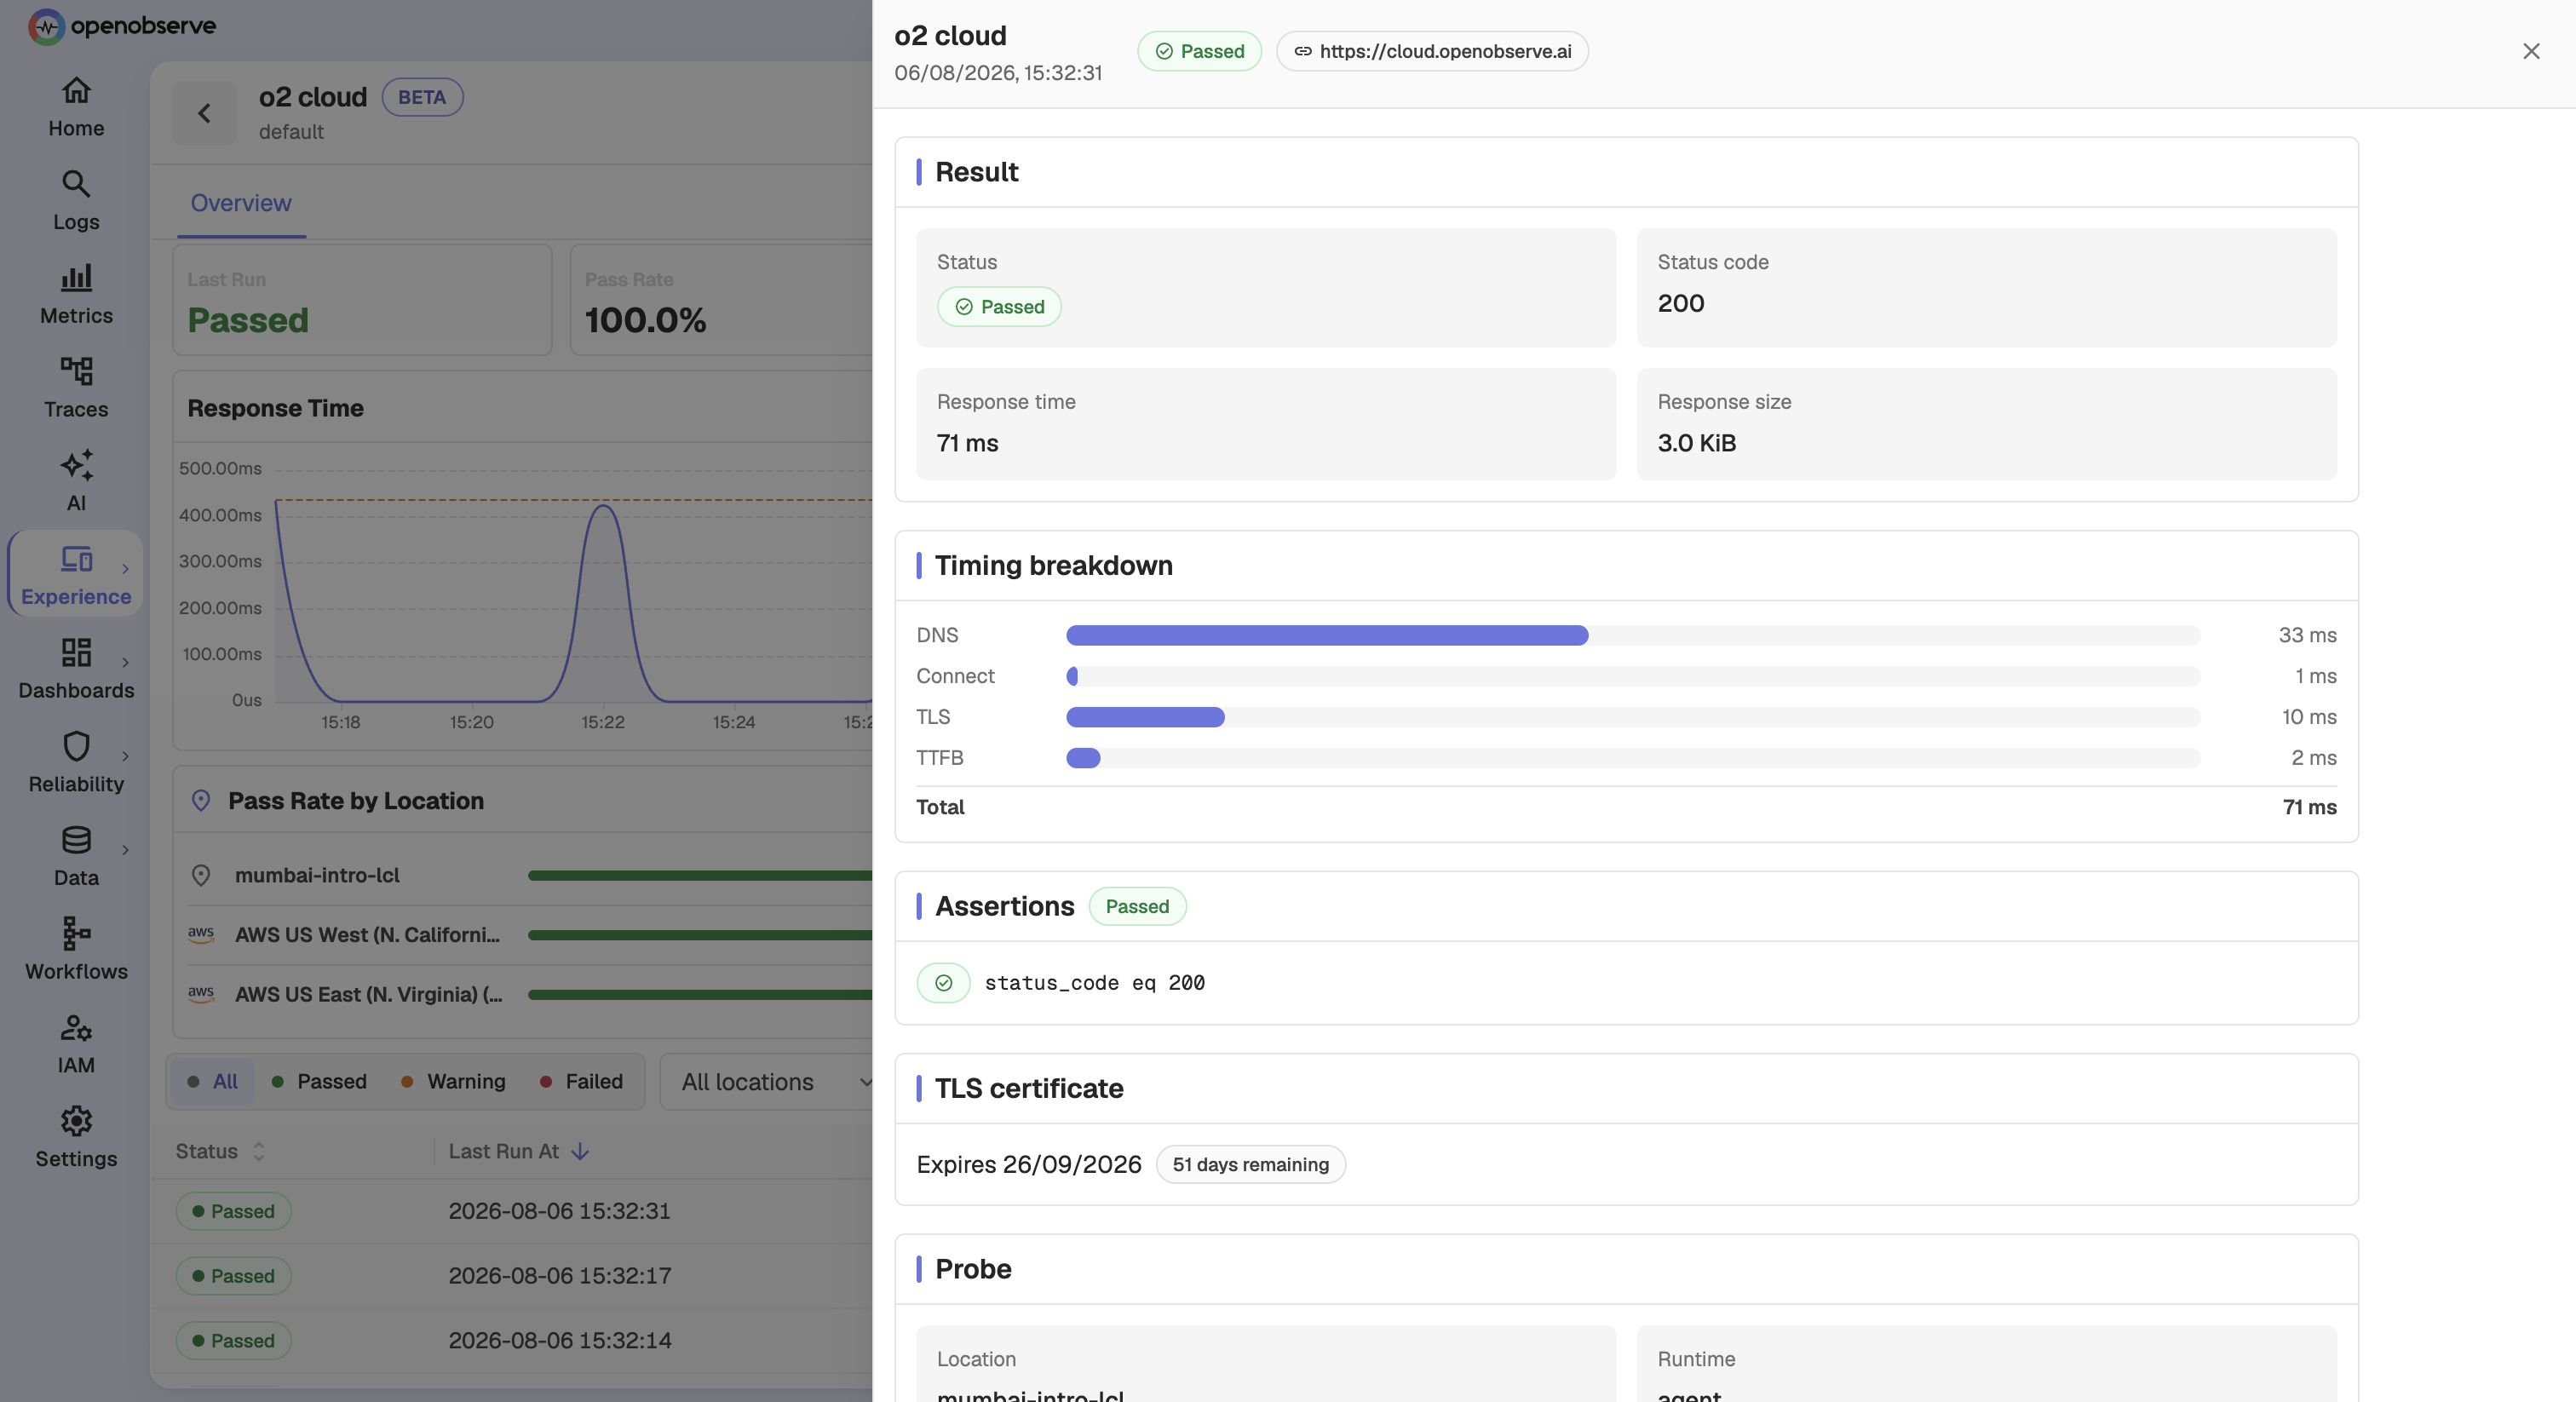
The timing breakdown is the most underused of these. A high TTFB with fast DNS and connect points at your application. A slow TLS stage points at the handshake or certificate chain. Slow DNS points at resolution, which is often outside your control. In OpenObserve, every protocol run reports this breakdown next to the assertions and certificate expiry:
Outside-in checks pair well with the request rate, errors, and duration you collect from inside the service. For that server-side view of the same endpoints, see our guide to RED metrics monitoring.
How do you monitor APIs and endpoints?
A good API or uptime check has six parts. Get each right and your checks will be both sensitive and quiet.
1. Pick the right target and request
Point the check at the endpoint your users depend on, not just the home page. For an API, send the same method, headers, and body a real client sends, such as GET /api/checkout/health or a POST with a test payload.
Use dedicated health endpoints for deep checks. A good health endpoint exercises the database and the downstream services the API needs, so a passing check means the whole path works, not just the web server in front of it.
2. Write assertions that define "healthy"
Assertions define what a correct response looks like. Check at least three things:
- Status code: for example,
status_code equals 200. - Response body: a field or string that only appears when the response is correct, such as
"status":"ok". - Response time: a latency limit that reflects your SLO, such as
response time less than 500 ms.
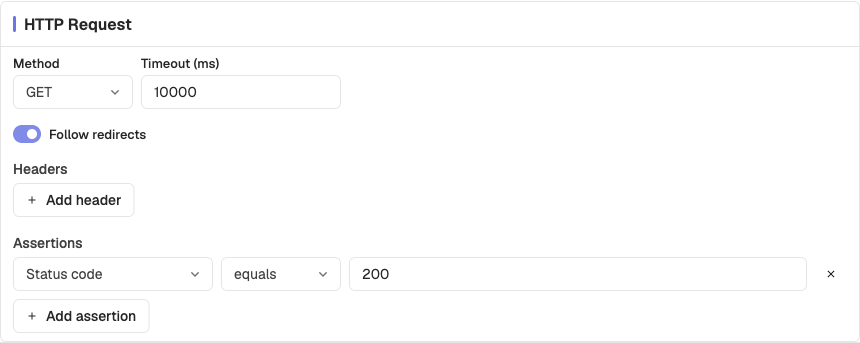
A check without a body assertion passes when the server returns 200 with an error page, which is one of the most common gaps in uptime monitoring. Here is where those assertions live in an OpenObserve HTTP / API check:
3. Choose a check frequency
Every 1 minute for revenue-critical endpoints and every 5 minutes for everything else is a sensible default. Faster checks find outages sooner but multiply run counts, and every probe location runs the check independently, so three locations at 1 minute is three runs a minute.
Frequency also sets a floor on how fast you can alert, which the alerting section below works through with numbers.
4. Run from multiple locations
Run each check from at least two or three locations where your users are. Location data turns a single red light into a diagnosis:
- One location failing: usually a regional network or routing problem between that probe and you.
- Every location failing: your service, your DNS, or your edge is down.
- Slow from one region only: a CDN, peering, or regional deployment problem.
Add private locations to check internal APIs, staging environments behind a VPN, and databases on private subnets that aren't reachable from the internet.
5. Cover certificates, ports, and servers
Not every outage is an HTTP error. Add checks for the rest of the stack:
- TLS certificate checks that fail a set number of days before expiry, so renewal problems surface as a warning, not an outage.
- TCP port checks for databases, message brokers, mail servers, and anything else that listens on a port.
- SSH checks to confirm critical servers accept connections and authenticate.
6. Handle authentication and secrets safely
Most real APIs need a token or credentials. Store them as masked variables rather than plain text, and use a dedicated monitoring account with the least privilege that still proves the endpoint works. Never reuse a real customer's credentials in a monitor.
Types of uptime and API checks
Different targets need different checks. This is the set most teams end up with:
| Check type | What it verifies | Example targets |
|---|---|---|
| HTTP / API | Status code, response body, and response time | REST and GraphQL endpoints, health checks, webhooks, websites |
| TCP port | A host accepts a connection on a port | PostgreSQL on 5432, Redis on 6379, Kafka brokers, SMTP |
| SSL / TLS certificate | Certificate chain, hostname, and days to expiry | Every public HTTPS domain and API host |
| SSH | A server accepts SSH and authenticates | Bastion hosts, build servers, critical VMs |
| Browser test | A multi-step journey works in a real browser | Sign-in, search, add to cart, checkout |
Start with HTTP and TLS checks on every public domain, add TCP checks for the stateful services behind them, and add browser tests for the two or three journeys that make you money. For a wider comparison of tools that run these checks, see our list of the best synthetic monitoring tools.
How should uptime alerting work?
Good uptime alerting is fast for real outages and quiet for blips. Get it wrong in one direction and you miss outages; get it wrong in the other and on-call learns to ignore the pager.
- Alert on consecutive failures, not single ones. Two or three failures in a row filters out one-off network errors on checks that run every minute.
- Retry before failing. A short retry within the same run catches transient errors without delaying real alerts much.
- Confirm across locations. A failure seen from several locations is far more likely to be real than one seen from a single probe.
- Add a cooldown so a sustained outage sends one notification, not one per run.
- Route by severity. Page on-call for checks on critical paths, and send the rest to a team channel.
- Watch flakiness. A check that keeps needing retries is telling you something about the endpoint or the check.
Frequency and the failure threshold together decide how long an outage can run before anyone is paged. In the worst case, detection takes about the check interval multiplied by the number of consecutive failures you require:
The cost of fast detection is noise, which is why the threshold and retries matter as much as the interval. If your alerts are already too noisy, our guide to alert fatigue covers how to cut them back without losing coverage.
What is a good uptime percentage?
A good uptime percentage is the one your customers need and your team can defend. Each extra "nine" cuts your allowed downtime by a factor of ten, and that budget decides how fast your monitoring has to be.
| Availability target | Allowed downtime per 30-day month | Allowed downtime per year |
|---|---|---|
| 99% | 7.2 hours | 3.65 days |
| 99.5% | 3.6 hours | 1.83 days |
| 99.9% | 43.2 minutes | 8.76 hours |
| 99.95% | 21.6 minutes | 4.38 hours |
| 99.99% | 4.32 minutes | 52.6 minutes |
Put the two charts side by side and the tradeoff is clear. At 99.99%, a check that runs every 5 minutes and alerts after three failures takes about 15 minutes to page anyone, more than three times the month's entire downtime budget. At 99.9%, the same check uses about a third of the budget before anyone starts working on the fix.
Uptime targets are usually written down as SLAs (contractual promises to customers) and SLOs (internal targets, usually stricter than the SLA). Uptime checks are one of the most direct ways to measure them. Our guides on setting meaningful SLOs and SLO-based alerting cover how to pick the target and alert on error budget burn instead of single failures.
Do you need a status page?
Yes, if customers depend on your API. A status page tells customers what's happening during an incident, so your support team isn't answering the same question hundreds of times, and it builds trust when things go wrong.
A good status page:
- Shows each customer-facing component, such as the API, website, and dashboard, with its current state.
- Opens and resolves incidents automatically from your checks, so it's accurate even when nobody updates it.
- Lets you post manual updates with the cause and expected recovery.
- Shows uptime history so customers can judge reliability over time.
- Runs on your own domain, such as
status.example.com.
The most common failure is a status page that says "All systems operational" during an outage because someone forgot to update it. Driving it from the same checks that page your on-call team removes that risk. For a deeper look, see what a status page is and how to run one.
API monitoring best practices
These practices separate a monitoring setup that catches real problems from one that just produces noise.
- Monitor what users depend on. Prioritise login, search, checkout, payments, and public APIs over internal or rarely used endpoints.
- Assert on content, not just status. Every API check should have a body assertion and a latency assertion as well as a status code.
- Use dedicated health endpoints that touch the database and key dependencies, and keep them fast and free of side effects.
- Run from where your users are, with at least two locations per check, and add private locations for internal services.
- Alert on consecutive failures with a cooldown, and route critical checks to on-call and everything else to a channel.
- Match frequency to your uptime target. If your SLO allows 4 minutes a month, a 5-minute check can't protect it.
- Watch certificate expiry on every public domain with a 30-day warning.
- Track p95 latency, not averages. The average hides the slow tail that users actually feel.
- Treat flaky checks as bugs. A high retry rate means the endpoint or the check needs fixing, not a higher retry count.
- Keep checks next to your telemetry. The faster you can go from a failed check to the logs and traces behind it, the lower your MTTR.
Common API monitoring mistakes to avoid
- Only checking the home page. The marketing site can be up while the API that powers your product is down.
- Status-code-only checks. A
200with{"error":"database unavailable"}in the body is still an outage. - A single probe location. You can't tell a regional network problem from a real outage, so you either page too often or stop trusting the alerts.
- Alerting on the first failure. One dropped packet wakes someone up at 3 a.m., and after a few weeks nobody trusts the pager.
- Forgetting certificates. Certificate expiry is completely predictable, yet it still takes services down when nobody is watching the date.
- Monitoring in a silo. The uptime tool says "down", and the next half hour goes to switching between tools to find out why.
Standalone uptime tools vs a unified observability platform
You can run uptime checks in a standalone tool or inside your observability platform. The checks themselves look similar. The difference is what happens after a check fails.
| Standalone uptime tool | Unified observability platform | |
|---|---|---|
| Check types | HTTP, TCP, TLS, sometimes browser | HTTP, TCP, TLS, SSH, and browser |
| Status pages | Included or a separate product | Driven by the same checks |
| Alert routing | Its own destinations and rules | Shares destinations with every other alert |
| Root cause | Switch to separate log, trace, and metric tools | Logs, traces, and metrics in the same platform and time range |
| Reliability targets | Uptime percentage per check | SLOs with error budgets and burn rates alongside other SLIs |
| Extra tools for on-call to learn | One more | None |
An uptime alert tells you that something broke. It doesn't tell you why. When checks live in the same platform as your telemetry, the failing check, the error logs from the service behind it, and the slow trace that caused the timeout are one query away, in the same time range. That's where most of the time to resolution goes, and it's the main reason to run uptime monitoring inside your observability platform rather than beside it. Our MTTR guide breaks down where that time is spent.
What to look for in API and website monitoring tools
When you evaluate website monitoring tools and API monitors, check for:
- Check coverage: HTTP with full assertions, TCP, TLS, SSH, and browser journeys in one place.
- Flexible scheduling: 1-minute checks, custom intervals, and cron schedules.
- Locations: public probes in the regions your users are in, plus private locations for internal services.
- Noise control: consecutive-failure thresholds, retries, and cooldowns.
- Diagnostics: timing breakdowns, per-location results, and failure evidence, not just up or down.
- Status pages: automatic incidents, manual updates, uptime history, and custom domains.
- Correlation: logs, metrics, and traces in the same tool, so a failure leads straight to its cause.
- Pricing that scales with your team: no per-user fees for the people who need to see the results.
OpenObserve covers every item on that list in one platform. The rest of this guide shows how to set it up.
How to set up API and uptime monitoring in OpenObserve
OpenObserve Synthetics runs scheduled checks from global and private locations, records every run, and keeps the evidence needed to explain failures. It's available on OpenObserve Cloud and self-hosted deployments, in both the Open Source and Enterprise editions; private locations, alert notifications, and custom domains for status pages need Enterprise or Cloud.
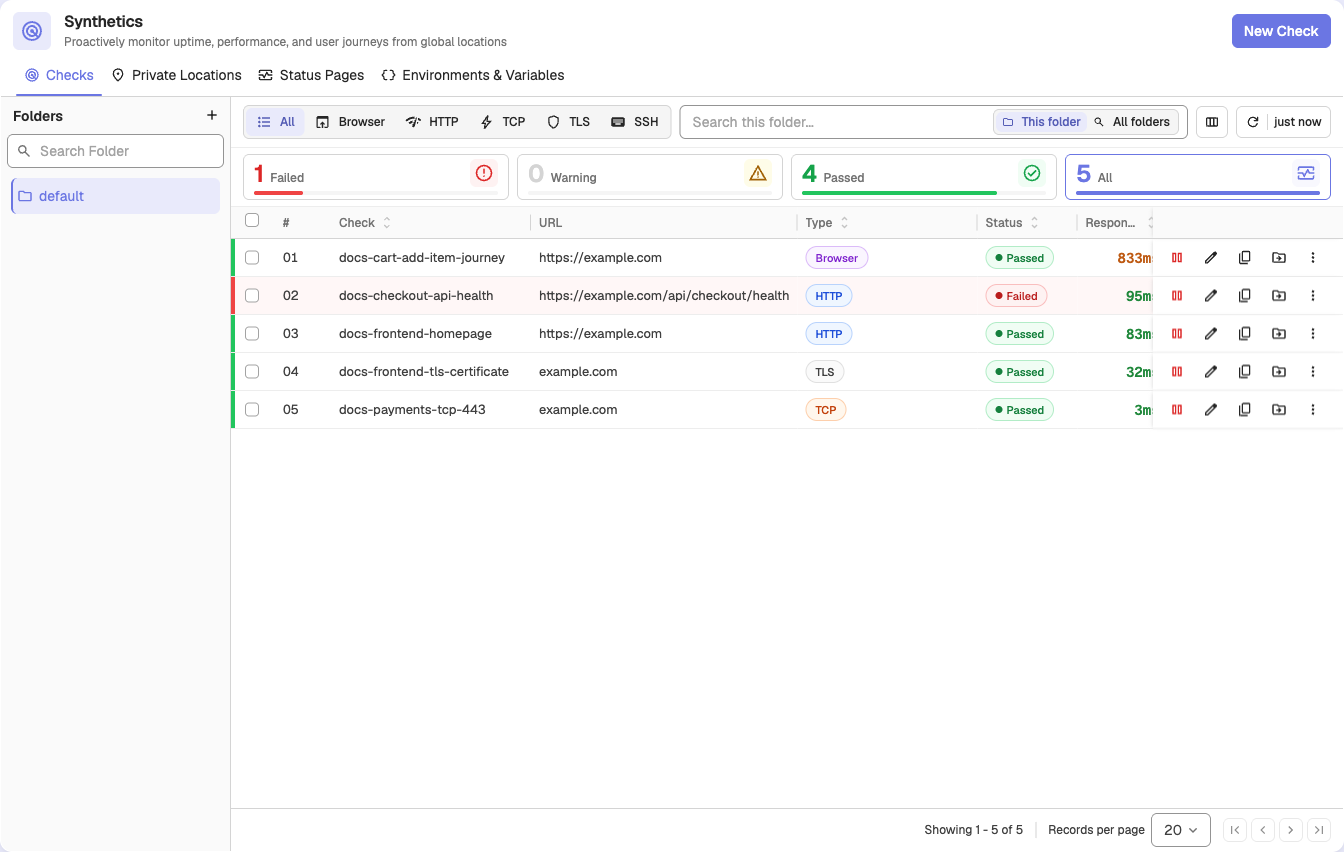
To open it, select Experience > Synthetics in the left sidebar. The Checks tab lists every check with its type, status, and a health summary:
Step 1: Create an HTTP / API check
Click New Check and pick a type:
| Check type | Verifies |
|---|---|
| HTTP / API | Endpoints, status codes, and response bodies |
| TCP Port | A host and port are reachable |
| SSL / TLS Certificate | Certificate validity and expiry |
| SSH | SSH connectivity to a server |
| Browser Test | A multi-step user journey in a real browser |
For an HTTP / API check, set the URL, method, headers, and body. The default timeout is 10000 ms, and redirects are followed by default. Then add assertions on Status code, Response body, or Response time (ms) with operators such as equals, contains, and less than. If the request never returns, the check fails rather than passing on unevaluated assertions.
For a TLS check, Alert when expiring within (days) defaults to 30, and certificate chain and hostname verification are on by default. The protocol checks docs cover every type.
Step 2: Set the schedule, retries, and locations
- Frequency: presets of 1 minute, 5 minutes, 15 minutes, 30 minutes, and 1 hour, defaulting to 5 minutes, or a custom interval or cron expression.
- Retries: up to 3 extra attempts for protocol checks before a run is called failed, with a configurable wait between attempts.
- Locations: on OpenObserve Cloud, twelve public AWS regions:
| Area | Regions |
|---|---|
| North America | N. Virginia, Ohio, N. California, Oregon, Montreal |
| Europe | Frankfurt, London, Paris, Stockholm |
| Asia Pacific | Mumbai, Singapore, Sydney |
Private locations run checks from agents inside your own network; agents for protocol checks run on Docker, Kubernetes, Linux, or Windows. Deploy several agents with the same location name and they share the work, so losing one host doesn't stop your checks.
Step 3: Configure alerts
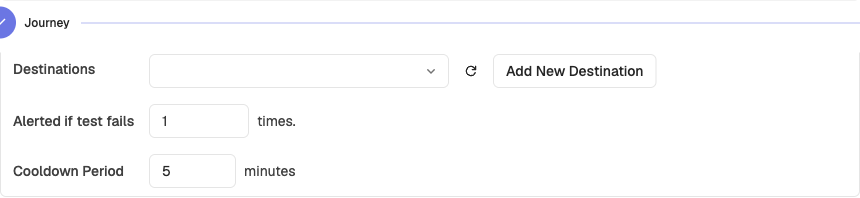
Set Alerted if test fails to the number of consecutive failures that should notify you, add a Cooldown period (5 minutes by default), and choose Destinations. Destinations are shared with the rest of OpenObserve alerting, so checks notify the same channels your other alerts use.
All options are in the Synthetics configuration docs.
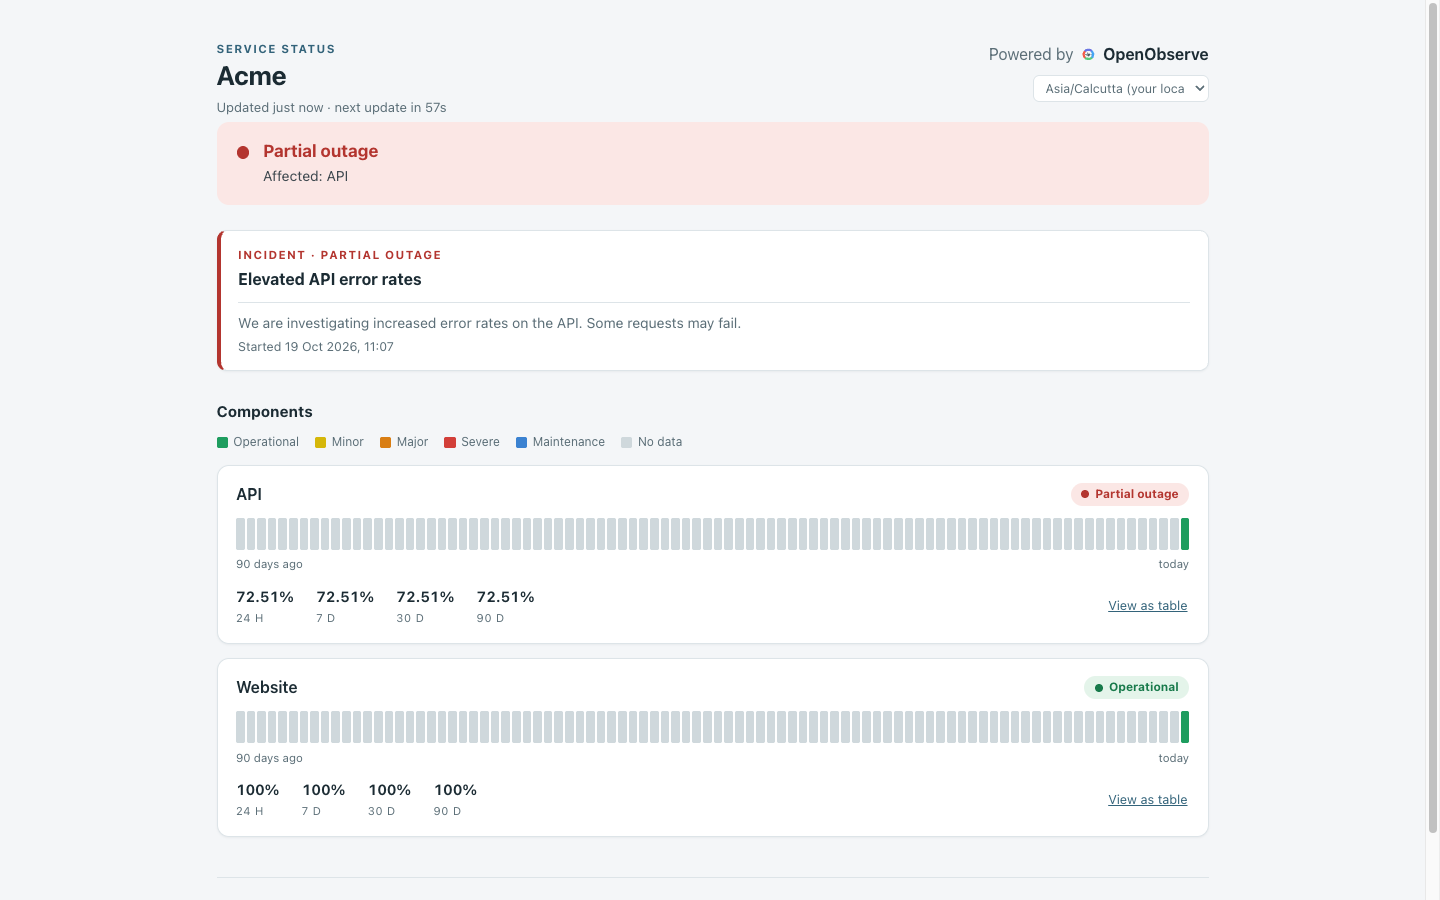
Step 4: Publish a status page
Open the Status Pages tab, create a page, and map each component (such as API or Website) to one or more checks. OpenObserve then manages incidents for you:
- An incident opens after Confirm failures consecutive failures and resolves after Confirm recovery consecutive passes (both default to 2).
- A check that fails again within 10 minutes reopens the same incident, so a flapping check stays one incident.
- Only incidents of partial outage or worse count as downtime, and overlapping incidents are never counted twice.
Pages can be public or password-protected and show each component's uptime for the last 24 hours, 7 days, 30 days, and 90 days. Enterprise and Cloud add manual updates and custom domains. Each page also exposes a JSON snapshot, an SVG status badge, and an Atom feed. See the status pages docs.
Step 5: Read results and investigate failures
Click any check to open its results. The Overview tab shows a status timeline, pass rate, P95 duration, retry rate, warning and failed runs, response time and errors over time, and pass rate and duration by location:
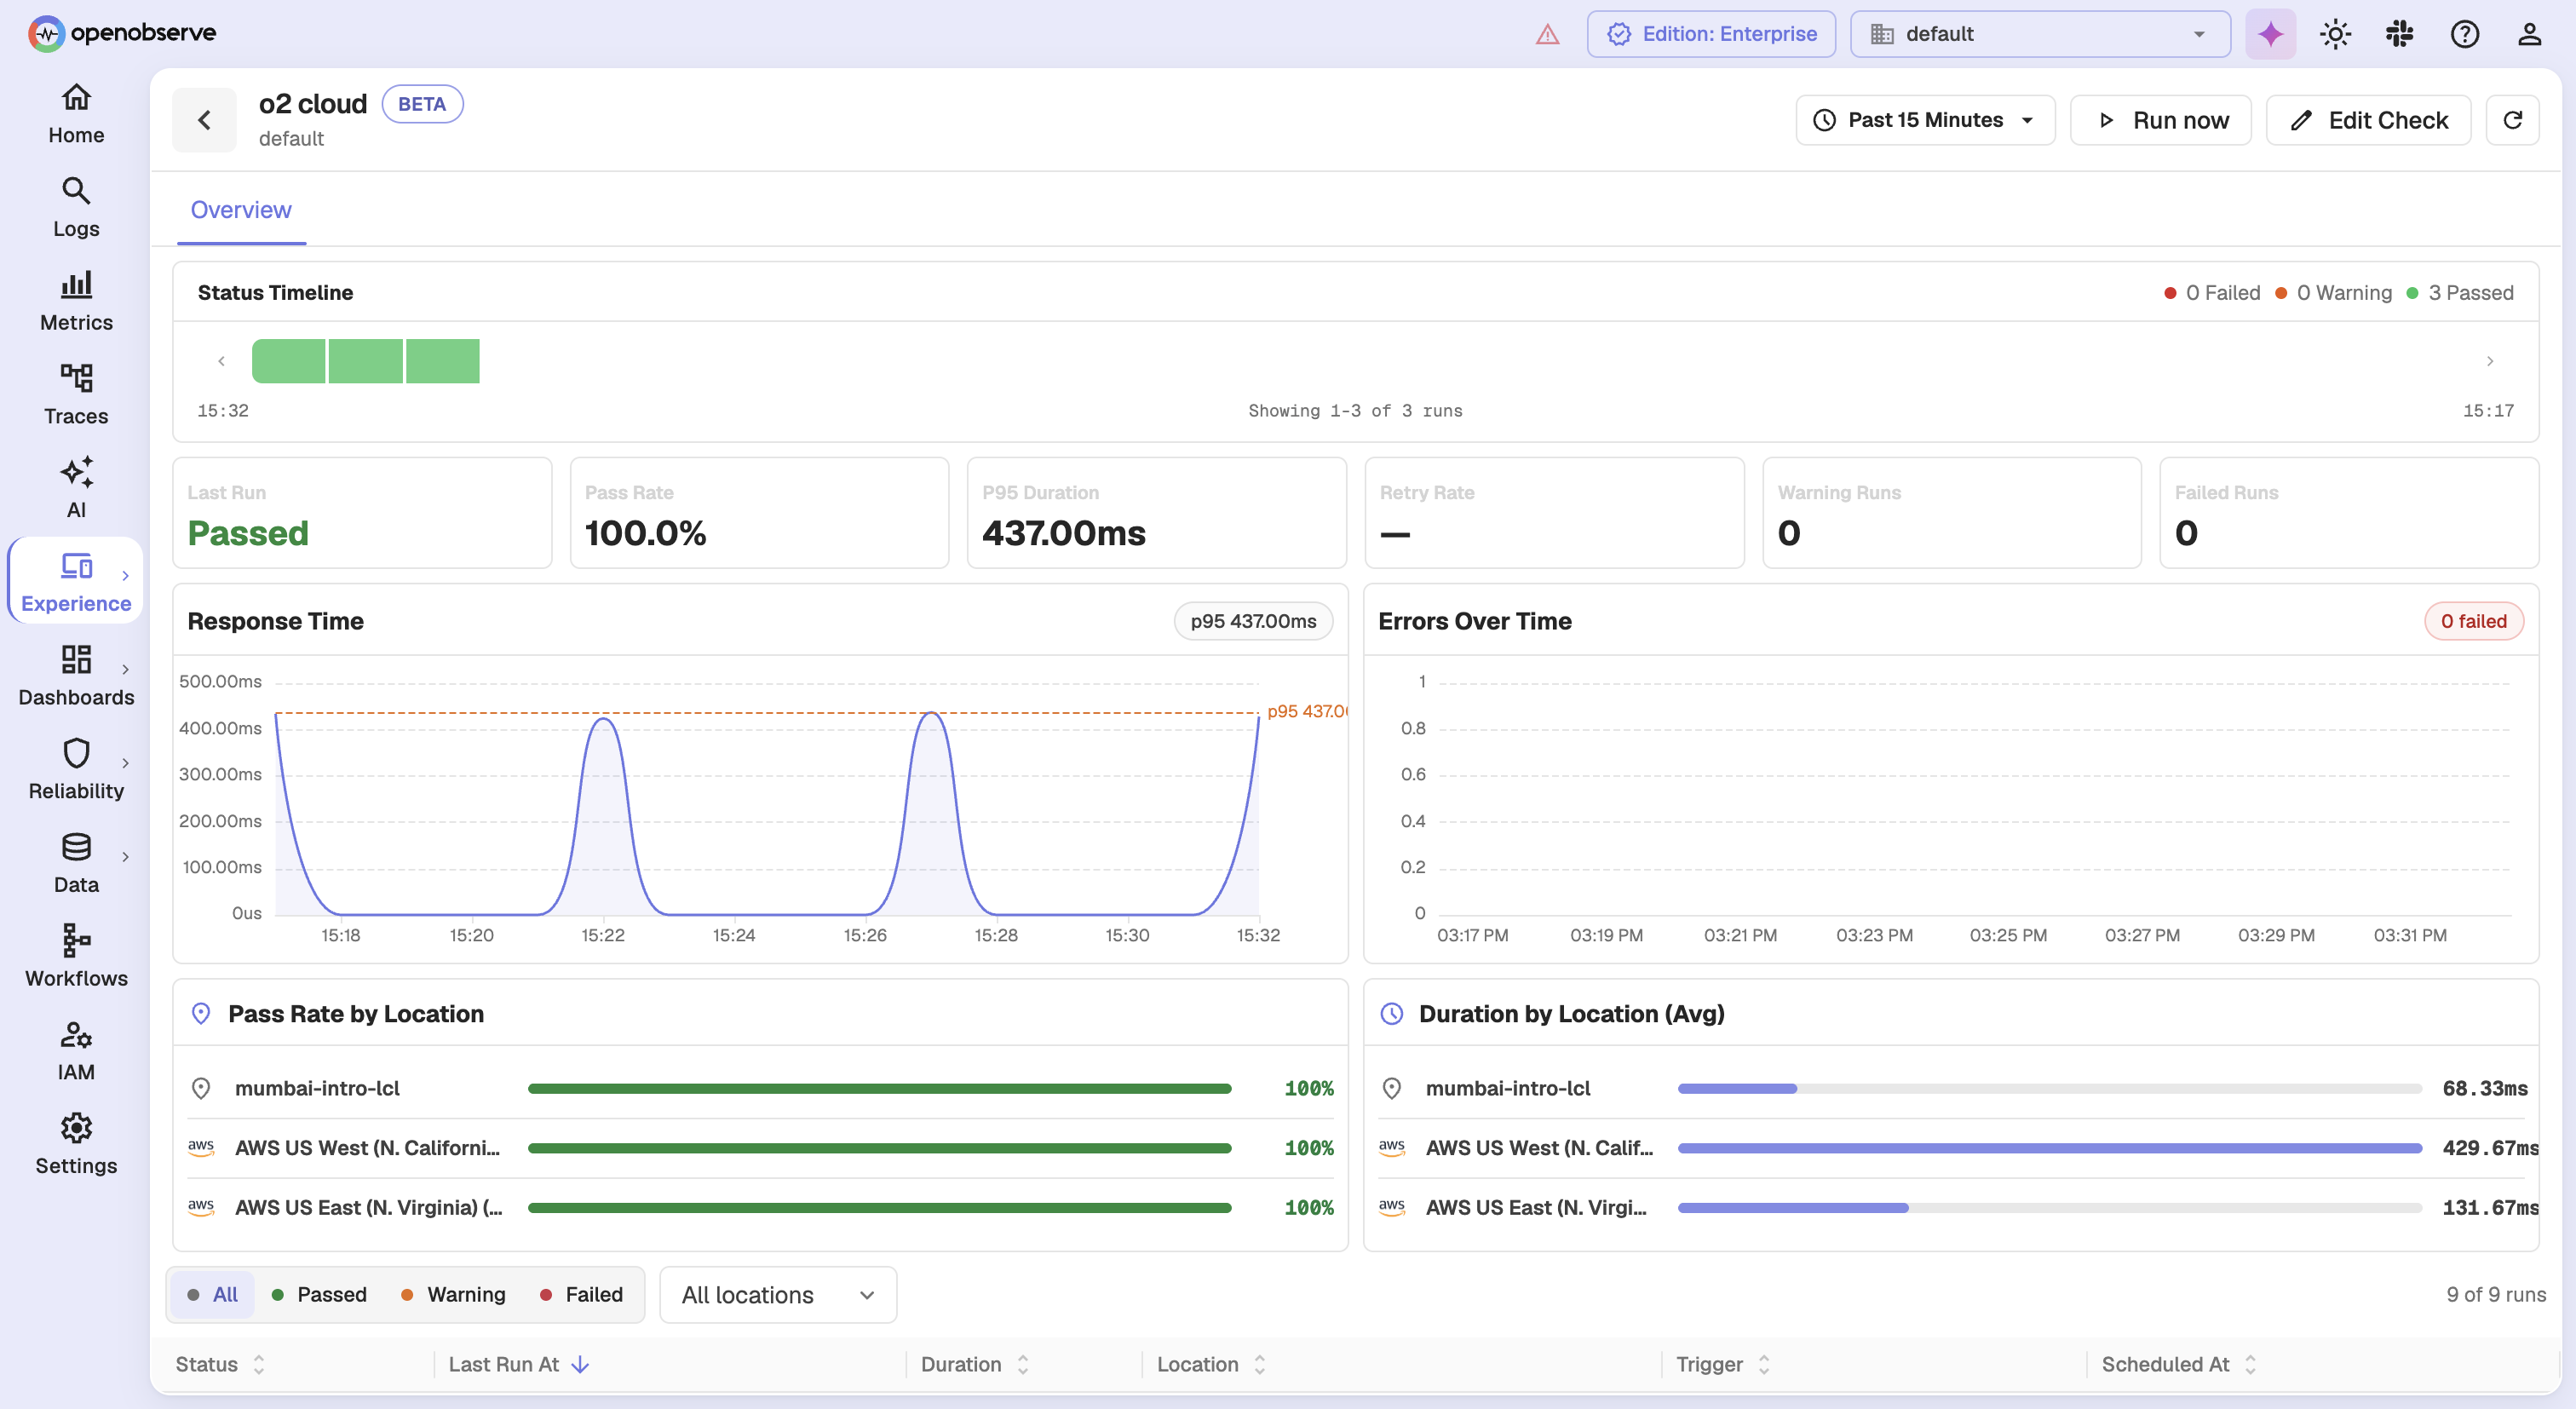
Error patterns groups failures by normalized error message across locations, so you can tell one widespread failure from several unrelated ones. Open a single run for its timing breakdown and assertion results, as shown earlier. From there, search the logs and traces of the service behind the endpoint in the same OpenObserve instance, over the same time range. For API access logs specifically, see our guide to monitoring API access logs.
Step 6: Track uptime as an SLO
Uptime is an SLO waiting to be written down. OpenObserve SLOs support time-slice SLIs, where each period is scored good or bad, which is the shape most people mean by uptime. The docs give availability from a probe, such as the success rate of synthetic checks in each five-minute window above 99%, as an example. Add error budgets and burn-rate alerts on top, and your team gets warned while there's still budget left to protect. See the time-slice SLO docs.
Example: a failed API check, from alert to root cause
Here is how a typical failure plays out when checks and telemetry live together:
- At 02:14, the
checkout-apihealth check fails from Frankfurt, N. Virginia, and Singapore on two consecutive runs. The alert reaches on-call, and the status page opens an incident on the API component. - The run detail shows DNS, connect, and TLS times as normal, but TTFB far above usual and a failed
response time less than 500 msassertion. The problem is inside the application, not the network. - Error patterns shows the same timeout message from every location, so it's one failure, not several.
- On-call searches the checkout service's logs for the same minutes and finds connection pool timeouts, then opens a slow trace that shows the database call where the time went.
- The fix ships, the check passes twice in a row, and the status page incident resolves on its own.
Every step happens in the same tool, on the same time range, without copying timestamps between products.
Everything else in OpenObserve
OpenObserve is an open-source (AGPL-3.0) observability platform, so your checks sit next to the rest of your telemetry:
- Telemetry: logs, metrics, and traces with a service graph and service catalog, plus continuous profiles.
- Frontend monitoring: real user monitoring (RUM), session replay, and error tracking.
- Synthetic monitoring: scheduled browser and protocol checks with status pages.
- AI: AI Assistant, SRE Agent for AI root cause analysis, an MCP server, LLM observability and evaluations, anomaly detection, log patterns, and insights.
- Alerting and reliability: scheduled, real-time, composite, and anomaly alerts, incident management, and SLOs with error budgets and burn rates.
- Dashboards and reports: real-time dashboards and scheduled PDF, PNG, or CSV reports.
- Data processing: pipelines, VRL functions, enrichment tables, and metrics downsampling.
- Storage and cost: Parquet on object storage, Bring Your Own Bucket on Cloud, extended retention, and ingest-based pricing with unlimited users.
- Security and governance: SSO, RBAC, multi-tenancy, sensitive data redaction, audit trail, cipher keys, and federated search.
- Compliance: SOC 2 Type II, ISO 27001, and GDPR via the EU-Central 1 (Frankfurt) region.
- Open standards: OpenTelemetry-native ingestion, PromQL and SQL querying, and open source under AGPL-3.0.
Get started with OpenObserve
- Sign up for OpenObserve Cloud with a 14-day free trial and create your first HTTP / API check in a few minutes.
- Read the Synthetics overview in the docs.
- Prefer to run it yourself? Follow the self-hosted quickstart, then the Synthetics self-hosted setup.
- See how alerts become incidents with AI root cause analysis in AI incident management.
Frequently Asked Questions
About the Author
Simran Kumari

Passionate about observability, AI systems, and cloud-native tools. All in on DevOps and improving the developer experience.
Follow OpenObserve on Google
Add OpenObserve as a preferred source to see more of our articles in Google Search and Top Stories.