Logging Best Practices: 15 Rules for Application Logging




Ready to get started?
Try OpenObserve Cloud today for more efficient and performant observability.
Logging best practices are the rules that make application logs useful during an incident: write structured logs, use log levels consistently, attach a trace ID to every line, keep secrets out, and send everything to one place with a retention policy. This guide covers 15 rules with examples in Python, Node.js, Go, and Java.
TL;DR
- Structure every log line as JSON with consistent field names, so you can filter and aggregate instead of grepping.
- Put a trace ID on every log so you can move from a slow trace to the exact lines it wrote.
- Never log secrets or unnecessary personal data, and redact at ingestion as a safety net.
- Control volume with levels, sampling, and per-stream retention so logs stay affordable as traffic grows.
- Centralize logs in a platform like OpenObserve to search them with SQL, alert on patterns, and correlate them with metrics and traces.
What is application logging?
Application logging is the practice of recording events from inside your code, such as requests handled, errors raised, jobs started, and decisions made, as timestamped records that you can search later. Unlike infrastructure logs, which come from the operating system, web server, or cloud provider, application logs carry the business context only your code knows: which customer, which order, which feature flag.
Good application logging answers three questions during an incident: what happened, to whom, and why. The 15 rules below are grouped by what they protect: usefulness, correlation, safety, and cost.
Logging best practices for useful logs
1. Use structured JSON logging
Write each log record as a JSON object with named fields instead of a formatted sentence. Structured logs can be filtered (status = 500), grouped (COUNT(*) BY endpoint), and alerted on without fragile regular expressions. Our structured logging field guide goes deep on field design.
Python with structlog:.
import structlog

structlog.configure(
    processors=[
        structlog.processors.add_log_level,
        structlog.processors.TimeStamper(fmt="iso"),
        structlog.processors.JSONRenderer(),
    ]
)
log = structlog.get_logger()
log.info("order_placed", order_id="ord_123", amount_cents=4999, user_id="u_42")
Node.js with pino:.
const pino = require("pino");
const logger = pino();

logger.info({ orderId: "ord_123", amountCents: 4999, userId: "u_42" }, "order placed");
Go with the standard library's log/slog:.
logger := slog.New(slog.NewJSONHandler(os.Stdout, nil))
logger.Info("order placed", "order_id", "ord_123", "amount_cents", 4999, "user_id", "u_42")
Java with SLF4J, Logback, and the Logstash encoder:.
import static net.logstash.logback.argument.StructuredArguments.kv;

log.info("order placed {} {}", kv("order_id", orderId), kv("amount_cents", amountCents));
2. Use consistent field names across services
Agree on names once: user_id, not userId in one service and uid in another. The OpenTelemetry semantic conventions (http.request.method, http.response.status_code, service.name) are a ready-made standard. Consistent names mean one query works across every service.
3. Use log levels deliberately
| Level. | Use it for. | Production default. |
|---|---|---|
| DEBUG. | Detailed diagnostic data for developers. | Off. |
| INFO. | Normal, meaningful events (request handled, job finished). | On. |
| WARN. | Something unexpected that the system recovered from. | On. |
| ERROR. | A failed operation that needs attention. | On. |
| FATAL. | The process cannot continue. | On. |
An ERROR should mean someone may need to act. If your ERROR logs fire thousands of times a day for expected conditions, nobody reads them. See log levels explained for examples of each.
4. Write actionable log messages with context
A good message says what happened and includes the values needed to act: payment declined with order_id, gateway, and decline_code, not error occurred. Keep the message text constant and put variable data in fields, so the same event always groups together.
5. Log meaningful events instead of every line of code
Log at boundaries: incoming requests, outgoing calls, state changes, and failures. Logging inside tight loops or on every function entry multiplies volume without adding information.
6. Use UTC timestamps in ISO 8601
Record time in UTC with millisecond or better precision, in ISO 8601 format (2026-11-20T09:14:03.512Z). Mixed time zones make cross-service timelines wrong exactly when you need them most.
Logging best practices for correlation
7. Add trace IDs to correlate logs with traces
A trace ID ties every log line from one request together across services. With OpenTelemetry, your logging library can inject the active trace and span IDs automatically. In Python, the OpenTelemetry logging instrumentation adds them to standard library log records:.
from opentelemetry.instrumentation.logging import LoggingInstrumentor

LoggingInstrumentor().instrument(set_logging_format=True)
Once logs carry trace_id, a backend such as OpenObserve lets you open a slow span and see the exact log lines it produced. Our OpenTelemetry logging guide for .NET shows the same idea in C#.
8. Add service and environment metadata to every log
Every record should say where it came from: service.name, service.version, deployment.environment, and, on Kubernetes, the namespace and pod. Set these once as OpenTelemetry resource attributes or collector enrichment rather than in every log call.
9. Log the outcome and duration of external calls
For each database query, HTTP call, or queue publish that fails or is slow, log the target, duration, and result. These are the lines that explain cascading failures.
Logging best practices for security
10. Never log secrets or unnecessary personal data
Passwords, API keys, tokens, session cookies, card numbers, and full request bodies don't belong in logs. Logs are copied to backups, exports, and third-party tools, so anything you log should be safe to share with everyone who can read them.
11. Redact sensitive data at log ingestion
Code reviews miss things, so add a second layer. In OpenObserve, a pipeline function written in VRL can mask values before they are stored:.
.message = replace(string!(.message), r'[\w.+-]+@[\w-]+\.[\w.]+', "[REDACTED_EMAIL]")
del(.authorization)
OpenObserve also offers regex-based sensitive data redaction that redacts, hashes, or drops matches at ingestion or query time. For a walkthrough, read sensitive data redaction in OpenObserve.
12. Restrict log access with role-based access control
Logs from payment, auth, and admin services deserve tighter access than debug output. Use role-based access control in your log platform, and keep an audit trail of who searched what.
Logging best practices for cost and operations
13. Log to stdout in containers and rotate log files on VMs
On Kubernetes and Docker, write logs to stdout and stderr and let a collector such as Fluent Bit or the OpenTelemetry Collector ship them. On virtual machines, rotate log files so they never fill the disk:.
/var/log/myapp/*.log {
    daily
    rotate 7
    compress
    missingok
    notifempty
}
14. Sample or drop noisy logs to control logging costs
Health checks, successful high-volume requests, and verbose debug output can dominate log volume. Drop health-check logs in the pipeline, sample successful requests (keep 1 in 100, for example), and always keep errors. Track ingestion volume per service so a noisy deploy doesn't quietly double your bill.
15. Centralize logs and set log retention per stream
Send every service's logs to one platform, and keep retention aligned with value: a short window for debug-heavy streams, longer for audit and security logs. Platforms that store logs on object storage make longer retention practical. Our log management guide covers retention rules in depth.
What are the most common application logging mistakes?
Most logging problems come from a handful of habits that are easy to spot in code review:.
- Logging and rethrowing. Catching an exception, logging it, and rethrowing it means the same error is logged at every layer. Log it once, where it is handled.
- String concatenation in messages.
"user " + id + " failed"produces a different message for every user, so nothing groups and every value is unsearchable. Use fields. - Logging whole objects. Serializing a full request, ORM entity, or HTTP response is the fastest way to leak personal data and inflate volume. Log the few fields that matter.
- Swallowing errors silently. An empty
catchblock hides the root cause of the next incident. At minimum, log at WARN with the error type. - DEBUG left on in production. A forgotten debug flag can multiply log volume many times over within minutes of a deploy.
- Different formats per service. One team logs JSON, another logs plain text, and a third logs key-value pairs, so no single query works across the system.
- No owner for log volume. If nobody watches ingestion per service, cost drifts upward until someone cuts retention in a panic.
Fixing these in a pull request template or linting rule prevents more incidents than any dashboard does.
Logging best practices checklist
| #. | Practice. | Quick check. |
|---|---|---|
| 1. | Structured logging. | Every line parses as JSON. |
| 2. | Consistent field names. | One query works across services. |
| 3. | Deliberate log levels. | ERROR means someone may need to act. |
| 4. | Actionable messages. | Constant message, variable data in fields. |
| 5. | Log events, not lines. | No logging inside hot loops. |
| 6. | UTC ISO 8601 timestamps. | No local time zones. |
| 7. | Trace and request IDs. | trace_id on every line. |
| 8. | Service context. | service.name and environment present. |
| 9. | External call outcomes. | Failures include target and duration. |
| 10. | No secrets. | Secret scanning on log output. |
| 11. | Ingestion redaction. | Pipeline rule masks emails and tokens. |
| 12. | Access control. | RBAC on sensitive streams. |
| 13. | stdout or rotated files. | No unbounded log files. |
| 14. | Sampling and drops. | Health checks filtered. |
| 15. | Central platform and retention. | Per-stream retention set. |
How do you put these practices to work in OpenObserve?
OpenObserve is an open-source (AGPL-3.0) observability platform that stores logs, metrics, and traces as Parquet on object storage, with approximately 140x lower storage costs in typical log workloads compared to Elasticsearch-based stacks; actual results vary based on data entropy and cardinality. Here is how it supports the rules above:.
- Structured search: query JSON fields with SQL and full-text search in the logs explorer.
- Trace correlation: logs that carry
trace_idlink to the trace view, and traces link back to their logs. - Redaction and filtering: pipelines with VRL drop health checks, sample noise, and mask sensitive fields before storage.
- Retention: per-stream retention plus extended retention for incident time ranges.
- Access control: SSO, RBAC, multi-tenant organizations, and an audit trail.
- Pattern detection: log patterns group millions of lines into templates, so a new error shape stands out.
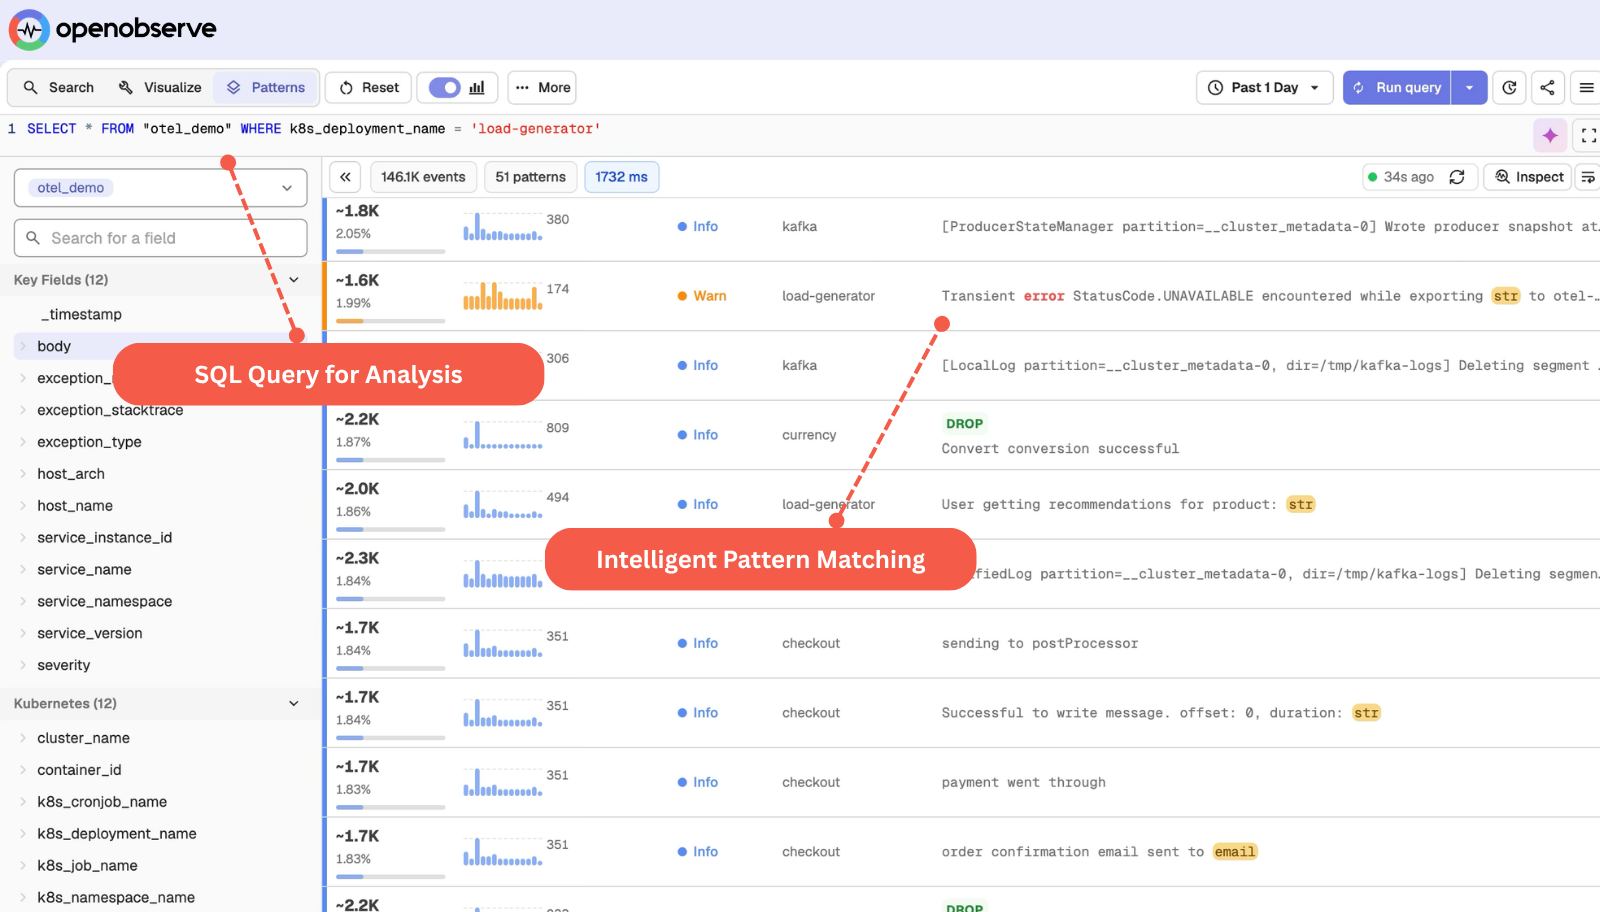
A query like this finds the noisiest error messages per service in the last hour, which is often the fastest way to see whether your levels and messages are working:.
SELECT service_name, message, COUNT(*) AS occurrences
FROM "app_logs"
WHERE level = 'error'
GROUP BY service_name, message
ORDER BY occurrences DESC
LIMIT 20
Beyond logs, OpenObserve covers:.
- Telemetry: metrics with PromQL and SQL, traces with a service graph and service catalog, and continuous profiling.
- Frontend: RUM, session replay, and error tracking.
- Synthetic monitoring: browser tests and HTTP, TCP, TLS, and SSH checks.
- AI: the AI Assistant, the SRE Agent with AI root cause analysis, an MCP server, LLM observability and evaluations, anomaly detection, log patterns, and insights.
- Alerting and reliability: scheduled, real-time, composite, and anomaly alerts; incident management; SLOs with burn-rate alerts.
- Dashboards and reports, including scheduled PDF, PNG, or CSV reports.
- Data processing: pipelines, VRL functions, enrichment tables, and downsampling.
- Storage and cost: object storage, bring your own bucket, extended retention, and ingest-based pricing with no per-host or per-user fees.
- Security and governance: SSO, RBAC, multi-tenancy, sensitive data redaction, audit trail, cipher keys, and federated search.
- Compliance: SOC 2 Type II, ISO 27001, and GDPR via the EU region.
Get started with OpenObserve
Start a 14-day free trial on OpenObserve Cloud, or run OpenObserve self-hosted. Ship one service's structured logs with Fluent Bit or the OpenTelemetry Collector, then run the noisy-errors query above to see where your logging needs work first. For JSON-specific patterns, see our JSON logging guide.
Frequently Asked Questions
About the Author
Simran Kumari

Passionate about observability, AI systems, and cloud-native tools. All in on DevOps and improving the developer experience.
Follow OpenObserve on Google
Add OpenObserve as a preferred source to see more of our articles in Google Search and Top Stories.