Instrumenting CrewAI Multi-Agent Workflows with OpenTelemetry




Ready to get started?
Try OpenObserve Cloud today for more efficient and performant observability.
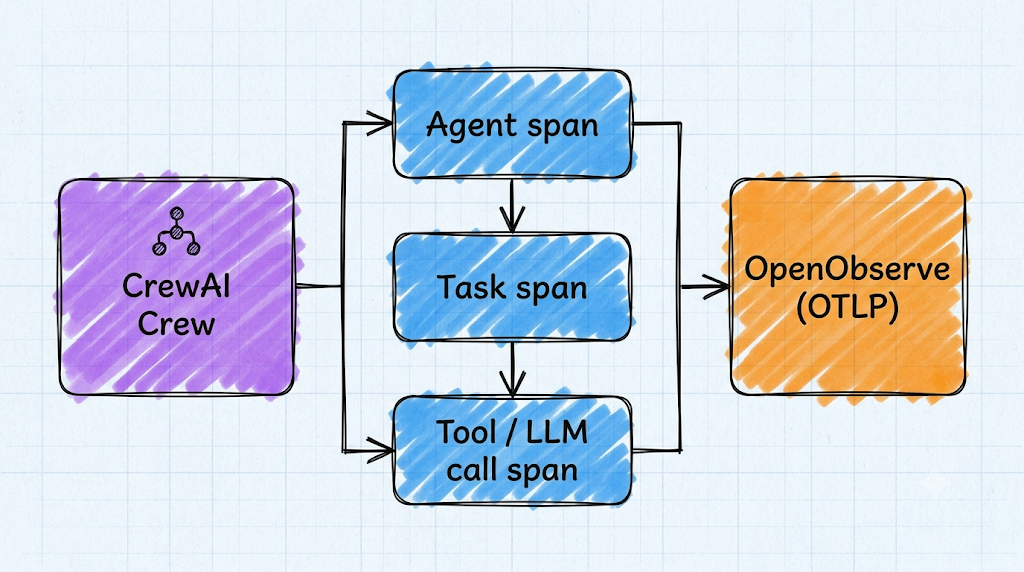
TL;DR
A CrewAI crew is a genuinely multi-agent system: several agents, each with a role and a goal, work through a set of tasks and can delegate to each other along the way. That's exactly the shape of workload a single log line or a duration number can't explain. When a crew is slow or wrong, you need to know which agent, which task, and which model call.
The short version:
- CrewAI's built-in telemetry isn't your observability. It's anonymous usage data CrewAI collects about its own product, sent to CrewAI's backend, not a trace store you can query.
- Instrument separately. Install OpenInference's
openinference-instrumentation-crewaiplus your model provider's instrumentor, build a standard OpenTelemetryTracerProvider, and export over OTLP. No changes to your crew's code. - Get the whole hierarchy as one trace. Crew, agent, task, tool call, and LLM call all show up as nested spans in a single trace, sequential or hierarchical process alike, including dynamic delegation.
- Disable the right thing. Use
CREWAI_DISABLE_TELEMETRY=trueto turn off CrewAI's own telemetry. Don't useOTEL_SDK_DISABLED=trueunless you want to silence your own tracing too. - Cost and latency fall out of the same traces. Once spans carry
gen_ai.usage.*tokens, per-agent and per-task cost is a query against those fields, not a separate meter.
Why a crew is harder to observe than a single agent
A single LLM call has one shape: request in, response out. An agent adds a loop around that: think, maybe call a tool, think again, respond. A CrewAI crew adds a third layer on top of that: multiple agents, each with its own role, goal, and backstory, working through a list of tasks, where one task's output can feed the next, and an agent with allow_delegation=True can hand work to a teammate mid-task instead of finishing it alone.
That means a single crew.kickoff() call can fan out into work that doesn't follow a straight line:
- A researcher agent runs a task, calls a search tool twice, and produces a summary.
- A writer agent picks up that summary as
contextfor its own task and drafts an article. - The writer isn't confident about a claim, delegates a fact-check back to the researcher mid-task, waits for the answer, and finishes.
- In a
Process.hierarchicalcrew, none of that assignment is fixed in advance: a manager agent decides at runtime which agent handles which task, and can re-delegate if the first attempt isn't good enough.
None of that structure is visible from crew.kickoff()'s return value or from application logs. You get the final output and a wall-clock duration. You don't get which agent's task took most of that time, whether the writer's delegation to the researcher looped more than once, or which of the four model calls in that run actually burned the tokens. That's the same problem monitoring AI agents in production describes for single agents, one layer deeper: the unit you need to observe isn't the call, or even the agent, it's the crew.
CrewAI's telemetry is not your observability
CrewAI ships built-in telemetry, and it's worth being precise about what that is before you build anything, because the name invites the wrong assumption. CrewAI's telemetry is anonymous usage data about how the framework is used, collected for CrewAI's own product analytics, sent to CrewAI's own backend. It uses OpenTelemetry under the hood to do that collection. What it is not is a trace store you can query, a dashboard you can open, or a mechanism for seeing your own crew's execution. Enabling or disabling it changes nothing about whether you can see your own agents' behavior.
That distinction matters practically because of how you turn it off. CrewAI exposes two environment variables that look interchangeable and are not:
# Turns off only CrewAI's own anonymous telemetry
CREWAI_DISABLE_TELEMETRY=true

# Turns off the OpenTelemetry SDK globally, for every instrumentor in the process
OTEL_SDK_DISABLED=true
If your goal is "stop CrewAI from phoning home, but keep my own tracing," CREWAI_DISABLE_TELEMETRY=true is the one you want. OTEL_SDK_DISABLED=true is a bigger hammer: it disables OpenTelemetry for the whole process, which means the instrumentation you're about to add in this guide stops exporting too. Reach for it only if you genuinely want no OpenTelemetry activity at all, CrewAI's or yours.
How a crew maps to spans
Before wiring up an exporter, it helps to know what the instrumentation actually produces, because everything downstream is a read of this span tree.
crew (root span)
├── agent: researcher
│   └── task: research_task
│       ├── tool: web_search
│       └── llm: gen_ai.chat (gpt-4o-mini)
├── agent: writer
│   └── task: write_task
│       ├── llm: gen_ai.chat (gpt-4o-mini)         ← first draft
│       ├── delegation → agent: researcher          ← mid-task delegation
│       │   └── llm: gen_ai.chat (gpt-4o-mini)      ← fact-check
│       └── llm: gen_ai.chat (gpt-4o-mini)         ← final draft
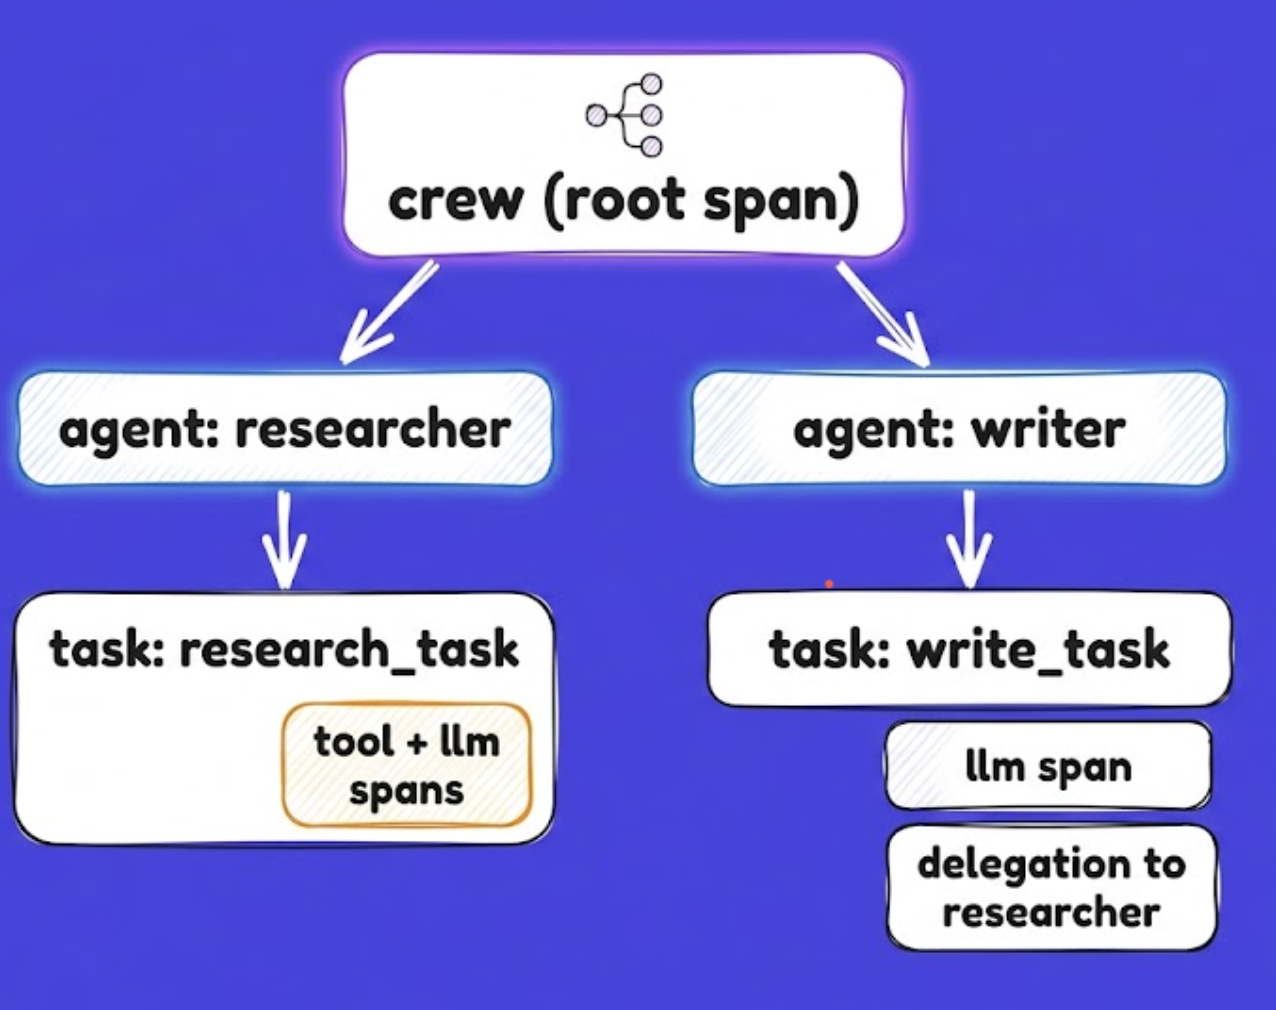
Every node in that tree is a span with timing, and the LLM spans carry the standard gen_ai.* attributes: gen_ai.request.model, gen_ai.usage.input_tokens, gen_ai.usage.output_tokens, and the finish reason. The delegation from writer to researcher shows up as its own span, so you can tell a run where the writer delegated once from a run where it looped three times, something the final output alone won't tell you.
Prerequisites
- An OpenObserve instance: OpenObserve Cloud (14-day free trial, no credit card) or a self-hosted install (single binary, AGPL, free).
- Your OpenObserve OTLP endpoint and ingestion token, from Data Sources → OpenTelemetry Collector in the UI.
- Python 3.10+ and an existing CrewAI project (
pip install crewai crewai-tools). - API access to whichever model provider your agents call (OpenAI, Anthropic, or another CrewAI-supported LLM).
Step 1: Install the instrumentation
CrewAI doesn't need a CrewAI-specific SDK on the OpenObserve side. You install a standard OpenTelemetry auto-instrumentor for CrewAI plus the instrumentor for whichever model provider your agents call:
pip install opentelemetry-sdk \
    opentelemetry-exporter-otlp-proto-http \
    openinference-instrumentation-crewai \
    openinference-instrumentation-openai
Swap openinference-instrumentation-openai for the instrumentor matching your provider (Anthropic, Bedrock, and others each have their own OpenInference package) if your agents don't call OpenAI. OpenLLMetry's opentelemetry-instrumentation-crewai package is a drop-in alternative that produces equivalent OTLP output if you'd rather standardize on OpenLLMetry across your stack.
Step 2: Initialize the SDK and point it at OpenObserve
Set this up once, before you build any Crew, Agent, or Task objects:
from opentelemetry.sdk.trace import TracerProvider
from opentelemetry.sdk.trace.export import BatchSpanProcessor
from opentelemetry.exporter.otlp.proto.http.trace_exporter import OTLPSpanExporter
from openinference.instrumentation.crewai import CrewAIInstrumentor
from openinference.instrumentation.openai import OpenAIInstrumentor

exporter = OTLPSpanExporter(
    endpoint="<your-openobserve-otlp-endpoint>",
    headers={
        "Authorization": "Basic <base64(email:password)>",
        "stream-name": "default",
    },
)

provider = TracerProvider()
provider.add_span_processor(BatchSpanProcessor(exporter))

CrewAIInstrumentor().instrument(tracer_provider=provider)
OpenAIInstrumentor().instrument(tracer_provider=provider)
Self-hosted OpenObserve (port 5080):
OTEL_EXPORTER_OTLP_ENDPOINT=http://localhost:5080/api/default/v1/traces
OTEL_EXPORTER_OTLP_HEADERS=Authorization=Basic <base64_token>,stream-name=default
OpenObserve Cloud:
OTEL_EXPORTER_OTLP_ENDPOINT=https://api.openobserve.ai/api/<your_org>/v1/traces
OTEL_EXPORTER_OTLP_HEADERS=Authorization=Basic <base64_token>,stream-name=default
Also set CREWAI_DISABLE_TELEMETRY=true here if you don't want CrewAI's own anonymous telemetry running alongside your instrumentation, they're independent and both can be on or off without affecting the other.
Where this goes in an existing app: if you already have a CrewAI project, this setup block is the only thing you're adding. Drop it at the top of your entry-point file (main.py, or wherever crew.kickoff() is called), above where your own Agent, Task, and Crew objects get built. Nothing about your existing agents, tasks, or crew definitions changes, instrument() patches the CrewAI and model-provider libraries in place, so any crew you already have starts emitting spans the moment it runs.
What you get in OpenObserve
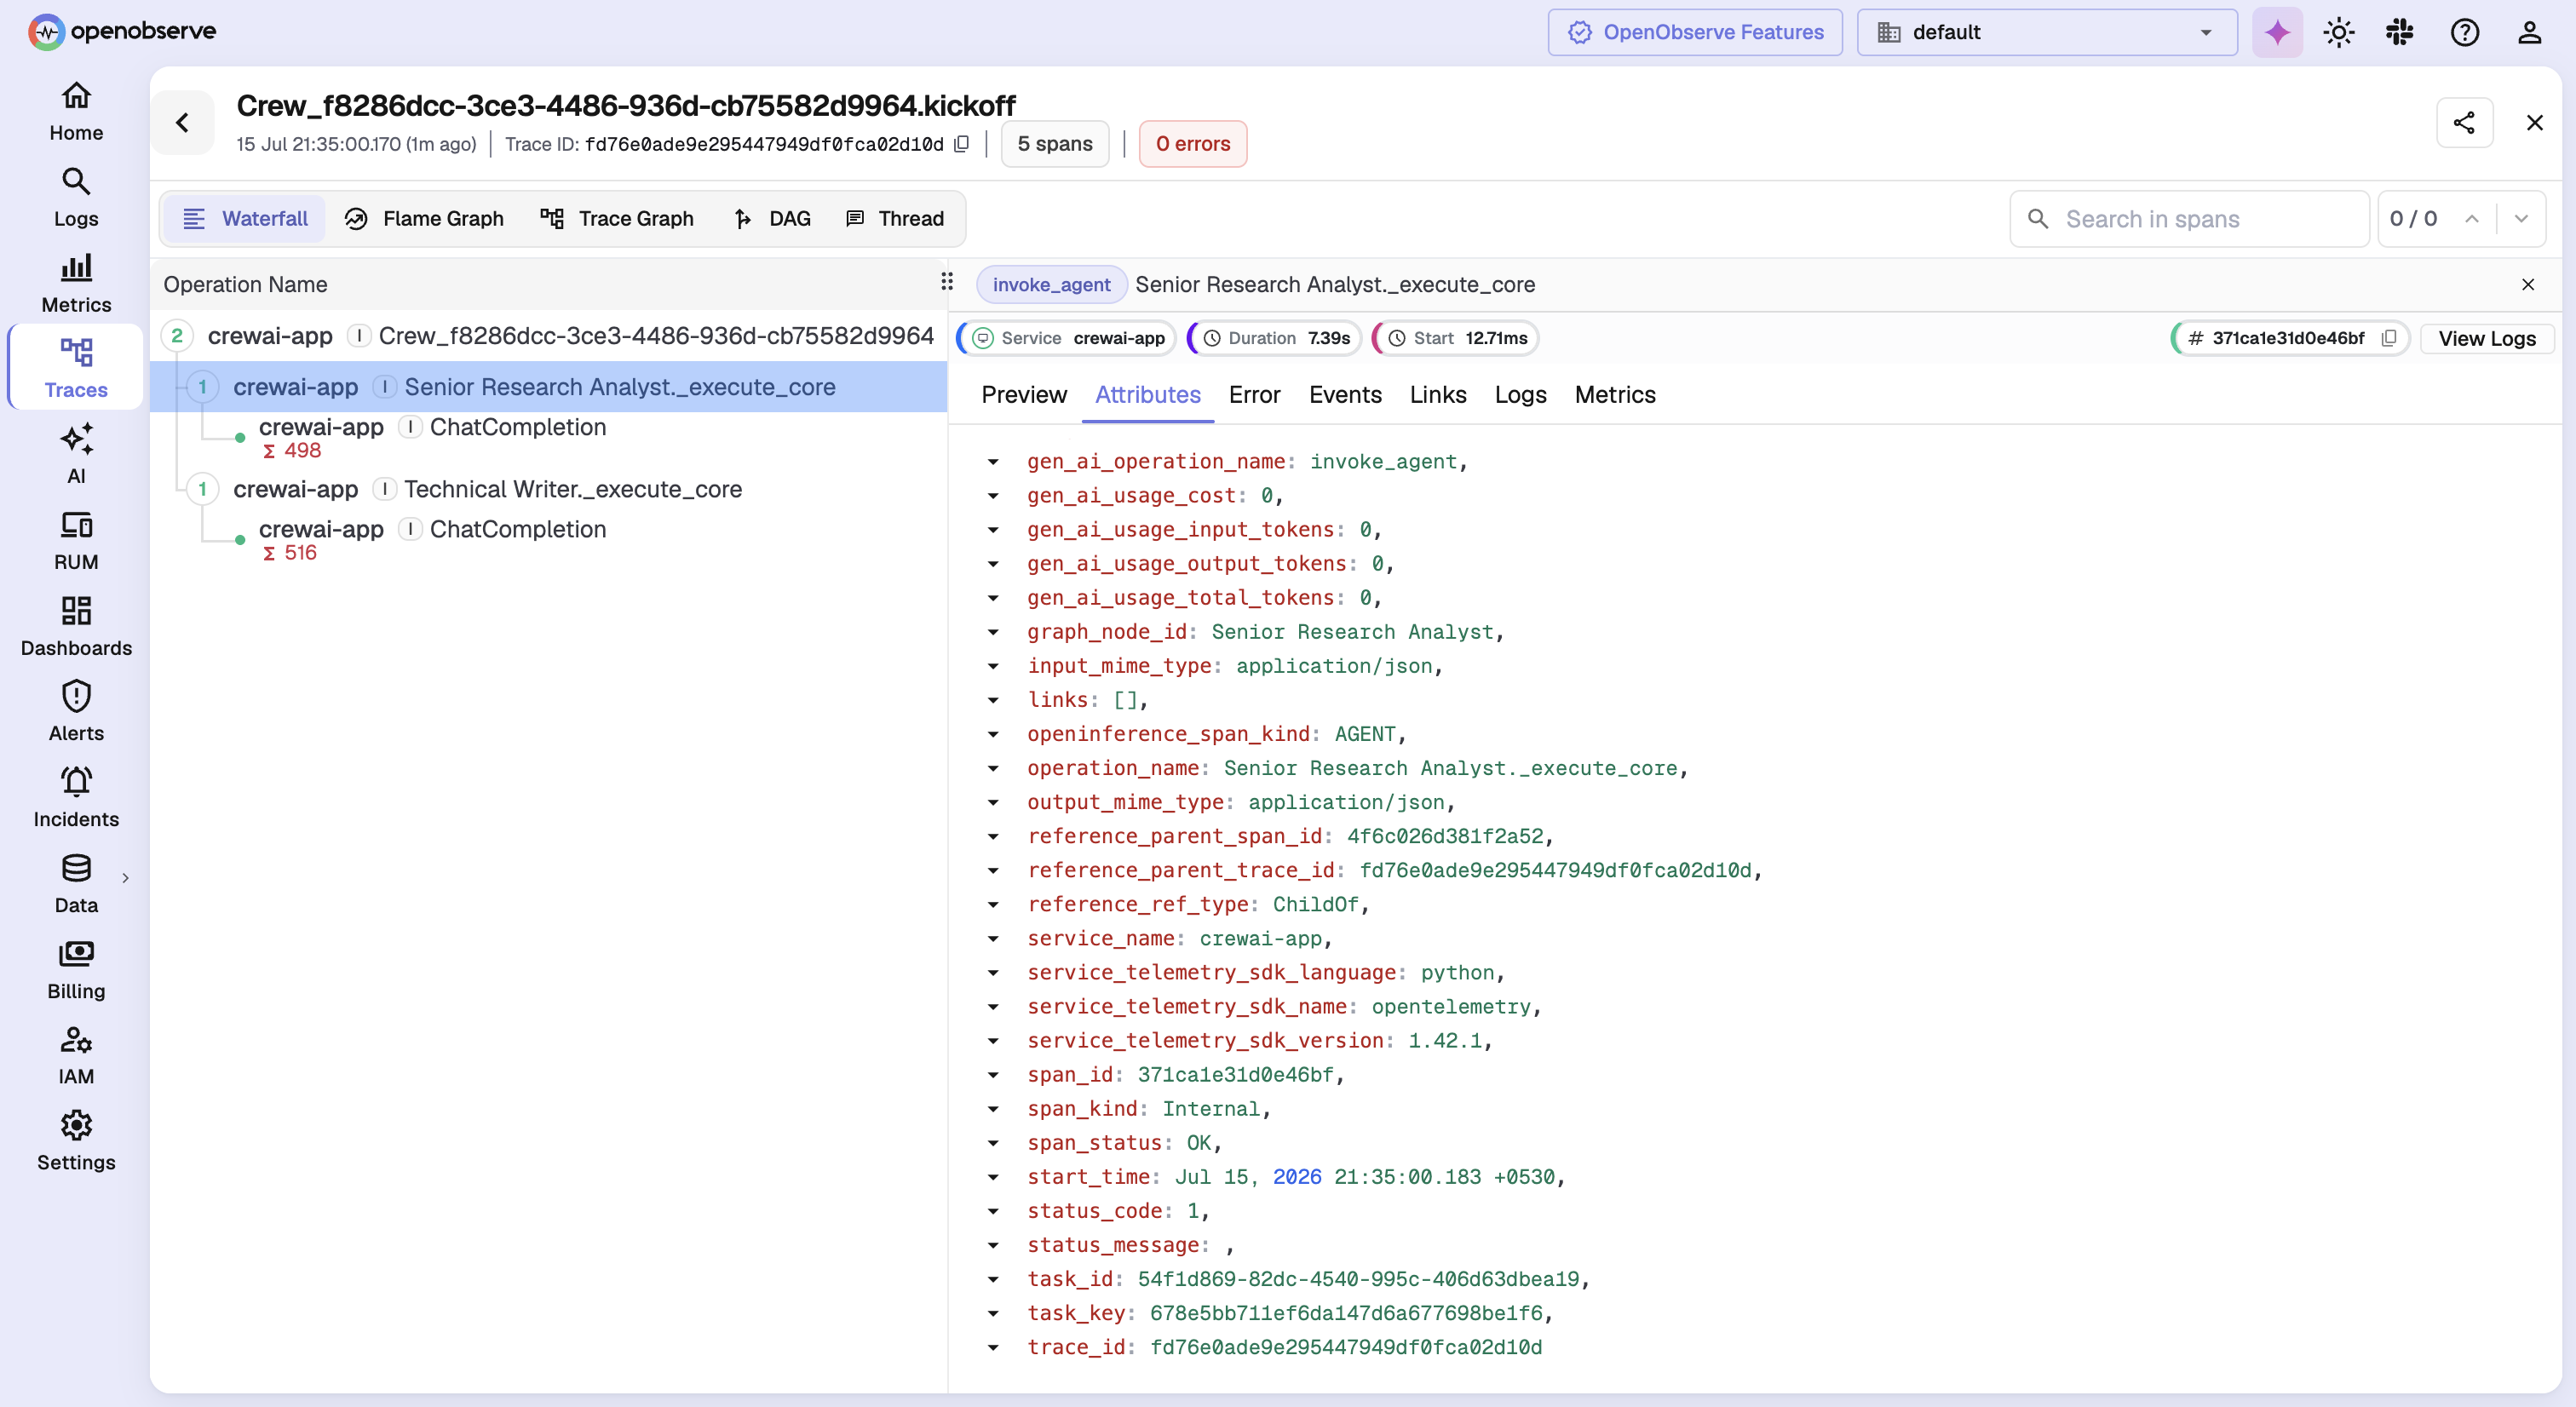
The waterfall shows exactly what the ASCII tree above described, but with real timings: width is duration, indentation is the parent-child relationship. A wide task span with a narrow LLM span inside it means the agent spent most of its time on tool calls, not model reasoning. A task span with three nested LLM spans instead of one is a sign the agent (or, in a hierarchical crew, the manager) looped.
Keeping backstories and outputs out of your traces
Agent backstories are static and usually harmless, but task descriptions, tool results, and LLM outputs can carry real data, customer names in a support crew, financial figures in an analysis crew. By default, instrumentation captures that content as span attributes because it's what makes a trace useful for debugging a wrong answer.
If you're using the OpenLLMetry-based package, disable content capture with:
TRACELOOP_TRACE_CONTENT=false
For OpenInference's instrumentor, or for finer-grained control (redact specific fields rather than dropping content wholesale), route traces through an OpenObserve ingestion pipeline and redact matched patterns server-side before the trace is stored, the same approach covered in redacting PII from LLM telemetry. That keeps the span structure, agent names, task boundaries, timings, token counts, intact for debugging while the sensitive values never land in storage.
Try it: a sequential crew, instrumented
Steps 1 and 2 above are all the setup you need, instrumentation is on regardless of what your crew looks like. The two crews below are optional, runnable toy examples, not further setup: a two-agent, two-task crew you can paste in and run as-is to see a trace land in OpenObserve. No changes to the crew itself, just the setup from Steps 1 and 2 running first:
from crewai import Agent, Task, Crew, Process

researcher = Agent(
    role="Researcher",
    goal="Find accurate, current information on the given topic",
    backstory="A meticulous analyst who cross-checks every claim.",
    verbose=True,
)

writer = Agent(
    role="Writer",
    goal="Turn research into a clear, well-structured article",
    backstory="A writer who values clarity over cleverness.",
    allow_delegation=True,
    verbose=True,
)

research_task = Task(
    description="Research the current state of {topic} and summarize the key facts.",
    expected_output="A bullet-point summary of the key facts, with sources.",
    agent=researcher,
)

write_task = Task(
    description="Write a short article on {topic} using the research provided.",
    expected_output="A 400-word article.",
    agent=writer,
    context=[research_task],
)

crew = Crew(
    agents=[researcher, writer],
    tasks=[research_task, write_task],
    process=Process.sequential,
    verbose=True,
)

result = crew.kickoff(inputs={"topic": "vector database indexing"})
Because allow_delegation=True is set on the writer, if it isn't confident in a claim while drafting, it can hand a question back to the researcher mid-task even inside this sequential process. That delegation is exactly the kind of step that's invisible in result but shows up as its own span in the trace.
Try it: a hierarchical crew, and why delegation needs tracing most
Same researcher and writer agents and tasks from the sequential example above, run again with a different process so you can compare the two traces. Process.sequential runs tasks in the order you listed them. Process.hierarchical is different: a manager decides which agent handles each task at runtime, and can re-delegate.
from crewai import Agent, Task, Crew, Process

manager = Agent(
    role="Editor",
    goal="Ensure the final article is accurate and well-written",
    backstory="A senior editor who assigns work and reviews output.",
    verbose=True,
)

crew = Crew(
    agents=[researcher, writer],
    tasks=[research_task, write_task],
    process=Process.hierarchical,
    manager_agent=manager,
    verbose=True,
)

result = crew.kickoff(inputs={"topic": "vector database indexing"})
This is the case where tracing earns its keep the most. With a fixed sequential crew, you can mostly guess the execution order from the code. With a hierarchical crew, you can't: the manager's assignment decisions happen at runtime, driven by an LLM call you didn't write the logic for. The trace is the only record of which agent actually ran which task, whether the manager reassigned anything, and how many extra LLM calls the manager's own reasoning added on top of the work itself.
Try OpenObserve Cloud
A CrewAI crew is already a small distributed system: agents, tasks, delegation, tool calls, and model calls, and any of them can be where a slow or wrong run actually comes from. OpenTelemetry instrumentation turns that into a single readable trace instead of a final output and a stopwatch, and because OpenObserve ingests those spans over plain OTLP next to your infrastructure logs, metrics, and traces, a crew's cost or latency spike sits in the same backend as whatever else your system is doing at the time. Start free with OpenObserve Cloud and send your first crew trace in minutes.
- Try OpenObserve Cloud: 14-day free trial, no credit card required
- Read how to monitor AI agents in production: the single-agent version of this same tracing model
Frequently Asked Questions
About the Author
Simran Kumari

Passionate about observability, AI systems, and cloud-native tools. All in on DevOps and improving the developer experience.
Follow OpenObserve on Google
Add OpenObserve as a preferred source to see more of our articles in Google Search and Top Stories.












