Kubernetes Troubleshooting: Why Incidents Still Take Too Long to Resolve




Ready to get started?
Try OpenObserve Cloud today for more efficient and performant observability.
Kubernetes Troubleshooting: Why Incidents Still Take Too Long to Resolve
Your monitoring says everything is healthy. Your users disagree.
If you've ever spent thirty minutes chasing a Kubernetes incident only to discover the root cause wasn't where the alert pointed, you're not alone.
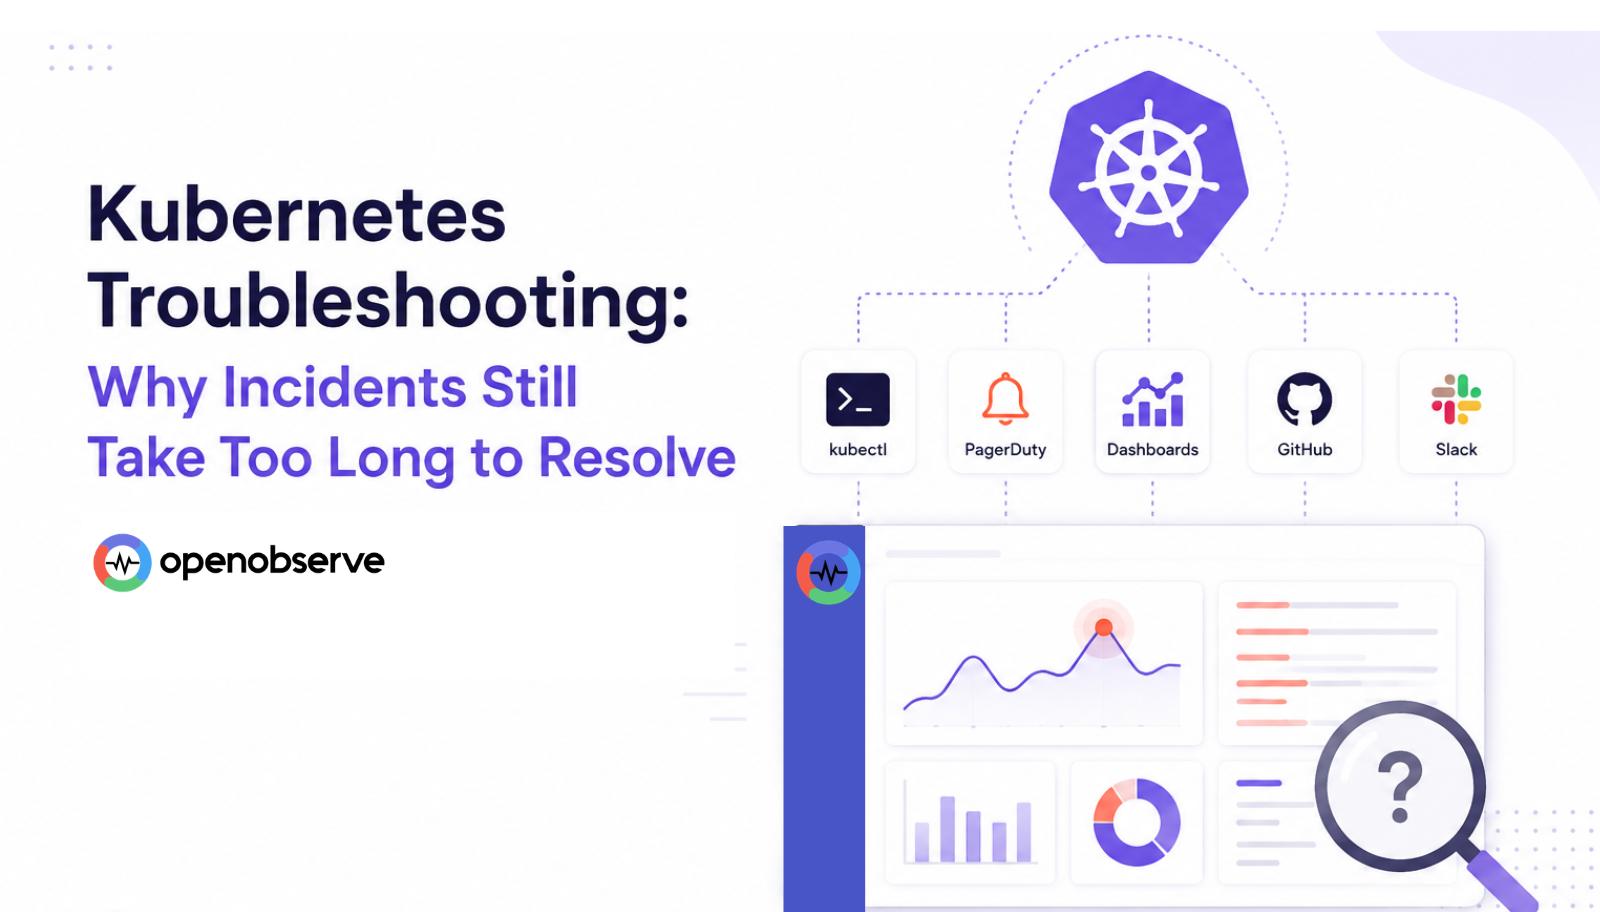
Modern Kubernetes environments generate more telemetry than ever before, yet when an incident occurs, engineers still spend valuable time moving between PagerDuty, dashboards, kubectl, GitHub, and Slack before the root cause becomes clear.
During a recent panel discussion featuring experienced engineers from Mastercard, WRITER, and OpenObserve, one observation came up repeatedly during the discussion:
"Most teams don't really have a data problem. They have a correlation problem."
The two production incidents explored in this article illustrate why. One started with an ImagePullBackOff error. The other with a P99 latency alert. Neither investigation ended where it started, and both offer practical lessons for reducing the time from alert to root cause.
ImagePullBackOff was only the symptom
The first incident began with what appeared to be a routine deployment failure. A developer reported that a test deployment had completed successfully in CI, but the application never started inside the Kubernetes cluster. Instead, the pod entered an ImagePullBackOff state.
The engineer did exactly what most of us would do. They verified the pull request, confirmed the CI pipeline had published the image, checked that the expected tag existed in the registry, and compared it against the deployment manifest. Every verification succeeded. The deployment configuration appeared correct, and nothing suggested the container image itself was missing or invalid.
Because the container never started, application logs provided no useful information. Instead, the investigation shifted toward Kubernetes Events, which revealed repeated registry timeout errors. Kubernetes wasn't rejecting the image. It simply couldn't reach the registry.
That explained the immediate failure, but not its underlying cause.
The breakthrough came only after expanding the investigation beyond the cluster itself. The organization had migrated its container registry the previous evening from a standalone virtual machine to Kubernetes. Years earlier, every cluster had been configured with a hardcoded registry IP address instead of resolving the registry through DNS. That decision had gone unnoticed because the registry infrastructure had remained unchanged for years. Once the migration occurred, every cluster continued attempting to contact an IP address that no longer existed.
Technically, Kubernetes behaved exactly as expected. The deployment manifest was correct, the container image existed, and the application itself contained no defects. The failure resulted from an infrastructure dependency that had silently existed for years and only surfaced when another team changed the environment.
Perhaps the most important lesson from this incident is that the root cause wasn't contained within Kubernetes. The engineer investigating the deployment didn't initially know that the registry migration had occurred because it had been performed by another team. Discovering the root cause required combining Kubernetes Events with organizational context and recent infrastructure changes rather than simply collecting more telemetry.
Why ImagePullBackOff is not a root cause
ImagePullBackOff is one of the most common Kubernetes errors, but it should be treated as the beginning of an investigation rather than its conclusion.
The status only indicates that Kubernetes cannot retrieve a container image. The underlying reason could be a missing image, an incorrect tag, authentication failures, DNS issues, network connectivity problems, registry outages, or infrastructure changes elsewhere in the environment.
This distinction matters because it changes how incidents are investigated.
Rather than asking only, "Why can't Kubernetes pull the image?", engineers should also ask, "What changed recently?" Recent deployments, infrastructure migrations, networking updates, DNS changes, or platform maintenance may all be relevant, even if the application itself hasn't changed.
In this particular incident, Kubernetes Events proved far more valuable than application logs because the application never had an opportunity to start. The Events pointed the investigation toward registry connectivity, and that ultimately led to the operational change that explained the failure.
Healthy Kubernetes doesn't always mean healthy applications
The second incident challenged another common assumption. Just because Kubernetes reports that everything is running doesn't mean the application is healthy.
The investigation started with an SLO alert after the P99 latency of a critical API suddenly increased and began consuming the service's error budget. The initial assumption was that something had gone wrong within the application itself, so the engineer followed the standard troubleshooting process. The pods were running normally, CPU and memory utilization looked healthy, application logs contained no obvious errors, and the dashboards showed nothing unusual. Database queries, cache behavior, and downstream dependencies were also reviewed, but none of them explained why users were suddenly experiencing higher latency.
After nearly twenty minutes investigating the service, the engineer deliberately changed perspective and started looking at the Kubernetes cluster instead.
That decision uncovered the root cause.
One of the nodes hosting the API was almost completely saturated. A batch workload had recently been scheduled onto the same node and was consuming most of the available CPU. The application pods weren't crashing, restarting, or reporting errors. They were simply waiting for CPU time. Looking at CPU throttling metrics confirmed that the API containers were being throttled, causing requests to queue and increasing response times.
Once the batch workload was moved to a dedicated node pool, CPU became available again, latency returned to normal, and the alert cleared.
The application had never been the problem.
What both incidents reveal about Kubernetes troubleshooting
At first glance, the two production incidents seemed unrelated.
The first began with an ImagePullBackOff error that ultimately traced back to a container registry migration and hardcoded IP addresses outside the Kubernetes cluster.
The second started with a P99 latency alert but was eventually traced to CPU contention caused by a batch workload sharing the same node as a latency-sensitive API.
Different symptoms. Different root causes.
The investigation, however, followed the same pattern.
In both cases, the first signal pointed engineers toward the symptom rather than the underlying cause. Finding the answer required expanding the investigation beyond the initial alert and correlating information across applications, Kubernetes, infrastructure, deployment history, and operational context.
As one panelist observed, the signal telling you that something is wrong and the signal explaining why it is wrong often live in different places.
Modern Kubernetes platforms already generate an enormous amount of telemetry. Logs, metrics, traces, Kubernetes Events, deployment history, and infrastructure changes all provide valuable clues during an incident. The difficulty isn't collecting more data. It's understanding how those signals relate to one another while the incident is unfolding.
Two correlation techniques help explain why these investigations eventually reached the correct root cause.
The first is temporal correlation, which means examining all relevant signals from the same time window instead of reviewing logs, metrics, traces, and Kubernetes Events independently.
The second is dimensional correlation, which connects telemetry through shared context such as a service, namespace, cluster, deployment, or node. Rather than investigating each signal in isolation, engineers follow those relationships to understand how changes in one layer of the platform affect another.
Both production incidents demonstrated why this matters.
In the first investigation, Kubernetes Events pointed toward a registry connectivity problem, but the root cause was an infrastructure change made the previous evening.
In the second, service-level dashboards looked healthy while node-level CPU metrics revealed the resource contention responsible for the application's latency.
Neither investigation required more telemetry.
Both required connecting the telemetry that already existed.
Practical ways to reduce Kubernetes troubleshooting time
The two production incidents highlight a broader reality. Faster incident response rarely comes from collecting more telemetry. It comes from improving the way teams investigate failures. Several practices consistently help reduce the time from alert to root cause.
Build runbooks that evolve with production
Runbooks should reflect how engineers actually troubleshoot production systems, not document an ideal process that is never revisited. Every production incident uncovers new failure modes, operational knowledge, and investigation techniques. Updating runbooks after incidents ensures the next engineer starts with better context instead of repeating the same investigation.
Practice failure before production does it for you
Controlled failure exercises expose gaps that rarely appear during normal operation. Testing alerts, ownership, escalation paths, and recovery procedures in lower environments helps teams build confidence before a real incident occurs. Whether it's a simple game day or a full chaos engineering exercise, practicing failures produces better incident response than reading documentation.
Make alerts the beginning of an investigation
An alert shouldn't simply tell an engineer that something is wrong. It should provide enough context to begin answering why. Including the affected service, namespace, owning team, links to dashboards, and relevant runbooks can eliminate valuable minutes during an incident. Prioritizing alerts tied to user impact, such as SLO-based alerts, also helps reduce alert fatigue and keeps engineers focused on what matters most.
Design observability around failure modes
Developers understand how their applications fail. SREs understand how those failures appear in production. Building logs, metrics, traces, dashboards, and alerts around known failure modes creates far more useful observability than treating it as something added after an application is deployed. The best incident response starts long before the first alert fires.
Kubernetes troubleshooting is increasingly a correlation problem
Kubernetes already produces an enormous amount of telemetry. The challenge is rarely collecting another metric or building another dashboard. It's connecting the information that already exists.
The two incidents reached very different root causes, but they followed the same investigation pattern. Engineers had to move beyond the first alert, correlate signals across applications, Kubernetes, and infrastructure, and combine technical evidence with operational context before the problem became clear.
Reducing Mean Time to Resolution (MTTR) isn't just about improving visibility. It's about reducing the time it takes to connect logs, metrics, traces, Kubernetes Events, and recent changes into a single explanation that engineers can act on.
For many Kubernetes teams, that is the difference between spending thirty minutes searching for root cause and spending five minutes resolving the incident.
Frequently Asked Questions
About the Author
Manas Sharma


Manas is a passionate Dev and Cloud Advocate with a strong focus on cloud-native technologies, including observability, cloud, kubernetes, and opensource. building bridges between tech and community.
Follow OpenObserve on Google
Add OpenObserve as a preferred source to see more of our articles in Google Search and Top Stories.













