How to Migrate from Helicone to OpenObserve




Ready to get started?
Try OpenObserve Cloud today for more efficient and performant observability.
TL;DR
Mintlify acquired Helicone on March 3, 2026, and put it into maintenance mode: roadmap frozen, no new features, new signups closed. It isn't shut down, existing customers keep running, but that's the trigger behind most Helicone-to-OpenObserve migrations right now, not a feature complaint. On top of that timing, the migration itself is a genuine architecture swap, not a config change. Helicone is a proxy: you change your SDK's base_url and it logs every request, response, token count, and cost with zero code changes. OpenObserve is an OpenTelemetry-native backend: it ingests gen_ai.* spans over OTLP and stores them next to your infrastructure logs, metrics, and traces in the same columnar store.
The short version:
- Why now. Helicone is in maintenance mode and closed to new signups, so this is either a forced move (new project) or a risk call (existing user planning ahead).
- Remove the proxy. Point your OpenAI/Anthropic client's
base_urlback at the real provider. - Add instrumentation instead. Install OpenLLMetry (closest to Helicone's zero-code feel) or instrument manually for full control over what each span carries.
- Export to OpenObserve. Set the standard
OTEL_EXPORTER_OTLP_*environment variables to your OpenObserve endpoint. No SDK-specific integration to install. - Re-map what Helicone gave you for free. Properties become span attributes,
User-Idbecomesuser_id, Sessions becomegen_ai.conversation_id, and cost becomes a computed attribute instead of a proxy-side lookup. - Know the trade. You gain one backend for LLM and infrastructure telemetry, SQL querying, and columnar storage cost. You lose Helicone's built-in caching, rate limiting, and request routing, since those are proxy features that a non-proxy backend cannot replicate; if you still want them, put a routing proxy like LiteLLM in front and send its traces to OpenObserve separately.
Why now: Helicone is in maintenance mode
If you're evaluating LLM observability tools for a new project in 2026, Helicone isn't an option: Mintlify's acquisition closed new signups entirely. If you're already on Helicone, nothing breaks today, existing customers keep running and the team has said security fixes and new model support continue, but the roadmap is frozen and there's no committed timeline beyond "for the foreseeable future." No feature you need tomorrow that doesn't exist today is coming.
That's a different kind of risk than a typical vendor comparison. It isn't "is this the best tool," it's "is this tool still being built." For a new project, the decision is made for you. For an existing one, the honest question is whether to move now on your own schedule or later under pressure, and the rest of this guide is written for both cases: teams starting fresh who need an OpenTelemetry-native alternative from day one, and teams already on Helicone who want a migration path before maintenance mode becomes an actual dead end.
Why the migration isn't a drop-in swap
Most "migrate from X" guides are a matter of changing an endpoint and an auth header. This one is not, because Helicone and OpenObserve sit at different points in the request path.
Helicone intercepts. Your application talks to gateway.helicone.ai (or a self-hosted equivalent) instead of api.openai.com directly. Helicone forwards the request to the real provider, and because it sees the raw HTTP traffic, it logs the prompt, the response, token counts, latency, and cost without your code emitting anything. That is the entire value proposition: production observability in one line, the base URL.
OpenObserve receives. Your application (or an instrumentation layer sitting in it) emits OpenTelemetry spans describing the call, model, tokens, and cost, and ships them over OTLP to OpenObserve. Nothing sits in the request path. OpenObserve does not see traffic it isn't told about, and it does not modify, cache, or route requests. It is a storage and query backend for telemetry, matching how it also ingests infrastructure logs, metrics, and traces.
That difference is exactly why teams make this move and exactly what the migration has to account for. If your only reason for having Helicone is LLM-call logging and cost tracking, and you also run infrastructure that already reports to (or should report to) a unified backend, moving to OpenTelemetry instrumentation gets you both signals in one place. If you rely on Helicone's caching, routing, or rate limiting, read the where you lose ground section before you start, because those are not observability features and nothing on the OpenObserve side replaces them.
Prerequisites
- An OpenObserve instance: OpenObserve Cloud (14-day free trial, no credit card) or a self-hosted install (single binary, AGPL, free).
- Your OpenObserve ingestion token and OTLP endpoint, from Data Sources → Custom → Traces in the UI.
- The LLM SDK(s) currently routed through Helicone's proxy: OpenAI SDK, Anthropic SDK, LangChain, or similar.
- Node.js or Python, matching whichever OpenLLMetry package you'll install.
Step 1: Remove the Helicone proxy
Find every place your code sets base_url (or baseURL) to Helicone's gateway, typically something like https://oai.helicone.ai/v1 for OpenAI or the equivalent Anthropic gateway path, along with the Helicone-Auth header. Point the client back at the provider's real endpoint:
# Before: routed through Helicone
client = OpenAI(
    base_url="https://oai.helicone.ai/v1",
    default_headers={"Helicone-Auth": f"Bearer {HELICONE_API_KEY}"},
)

# After: talking to the provider directly
client = OpenAI()
Do this per provider client. If you used Helicone's async logging mode instead of the proxy mode, remove the corresponding logging headers or middleware call instead; either way, the SDK should end up calling the provider with no Helicone involvement.
Step 2: Install OpenTelemetry instrumentation
The closest thing to Helicone's "change one line" experience on the OpenTelemetry side is OpenLLMetry: it patches the OpenAI, Anthropic, and other provider SDKs at import time and emits gen_ai.* spans with no changes to your call sites.
pip install traceloop-sdk
from traceloop.sdk import Traceloop

Traceloop.init(app_name="my-app", disable_batch=False)
Call Traceloop.init() once at startup, before you make any model calls. Every chat.completions.create (or the Anthropic equivalent) now produces a span carrying gen_ai.request.model, gen_ai.usage.input_tokens, gen_ai.usage.output_tokens, and related attributes, the same conventions covered in OpenTelemetry for LLMs.
If you want full control over exactly what each span records, for example computing gen_ai.usage.cost_usd yourself or adding custom attribution fields, instrument manually with the OpenTelemetry SDK instead. Monitoring OpenAI API costs with OpenTelemetry walks through that version span by span, and the OpenAI Agents SDK instrumentation guide covers the agent-loop case. Both approaches produce spans OpenObserve ingests the same way; OpenLLMetry is faster to stand up, manual instrumentation gives you more control over cost computation and custom attributes.
Step 3: Point the exporter at OpenObserve
Set the standard OpenTelemetry environment variables. OpenLLMetry and a manually configured OTLPSpanExporter both read these:
export OTEL_EXPORTER_OTLP_ENDPOINT="https://api.openobserve.ai/api/<your_org>"
export OTEL_EXPORTER_OTLP_HEADERS="Authorization=Basic <your_base64_token>,stream-name=default"
export OTEL_EXPORTER_OTLP_PROTOCOL="http/protobuf"
For self-hosted OpenObserve, swap the endpoint for your instance, for example http://localhost:5080/api/default. The base endpoint is enough; the SDK appends the signal-specific path (/v1/traces) automatically. Grab the exact org slug and token from Data Sources → Custom → Traces in the OpenObserve UI, the same screen used for any other OTLP source.
No application code changes here either, this is configuration only. Restart your app, make a test call, and the trace should appear in OpenObserve's Traces explorer within a few seconds.
Step 4: Map what Helicone gave you for free
Helicone bundles several concepts into the proxy layer. None of them disappear, they just move from "automatic because Helicone saw the request" to "explicit because you set the attribute."
Properties. Helicone lets you attach arbitrary key-value metadata to a request with a Helicone-Property-* header. The equivalent is a custom span attribute, set at the same place you set any gen_ai.* field:
span.set_attribute("feature", "document_summary")
span.set_attribute("team", "support")
User-Id. Helicone's Helicone-User-Id header, used for per-user cost breakdowns, becomes a user_id span attribute. Hash it first if the raw identifier is sensitive.
Sessions. Helicone Sessions group a chain of related requests, useful for tracing a multi-step agent run as one unit. The direct equivalent is gen_ai.conversation_id: set the same value across every span that belongs to one logical session, and OpenObserve's AI → LLM Sessions view groups them automatically, ranked by cost, with per-turn rollups. That view is exactly what makes a runaway agent loop visible instead of buried in a per-request list, the same session-cost workflow this walkthrough of a token spike investigation covers end to end.
Cost. Helicone computes cost server-side because it is on the request path and maintains its own pricing table. Without a proxy, you compute gen_ai.usage.cost_usd yourself from token counts and a pricing table you control, and set it as a span attribute so OpenObserve can sum and chart it. LLM cost monitoring has the full pattern, including the alerting layer for cost anomalies.
Step 5: Verify the migration
Two checks before you trust the new pipeline:
- Traces are landing. Open OpenObserve's Traces explorer, filter to your service, and confirm spans show
gen_ai.request.model, token counts, and your custom attributes (Properties,user_id).
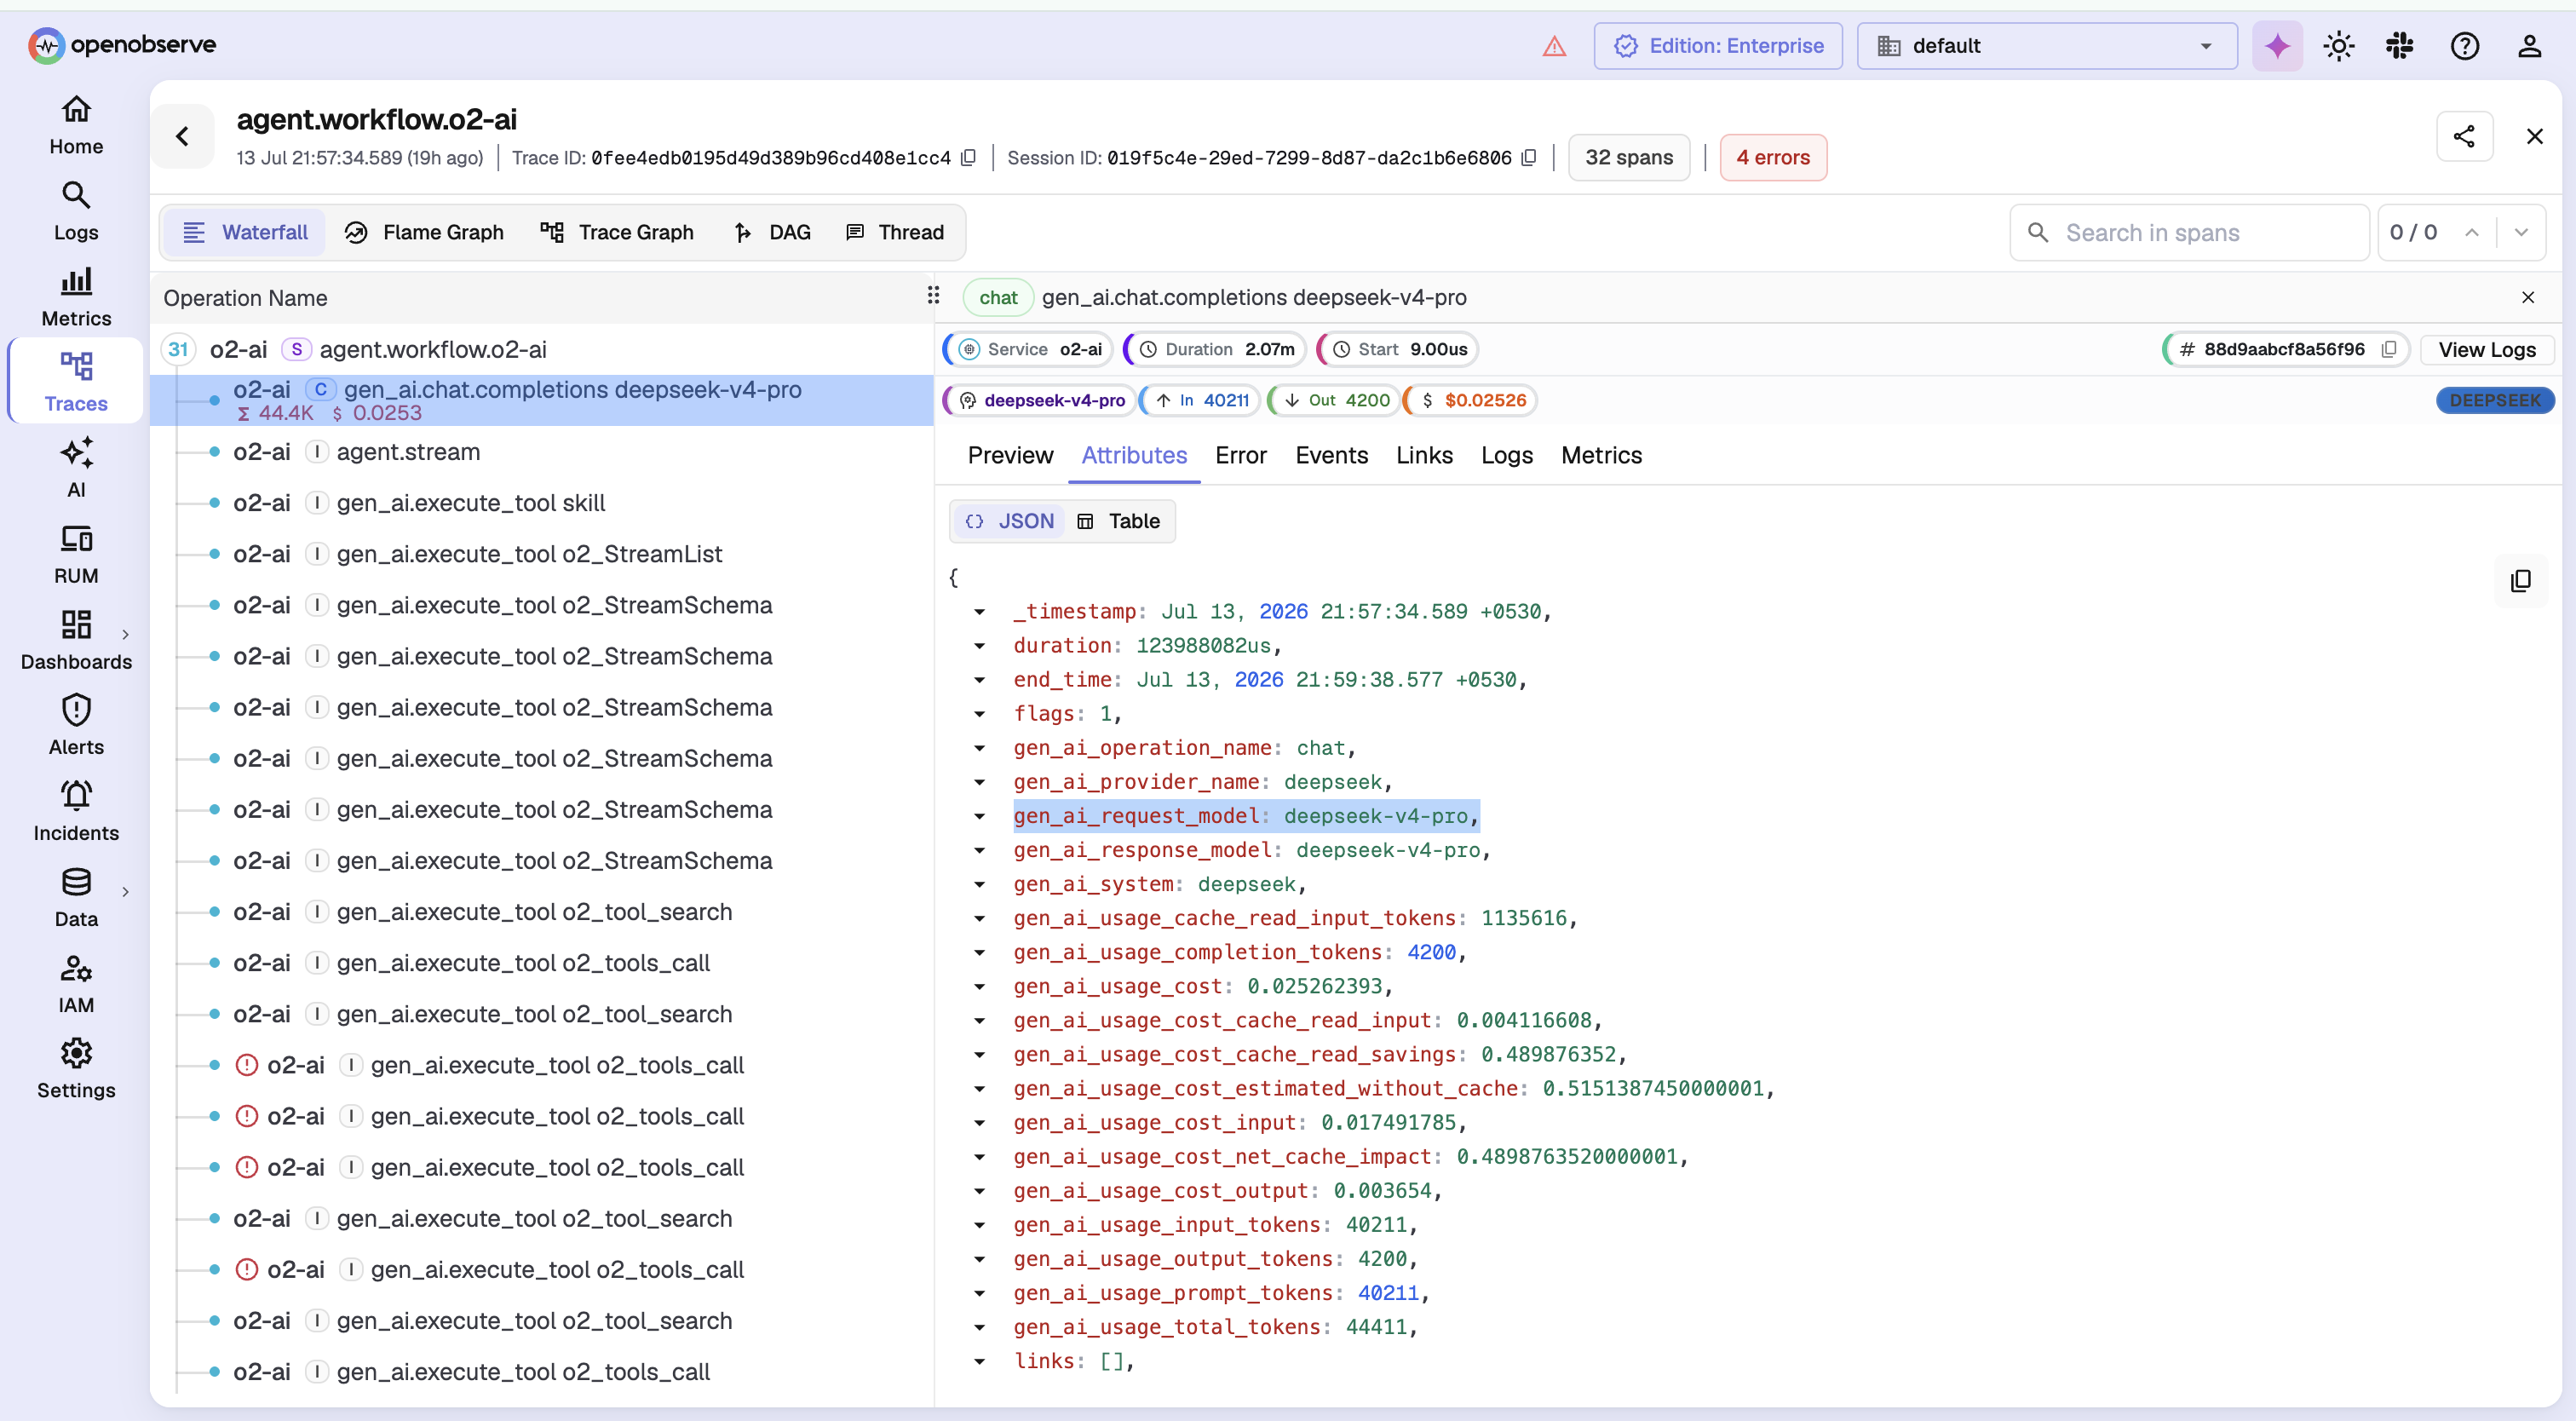 2. Sessions and cost line up. Open AI → LLM Sessions, sort by cost, and spot-check a session's total against what Helicone reported for the same window before you cut over. Small differences are expected (Helicone and your own pricing table can drift), but the ranking of expensive sessions should match.
Run both pipelines in parallel for a few days if you want a real side-by-side before removing Helicone entirely, since nothing about adding OpenTelemetry instrumentation conflicts with an existing Helicone proxy setup.
What you gain
The payoff is the reason teams make this move in the first place. An LLM call in production rarely fails in isolation, it's usually the retriever, the vector database, or a downstream service that made it slow or wrong. With OpenObserve, the LLM span and the infrastructure telemetry share a store and a query engine, so correlating a cost or latency spike with the database or host event behind it is one SQL query instead of a cross-tool investigation, the same correlation workflow covered in logs, metrics, and traces correlation. You also move from Helicone's per-log pricing to OpenObserve's per-GB ingested and queried model on Parquet columnar storage, which tends to favor high-volume, high-cardinality LLM telemetry, and from a hosted proxy to a single binary you can self-host under AGPL for free.
What you lose
Be honest with your team about this before you migrate. Helicone's proxy architecture bundles observability with three things that are not observability: caching of repeated requests, rate limiting to cap spend, and automatic provider failover. OpenObserve doesn't do any of these, because it never sits in the request path.
If those features matter independent of where your telemetry lands, they are not gone, they just need a different tool. Put a routing proxy like LiteLLM in front of your provider calls for caching, rate limiting, and failover, and export its OpenTelemetry traces to OpenObserve the same way described above. The two concerns, controlling request behavior and storing telemetry, are genuinely separable once you're off Helicone's all-in-one proxy; you don't have to solve both with the same product.
Try OpenObserve Cloud
If your bottleneck is correlating LLM spend with the infrastructure behind it, or you'd rather run one backend than a proxy plus a separate observability tool, the fastest way to see it is to send a few traces and query them next to your existing logs and metrics. Start a free OpenObserve Cloud trial with no credit card, or self-host the single binary under AGPL. Point OpenLLMetry or your manual OTel exporter at it and your LLM spans are queryable in minutes.
- Try OpenObserve Cloud: 14-day free trial, LLM Sessions included
- Read the OpenTelemetry for LLMs guide: the gen_ai.* conventions this migration relies on
Frequently Asked Questions
About the Author
Simran Kumari

Passionate about observability, AI systems, and cloud-native tools. All in on DevOps and improving the developer experience.
Follow OpenObserve on Google
Add OpenObserve as a preferred source to see more of our articles in Google Search and Top Stories.