Prometheus vs OpenTelemetry: Which Do You Need?




Ready to get started?
Try OpenObserve Cloud today for more efficient and performant observability.
Prometheus vs OpenTelemetry: Which Do You Need?
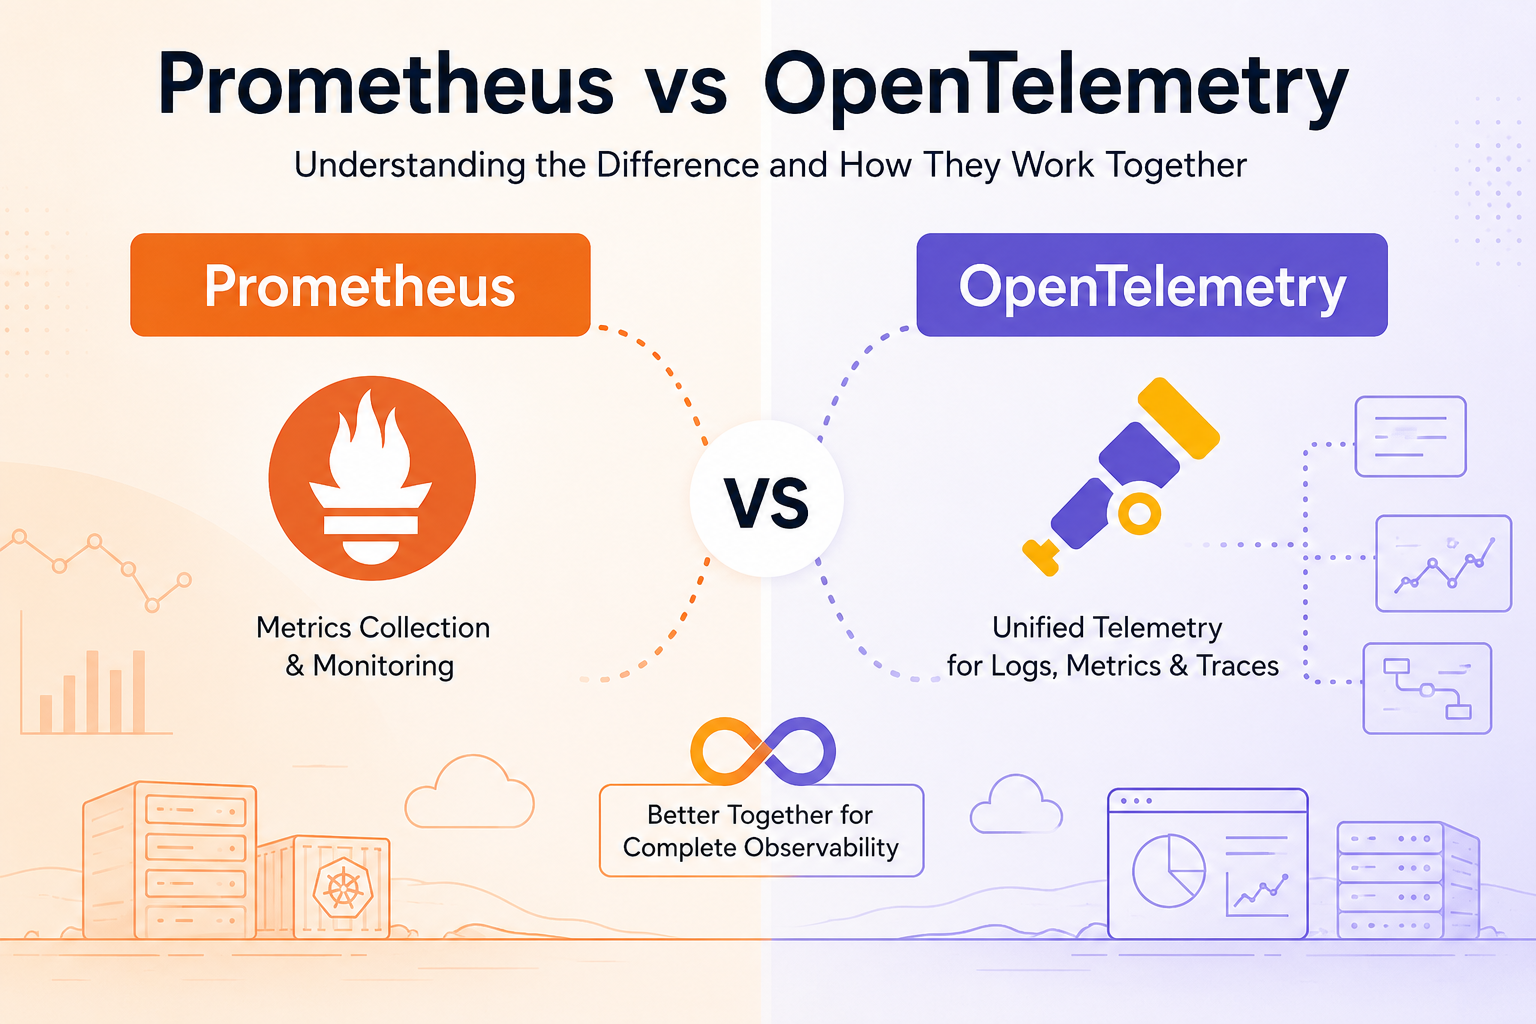
Short answer: they're not competitors. Prometheus is a metrics storage and query system. OpenTelemetry is a vendor-neutral standard for generating and collecting telemetry, logs, metrics, and traces, that can be sent to Prometheus or dozens of other backends. Most teams running modern infrastructure end up using both, at different layers of the stack.
The confusion is understandable. Both projects live under the Cloud Native Computing Foundation, both show up in the same Kubernetes monitoring conversations, and OpenTelemetry does include a metrics signal, which makes it sound like a direct alternative to Prometheus. It isn't, and understanding why changes how you should design your observability pipeline.
TL;DR: Key Takeaways
Prometheus stores and queries metrics; OpenTelemetry standardizes how you generate and move logs, metrics, and traces to any backend, Prometheus included. They're not competitors, and most teams end up using both: Prometheus for metrics-only monitoring, OpenTelemetry for vendor-neutral instrumentation across all three signals. OpenObserve can sit behind either or both, accepting Prometheus remote-write and OTLP side by side.
What Is Prometheus?
Prometheus is an open-source systems monitoring and alerting toolkit, originally built at SoundCloud and now a CNCF graduated project. It is best known for pull-based metrics collection: Prometheus periodically scrapes HTTP endpoints that expose metrics in its plain-text exposition format, then stores those samples in its own time-series database.
Core Components of Prometheus
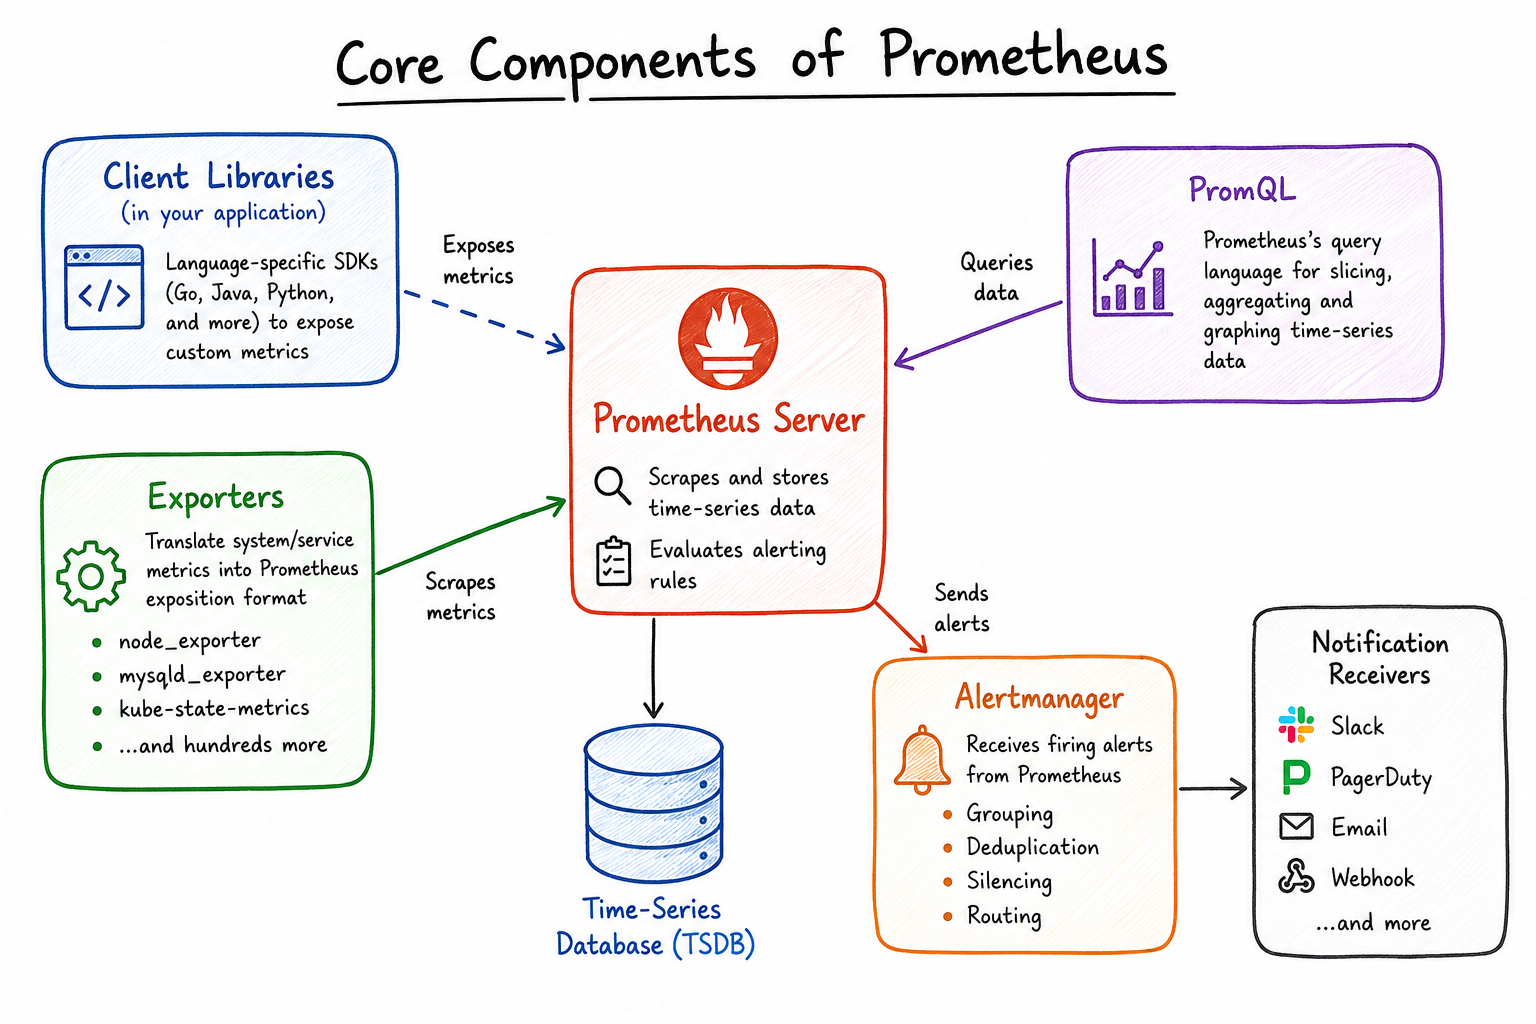
- Prometheus server: scrapes and stores time-series data, and evaluates alerting rules against it.
- Exporters: small processes (node_exporter, mysqld_exporter, kube-state-metrics, and hundreds of others) that translate a system's internal state into the Prometheus exposition format.
- PromQL: Prometheus's own query language for slicing, aggregating, and graphing time-series data.
- Alertmanager: a separate component that receives firing alerts from Prometheus and handles grouping, deduplication, silencing, and routing to Slack, PagerDuty, email, and other receivers.
- Client libraries: language-specific SDKs (Go, Java, Python, and more) that let applications expose custom metrics directly, without an exporter.
Prometheus assumes a metrics-only world. It has no built-in concept of a log line or a distributed trace, and its pull model means it needs to know where your targets are, either through static configuration or service discovery.
How Prometheus's Components Connect to OpenObserve
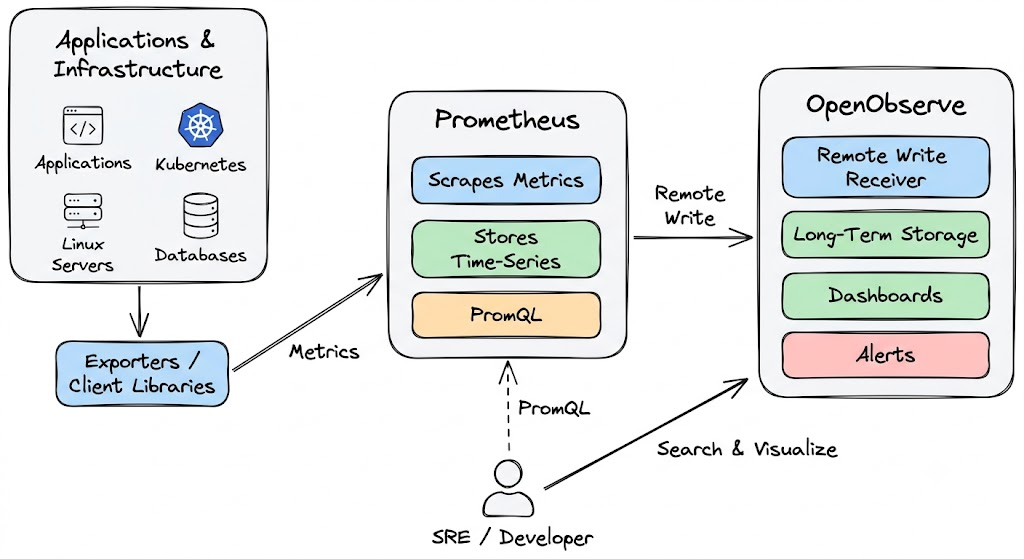
- Prometheus server: doesn't have to be replaced outright. OpenObserve accepts Prometheus remote-write directly, so the server can keep scraping while OpenObserve takes over as the long-term storage and query backend. Prometheus alternatives for metrics at scale covers this pattern alongside other options like VictoriaMetrics and Thanos.
- Exporters: point straight at OpenObserve once the Prometheus server (or an OTel Collector) is configured to remote-write there, with no changes to node_exporter, kube-state-metrics, or any other exporter. Send Kubernetes metrics using kube-prometheus-stack to OpenObserve shows the full setup.
- PromQL: works against data in OpenObserve the same way it works against native Prometheus storage, so existing dashboards and queries don't need to be rewritten. Prometheus metric types and the Prometheus cardinality bomb cover the metric shapes and cardinality limits that carry over regardless of backend.
- Alertmanager: can be replaced by OpenObserve's built-in alerting, which evaluates rules over metrics, logs, and traces in one place instead of a separate routing tree. Prometheus Alertmanager vs OpenObserve compares the two approaches directly.
- Client libraries: keep working unchanged. Whatever they scrape or push still lands in OpenObserve; see monitoring OpenObserve's own internal metrics in Prometheus format for a concrete example of Prometheus-format metrics feeding into OpenObserve.
What Is OpenTelemetry?
OpenTelemetry (often shortened to OTel) is an open-source observability framework, also a CNCF project, that standardizes how applications generate, collect, and export telemetry. It is not a database and not a UI. It's the instrumentation and transport layer that sits between your code and whatever backend you choose to store data in.
Core Components of OpenTelemetry
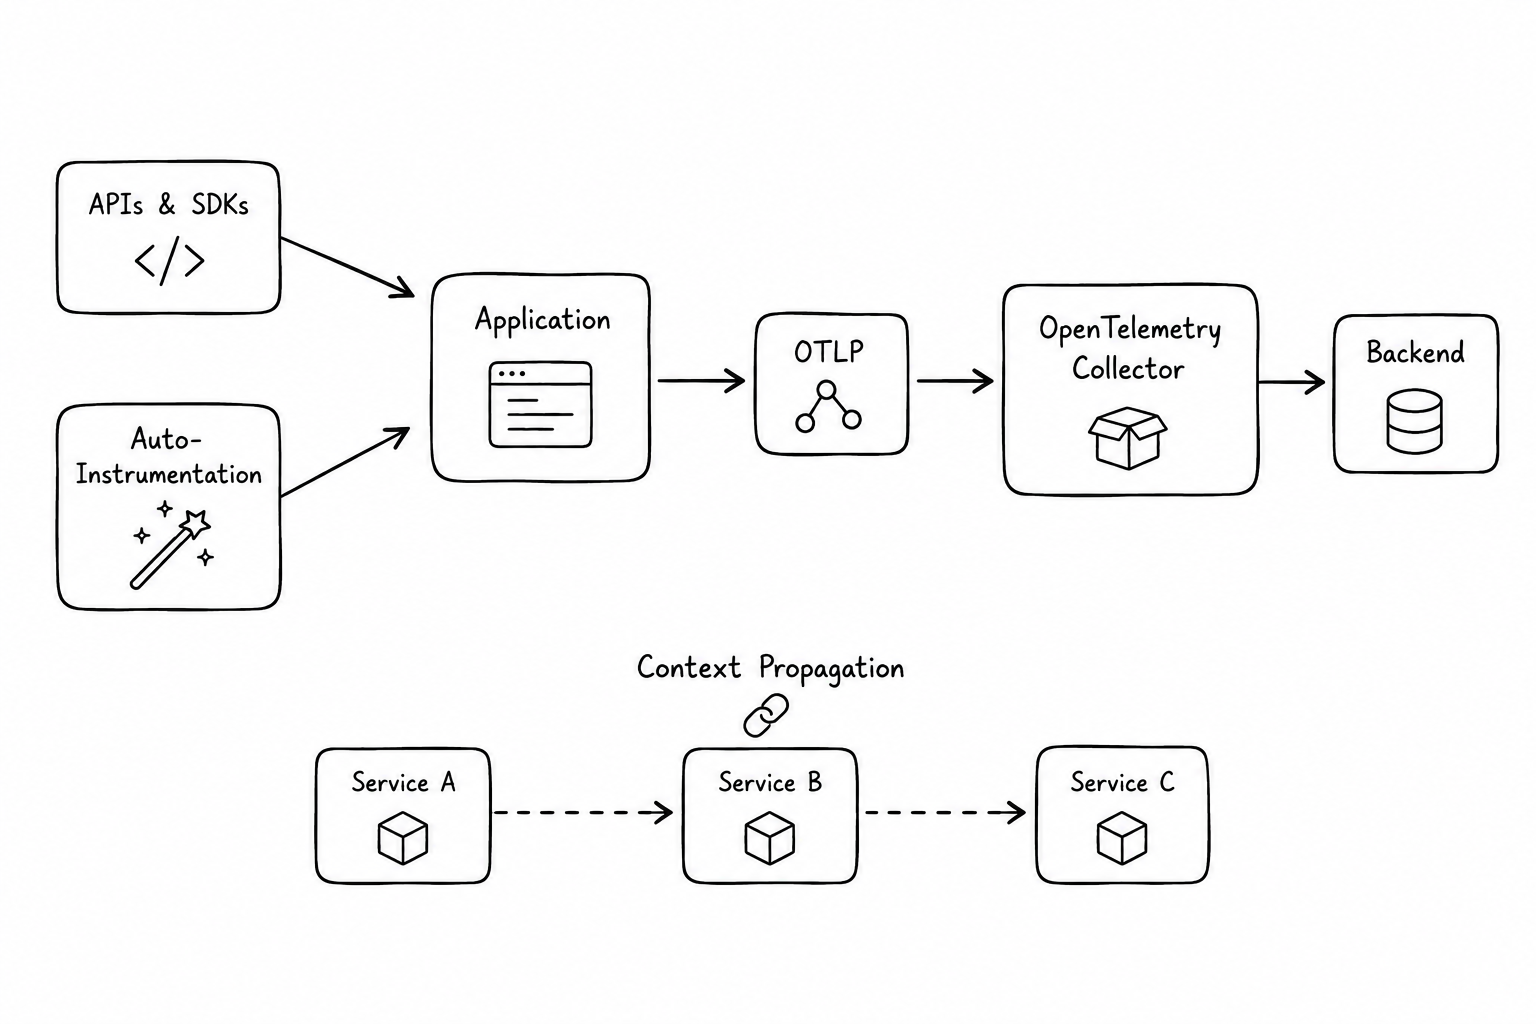
- APIs and SDKs: language-specific libraries that let you instrument applications to emit logs, metrics, and traces using a common data model.
- Auto-instrumentation: agents and libraries that automatically capture telemetry from common frameworks (HTTP servers, database clients, message queues) with little or no code change.
- OTLP (OpenTelemetry Protocol): the standard wire protocol for sending telemetry from an application or Collector to a backend.
- OpenTelemetry Collector: a standalone service that receives, processes, and exports telemetry. It can scrape Prometheus endpoints, convert formats, batch and filter data, and fan data out to multiple backends at once.
- Context propagation: the mechanism that carries trace and correlation identifiers across service boundaries, which is what makes distributed tracing possible.
Where Prometheus is metrics-first by design, OpenTelemetry treats logs, metrics, and traces as three signals under one instrumentation standard, with the Collector acting as a flexible routing and transformation layer in front of any backend.
How OpenTelemetry's Components Connect to OpenObserve
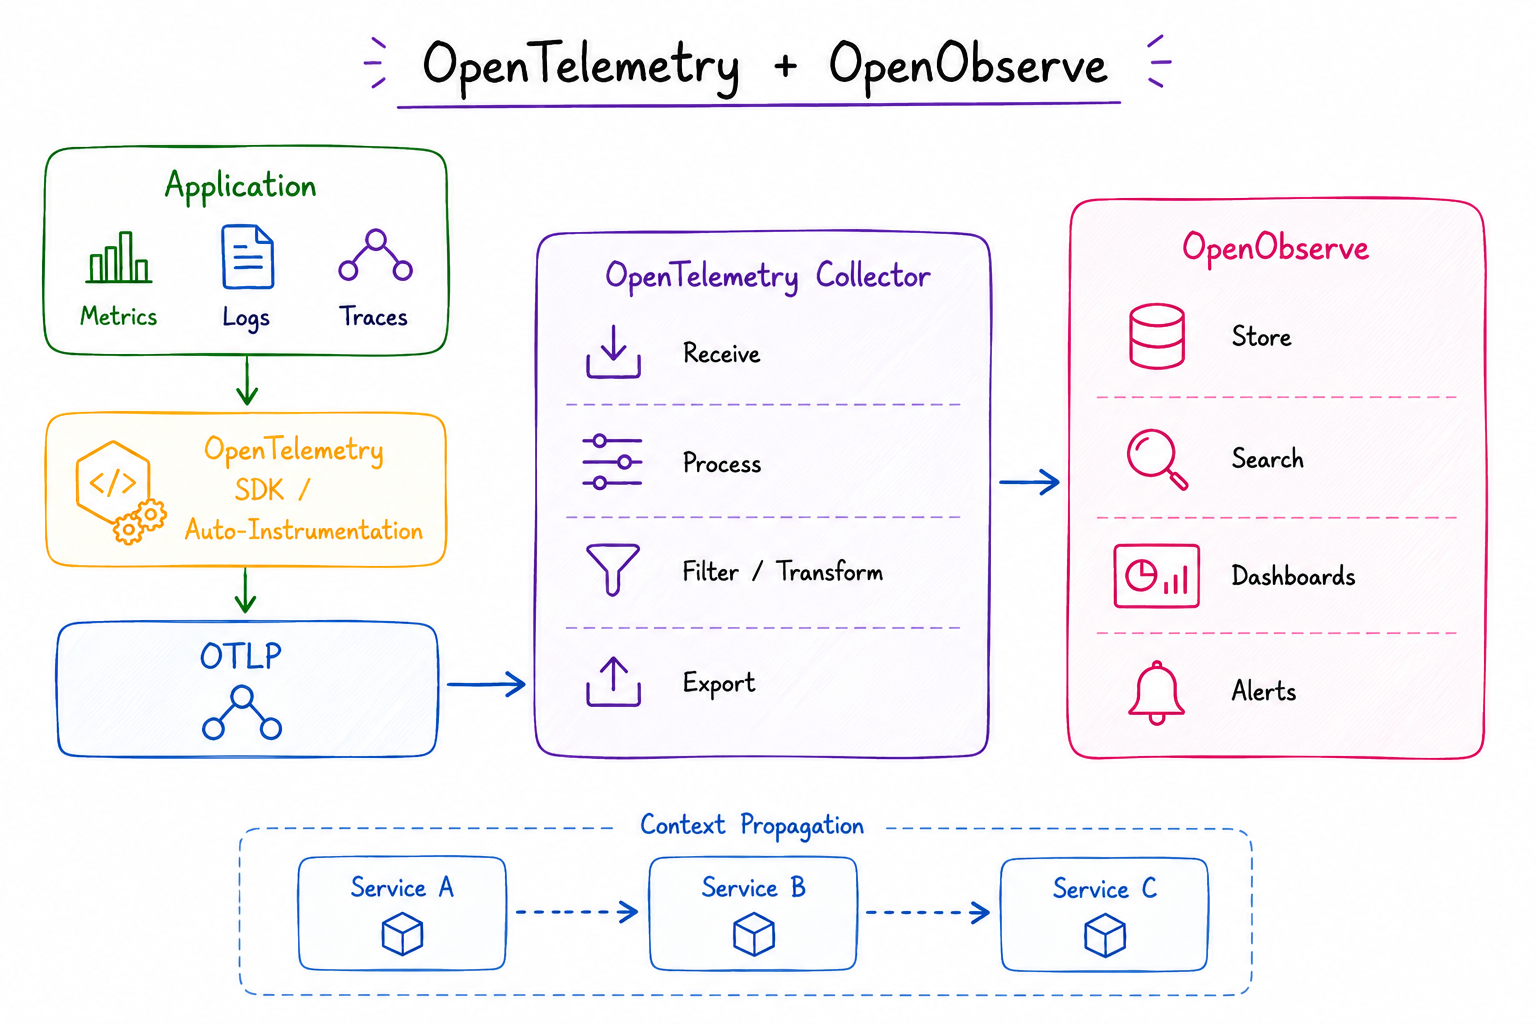
- APIs and SDKs: send logs, metrics, and traces to OpenObserve over OTLP with no intermediate conversion, since OpenObserve is a native OTLP backend. Instrumenting the OpenAI Agents SDK with OpenTelemetry is one example of an SDK sending its full trace data straight to OpenObserve.
- Auto-instrumentation: pairs directly with OpenObserve in framework-specific guides like monitoring your FastAPI application with OpenTelemetry and OpenObserve, where auto-instrumented spans and metrics flow into OpenObserve with minimal setup.
- OTLP: is the primary ingestion protocol OpenObserve exposes for logs, metrics, and traces alike. What backends support OpenTelemetry (OTLP)? places OpenObserve among the backends built around native OTLP support.
- OpenTelemetry Collector: is the standard way to route data into OpenObserve in production, whether that's application telemetry or infrastructure pipelines. How to monitor Jenkins pipelines with OpenTelemetry and OpenObserve and OpenTelemetry Collector Contrib: a comprehensive guide both cover Collector configurations that export to a backend like OpenObserve.
- Context propagation: is what lets OpenObserve correlate a trace with the logs and metrics from the same request, rather than showing three disconnected signals. How to send AWS Lambda traces to OpenObserve using ADOT shows propagated trace context landing in OpenObserve end to end.
Prometheus vs OpenTelemetry: Key Differences
| Aspect | Prometheus | OpenTelemetry |
|---|---|---|
| What it is | Metrics database, query engine, and alerting toolkit | Instrumentation standard and telemetry pipeline |
| Signals supported | Metrics only | Logs, metrics, and traces |
| Collection model | Pull-based (scrapes targets) | Push-based (SDKs/Collector export data), with a Prometheus receiver available for scraping |
| Storage | Built-in time-series database | None; OpenTelemetry is backend-agnostic |
| Query language | PromQL | None; querying happens in whatever backend you send data to |
| Alerting | Built-in rules engine, paired with Alertmanager | None; alerting is handled by the backend |
| Vendor lock-in | Tied to Prometheus-compatible storage and PromQL | Designed to avoid lock-in; same instrumentation works with any OTLP-compatible backend |
Do Prometheus and OpenTelemetry Compete?
Not really. They operate at different layers of the stack. Prometheus is a backend you can send metrics to. OpenTelemetry is a way of producing and moving telemetry that can be sent to Prometheus, or to dozens of other systems, without changing your instrumentation.
The overlap that causes confusion is the OpenTelemetry metrics signal. If you're instrumenting a new service, you can choose the Prometheus client library or the OpenTelemetry SDK to emit metrics, and at that specific decision point, it can feel like picking between two competing tools. But the OpenTelemetry SDK doesn't store or query anything itself. It still needs a backend, and Prometheus is a perfectly valid one.
How Prometheus and OpenTelemetry Work Together
In practice, most production stacks combine both, in one of a few common patterns:
- Prometheus receiver in the OTel Collector: the Collector scrapes your existing Prometheus exporters and node_exporter endpoints, converts the data to the OpenTelemetry model, and routes it alongside logs and traces to a single backend.
- Prometheus remote-write exporter: OpenTelemetry SDKs or the Collector export metrics using the remote-write protocol, landing them in Prometheus or any remote-write-compatible store, while traces and logs from the same services flow through OTLP to an observability backend.
- Native OTLP ingestion in Prometheus: Prometheus's OTLP receiver, stable since Prometheus 3.0, lets OpenTelemetry-instrumented services send metrics straight to Prometheus without an intermediate conversion step.
- Gradual migration: teams standardizing on OpenTelemetry instrument new services with OTel SDKs from day one, while the Collector's Prometheus receiver keeps ingesting metrics from legacy exporters until they're migrated or retired.
None of these patterns require ripping out an existing Prometheus deployment. The Collector's job is precisely to bridge the two worlds while you migrate at your own pace.
Which One Should You Use?
- You have a Kubernetes cluster with existing exporters and no plans to add tracing: keep Prometheus as-is. It's mature, well-documented, and the ecosystem of exporters is enormous.
- You're instrumenting new services and want logs, metrics, and traces from one SDK: start with OpenTelemetry. It keeps you backend-agnostic and gives you trace correlation for free.
- You're migrating off Prometheus lock-in or consolidating tools: run the OpenTelemetry Collector in front of your stack, using its Prometheus receiver to keep scraping existing targets while you route everything, old and new, to a single backend.
- You want long retention and high-cardinality metrics without operating a separate Prometheus cluster for scale: send data through OpenTelemetry to a backend built to store and query it efficiently, while still supporting PromQL for teams that don't want to relearn a query language.
Where OpenObserve Fits
OpenObserve is built to sit at the end of both paths rather than force a choice between them. It ingests OTLP directly from OpenTelemetry SDKs and Collectors for logs, metrics, and traces, and it also accepts Prometheus remote-write, so an existing Prometheus scrape setup can point at OpenObserve without any changes to exporters or service discovery. PromQL-style querying works alongside SQL, which means teams don't have to abandon dashboards and alerts built around Prometheus semantics while they adopt OpenTelemetry instrumentation for everything else.
That matters most during migration. You rarely flip a switch and move an entire organization to OpenTelemetry overnight. Being able to run Prometheus-style scraping and OpenTelemetry-native instrumentation against the same backend means logs, metrics, and traces stay correlated and queryable in one place, instead of split across two systems you have to cross-reference by hand.
Conclusion
Prometheus and OpenTelemetry solve different problems. Prometheus stores and queries metrics. OpenTelemetry standardizes how you generate and move logs, metrics, and traces to whatever backend you choose, including Prometheus itself. The question isn't really "Prometheus or OpenTelemetry": it's whether your team needs metrics-only monitoring (Prometheus handles that well on its own) or a unified, vendor-neutral way to instrument logs, metrics, and traces together (that's what OpenTelemetry is for).
For most teams building or modernizing an observability stack in 2026, the practical answer is both: OpenTelemetry for instrumentation and collection, and a backend, whether that's Prometheus for metrics-only needs or a unified platform like OpenObserve, that can store and query what OpenTelemetry sends it.
Related reading: What Is OpenTelemetry?, Prometheus Alertmanager vs OpenObserve, and Observability vs Monitoring.
Get Started with OpenObserve Today!
Sign up for a 14 day cloud trial. Check out our GitHub repository for self-hosting and contribution opportunities.
Frequently Asked Questions
About the Author
Simran Kumari

Passionate about observability, AI systems, and cloud-native tools. All in on DevOps and improving the developer experience.
Follow OpenObserve on Google
Add OpenObserve as a preferred source to see more of our articles in Google Search and Top Stories.












