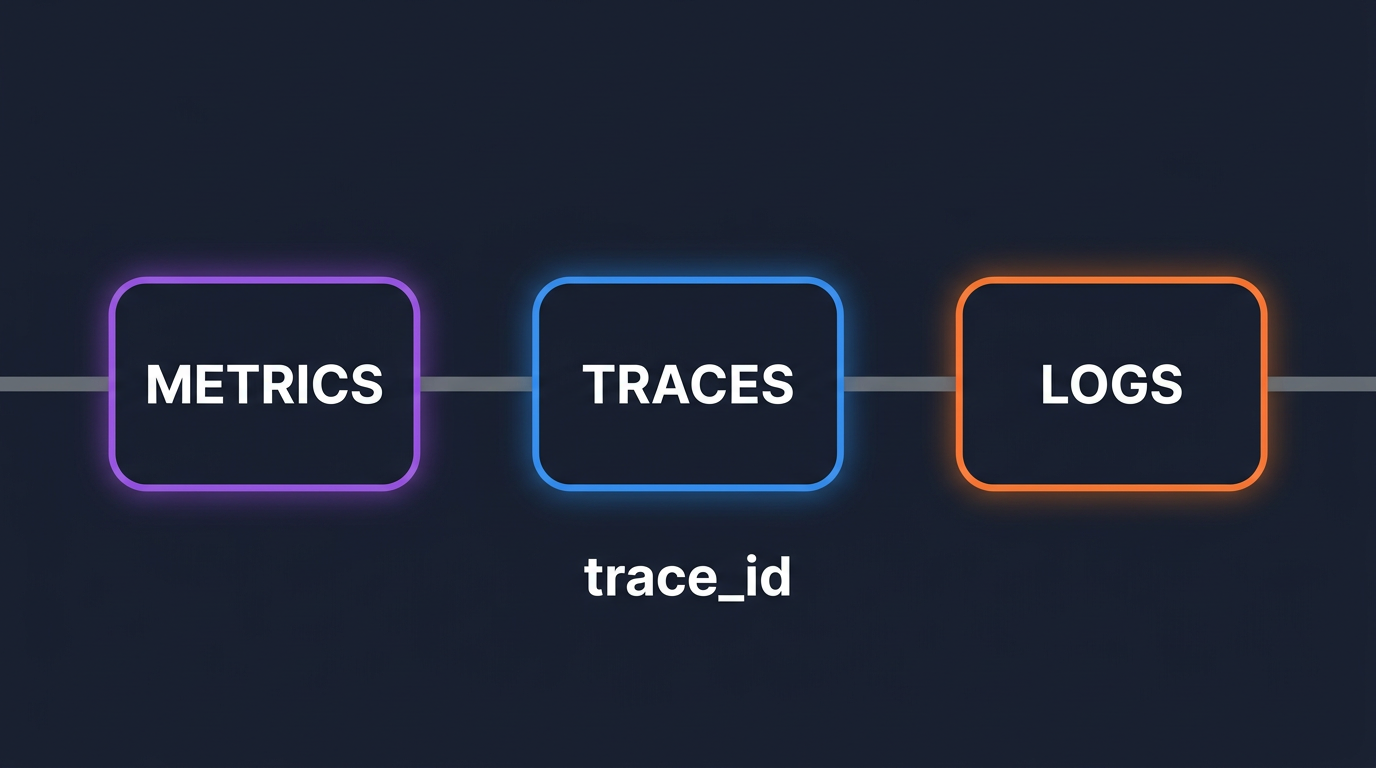
Stop tab-switching at 3AM. Wire trace_id into logs and exemplars into metrics so you can pivot from alert to root cause in seconds, not hours.
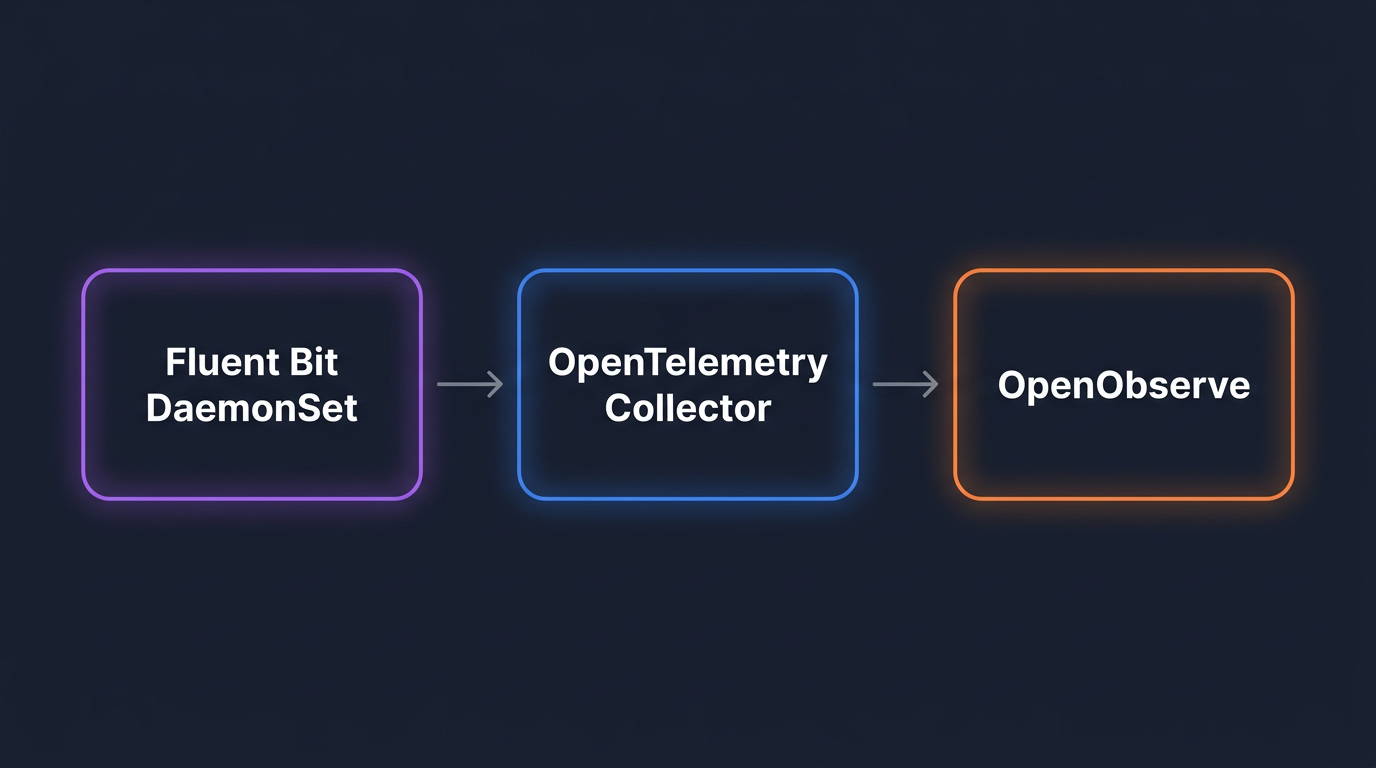
A working pipeline for monitoring Kubernetes logs at scale: the openobserve-collector Helm chart for the fast path, or Fluent Bit + OpenTelemetry Collector for full control. Helm configs, multi-cluster routing, retention math.
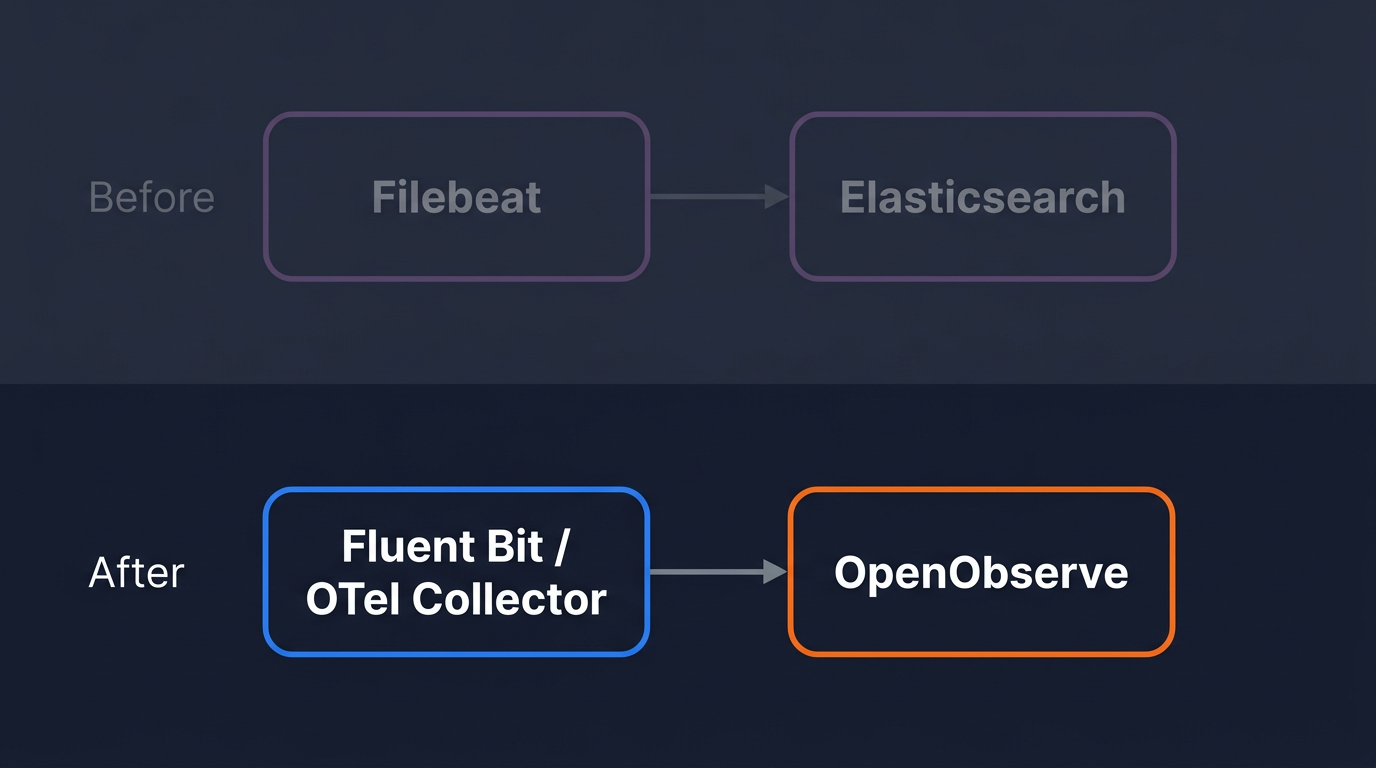
Elasticsearch was built for search, not logs. Learn how to migrate your ELK log pipeline to OpenObserve using OTel Collector or Fluent Bit.
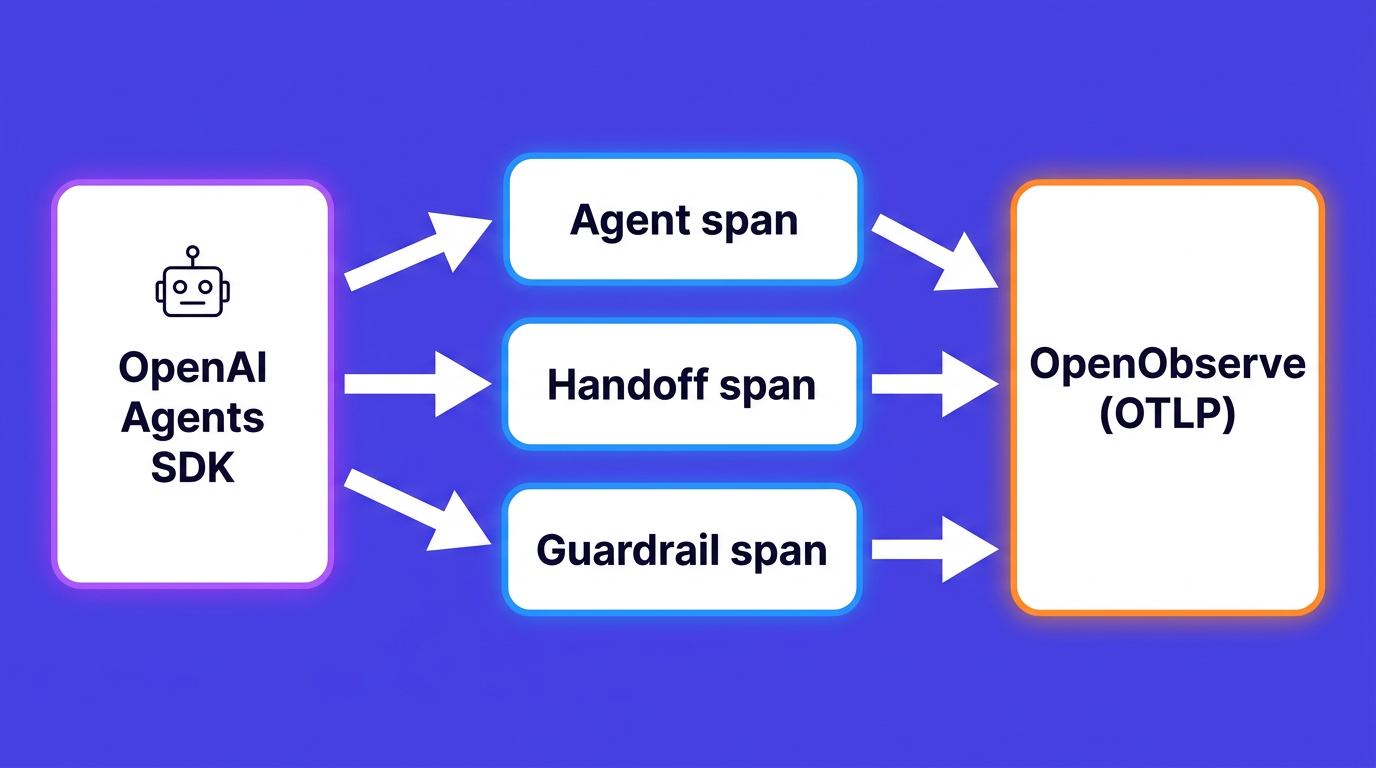
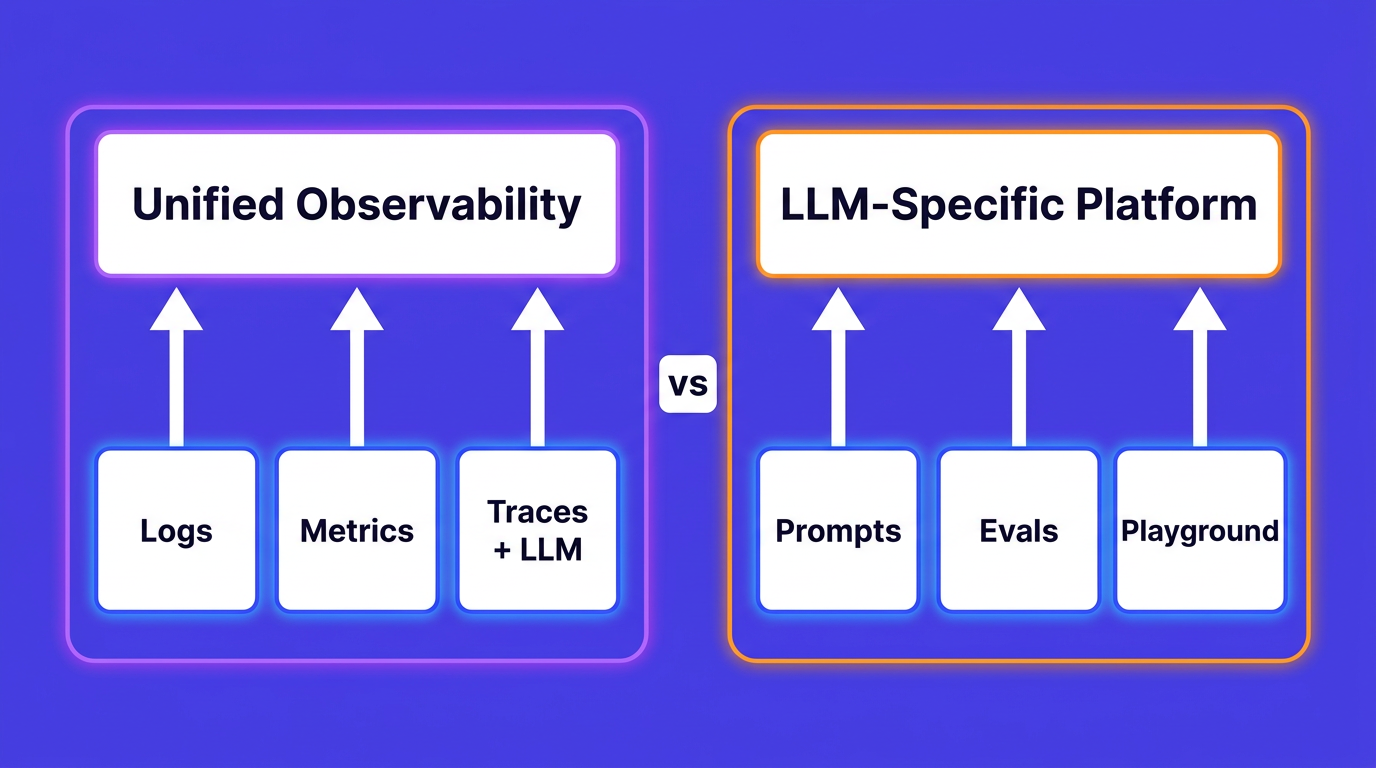
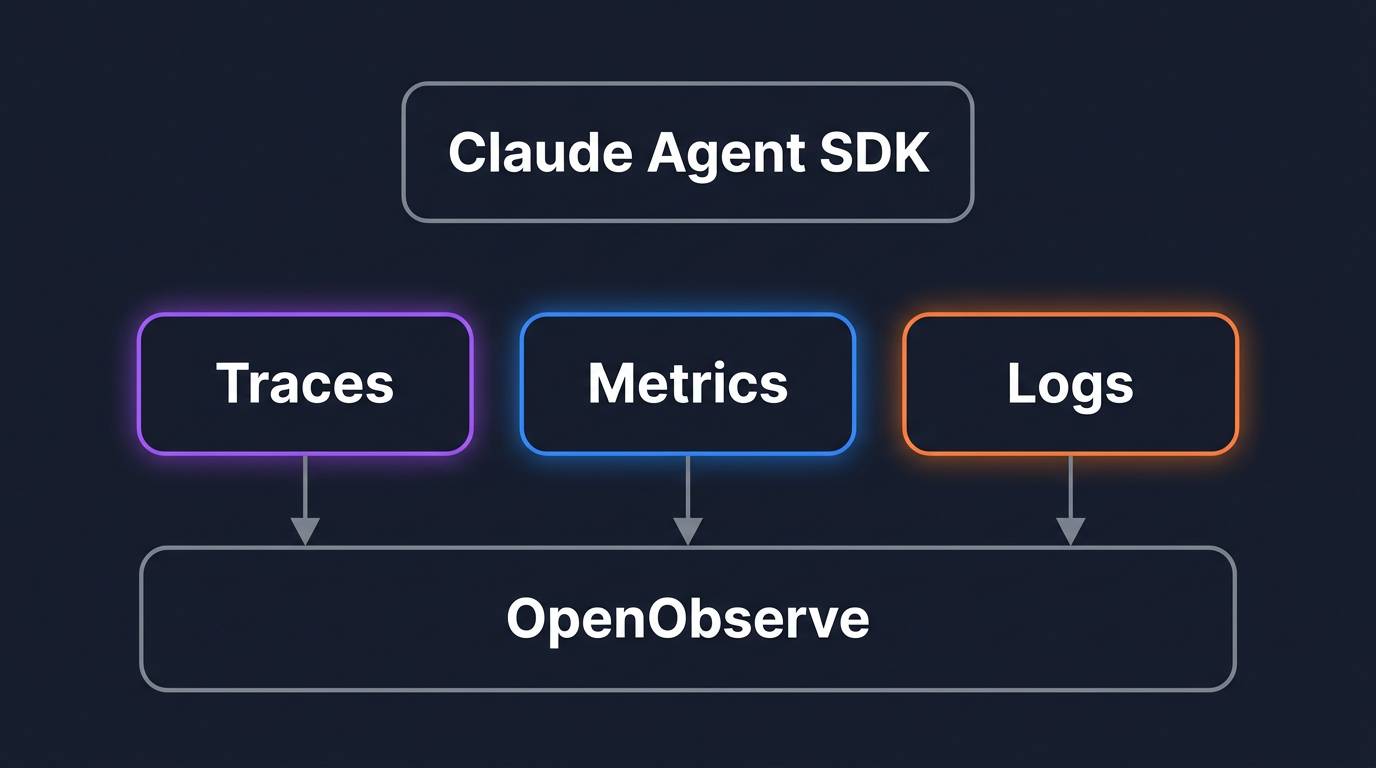
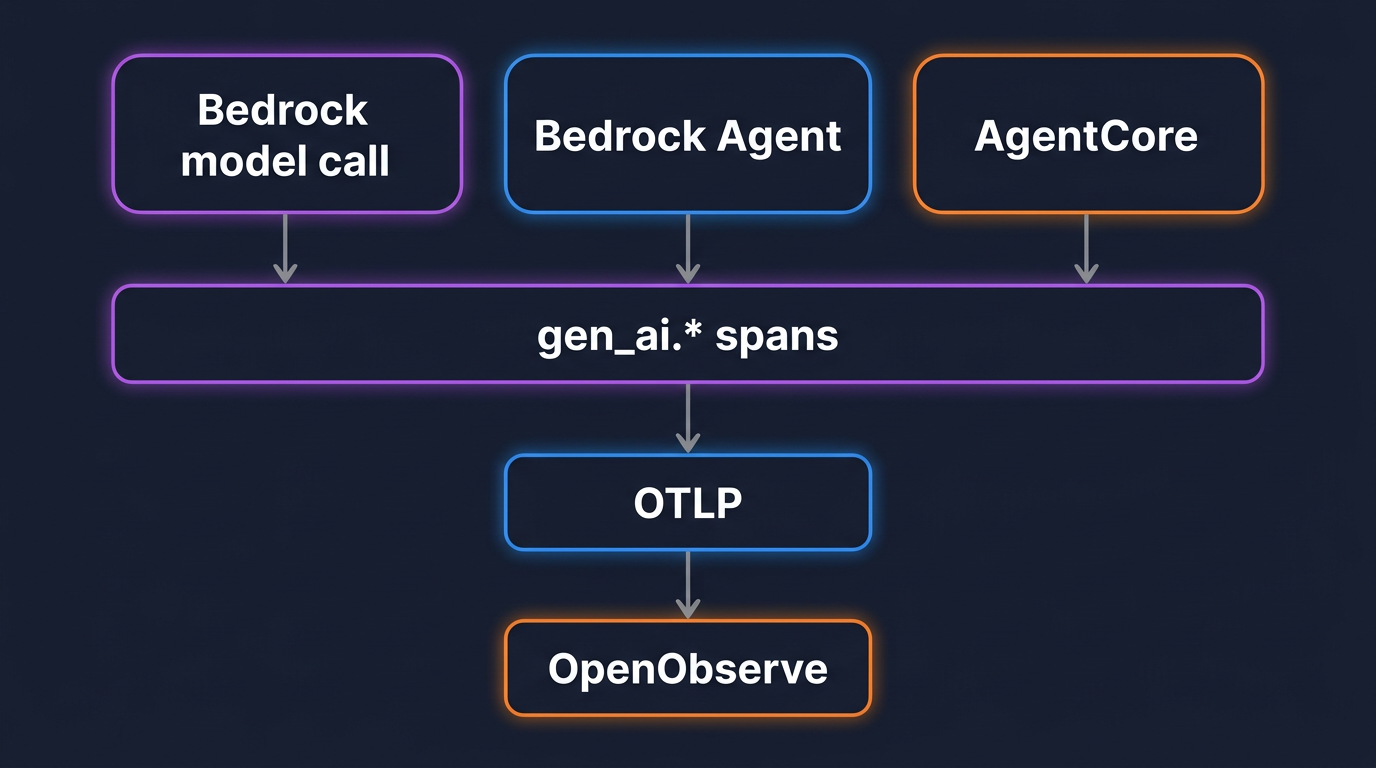
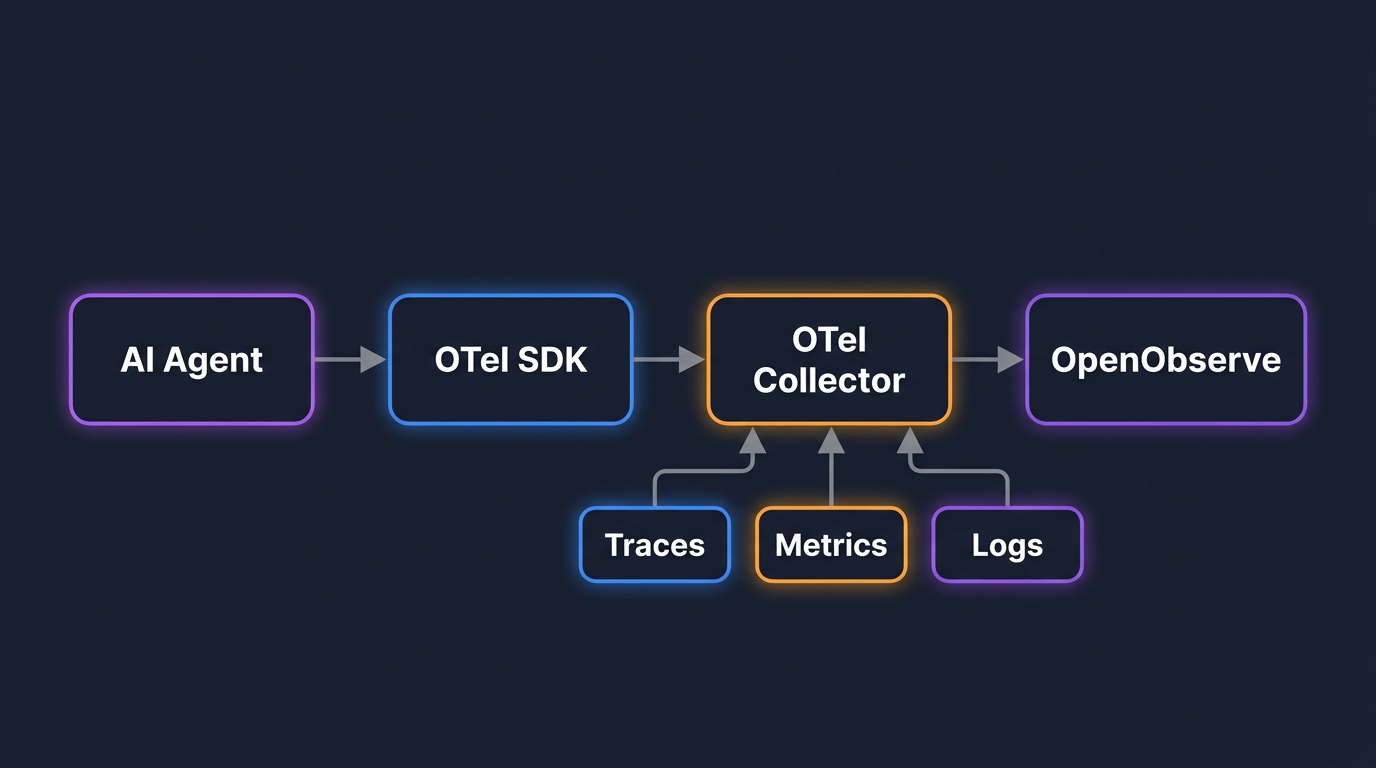
How to make AI agents observable in production: OTel instrumentation, telemetry backends, cost tracking, and trace analysis.
How to monitor n8n workflows with Prometheus metrics and OpenTelemetry tracing using OpenObserve. Covers self-hosted n8n and instrumenting services that call n8n webhooks.
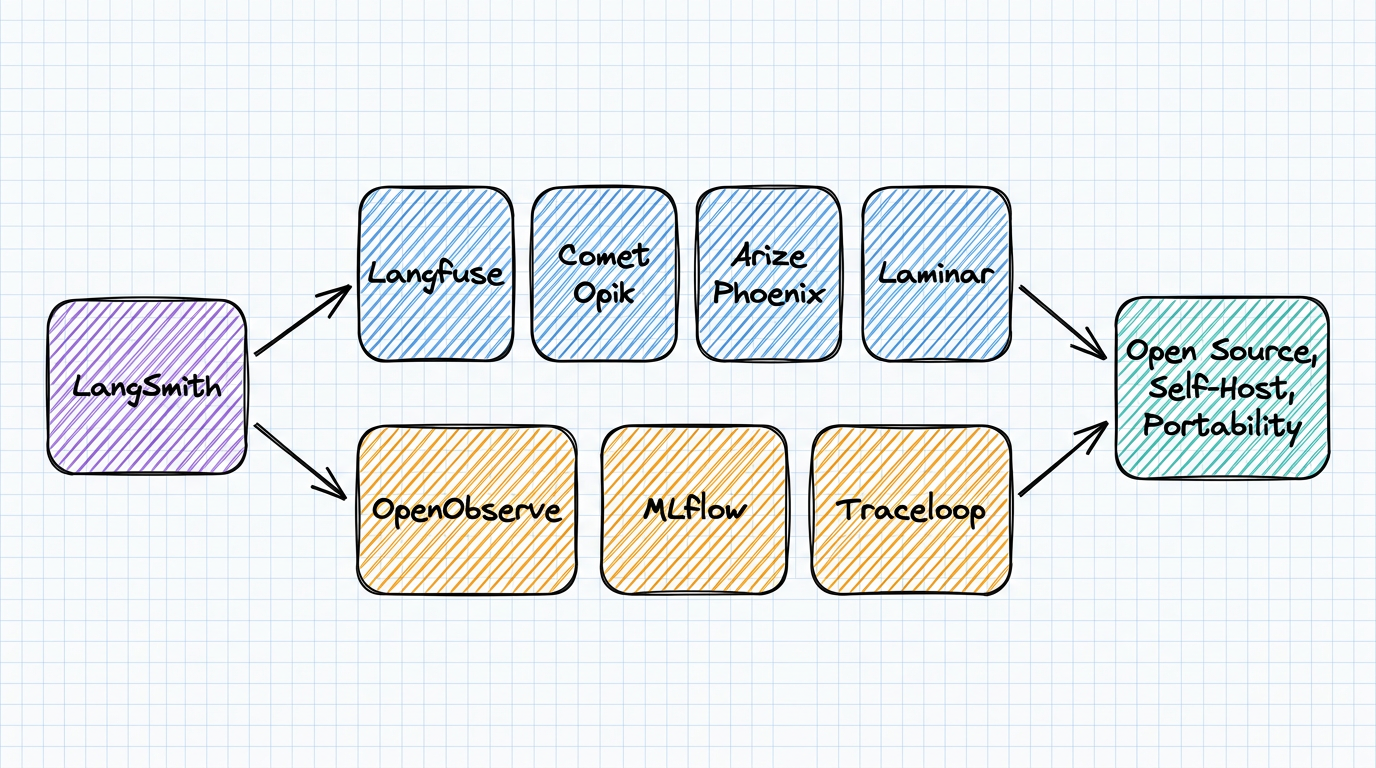
A comprehensive list and comparison of observability backends that support OpenTelemetry and OTLP, covering open-source, commercial, and cloud-native options.
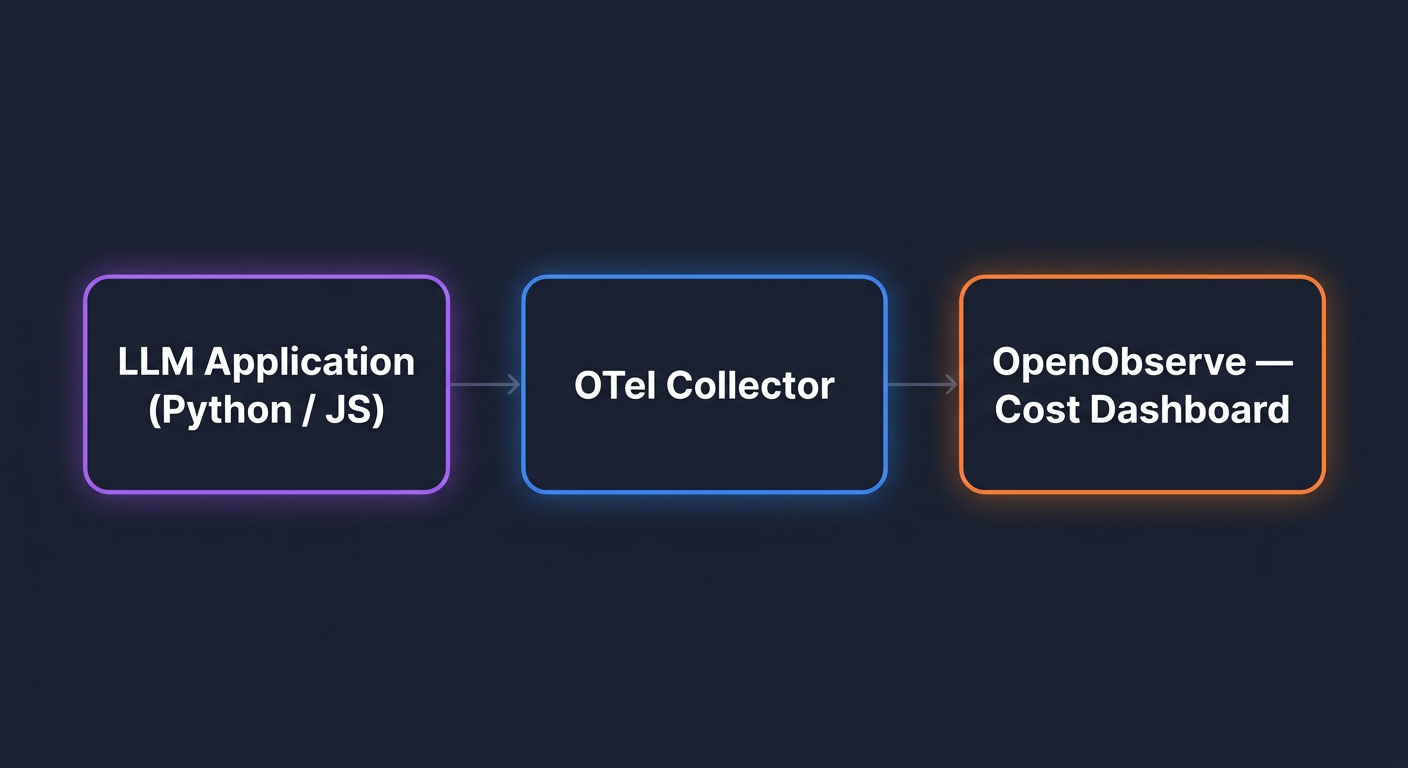
A practical, code-first guide to instrumenting OpenAI with OpenTelemetry. Capture token usage, attribute costs by user and feature, build a cost dashboard, and alert on anomalies in OpenObserve.
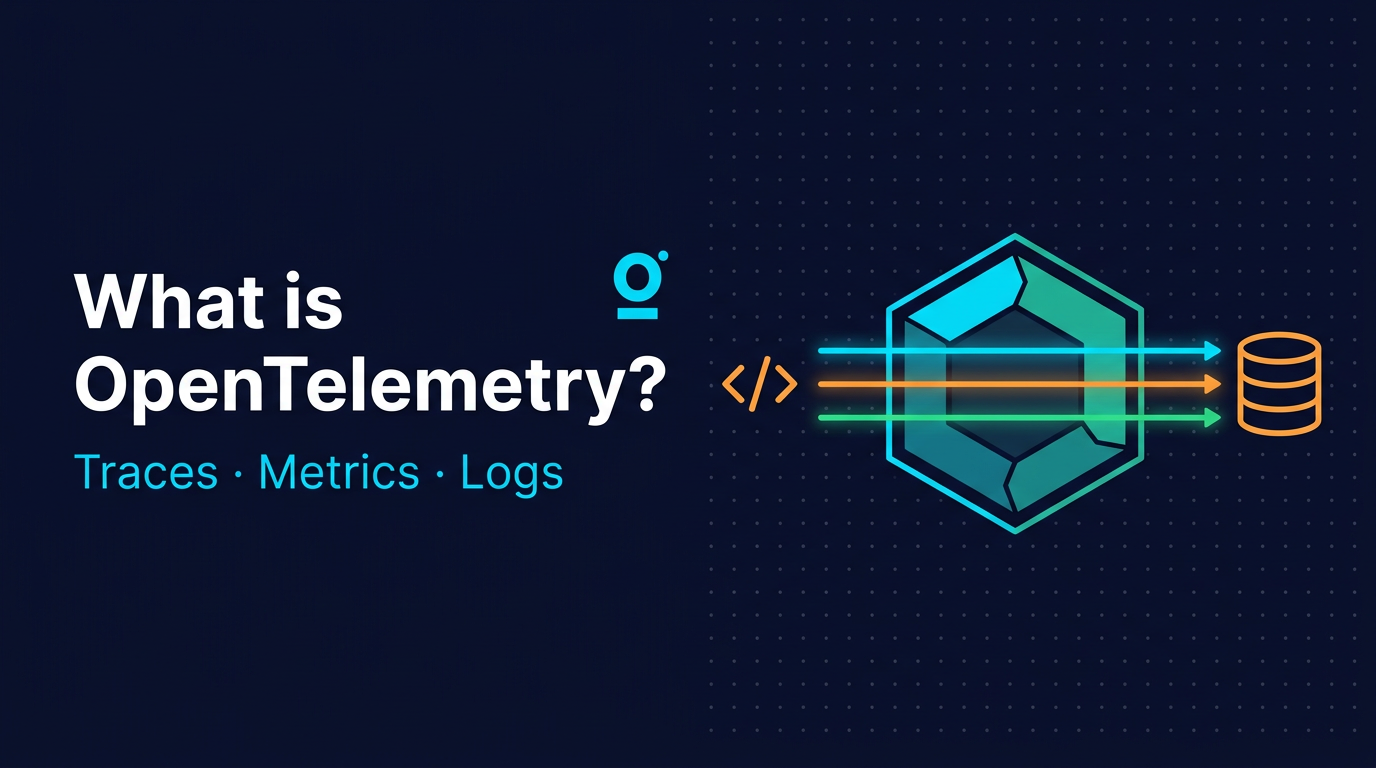
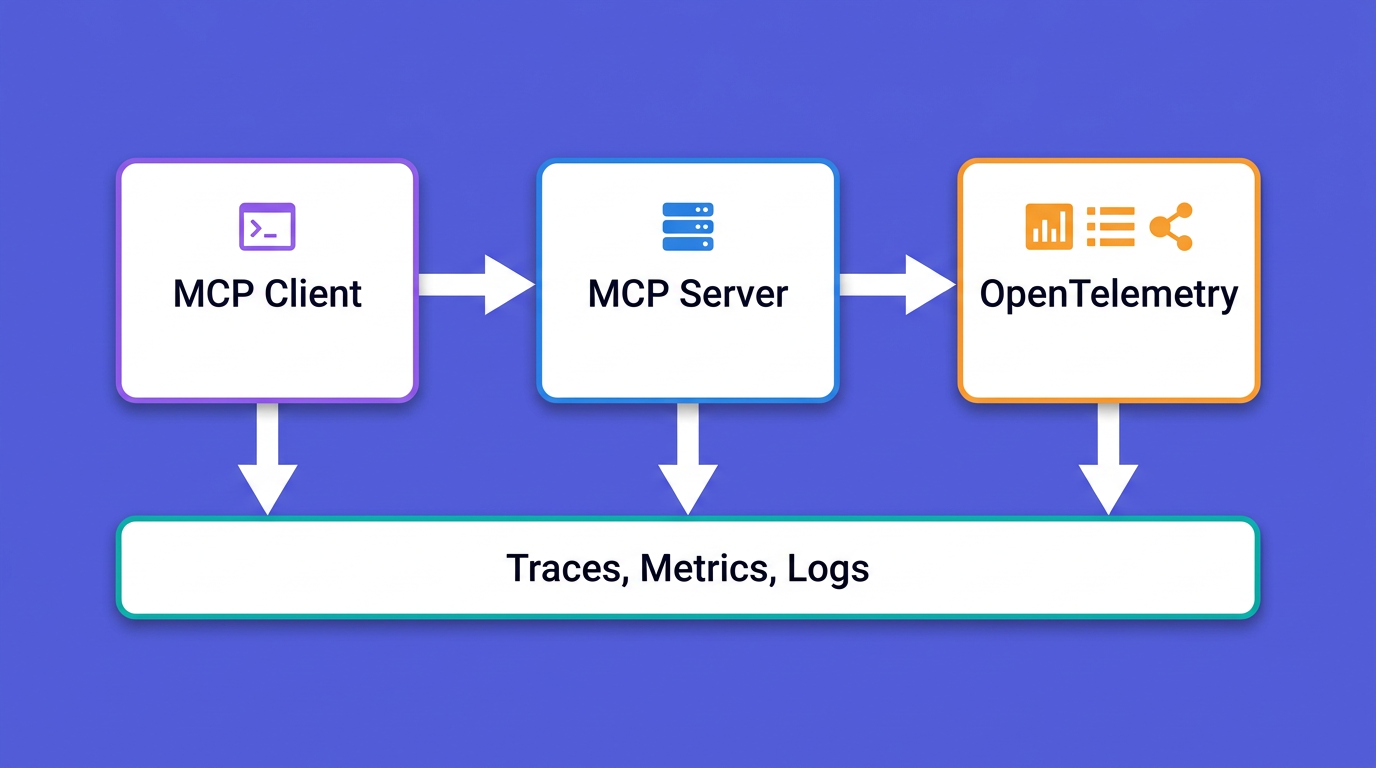
A complete guide to OpenTelemetry: what it is, how the Collector and OTLP work, and how to instrument your first service.
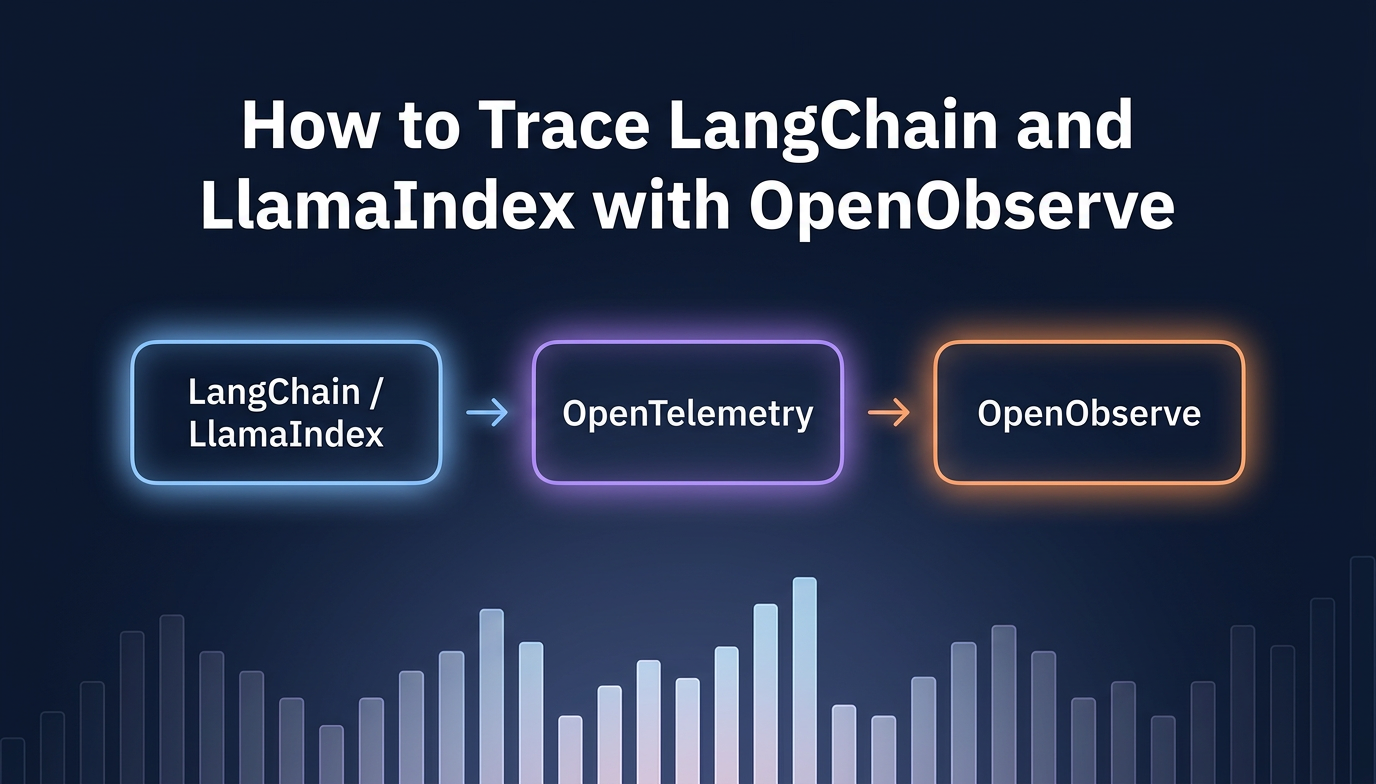
Learn how to add distributed tracing to LangChain and LlamaIndex apps using OpenLLMetry and the OpenTelemetry SDK, with traces flowing into OpenObserve.