Synthetic Monitoring vs. RUM: What Is Synthetic Monitoring?




Ready to get started?
Try OpenObserve Cloud today for more efficient and performant observability.
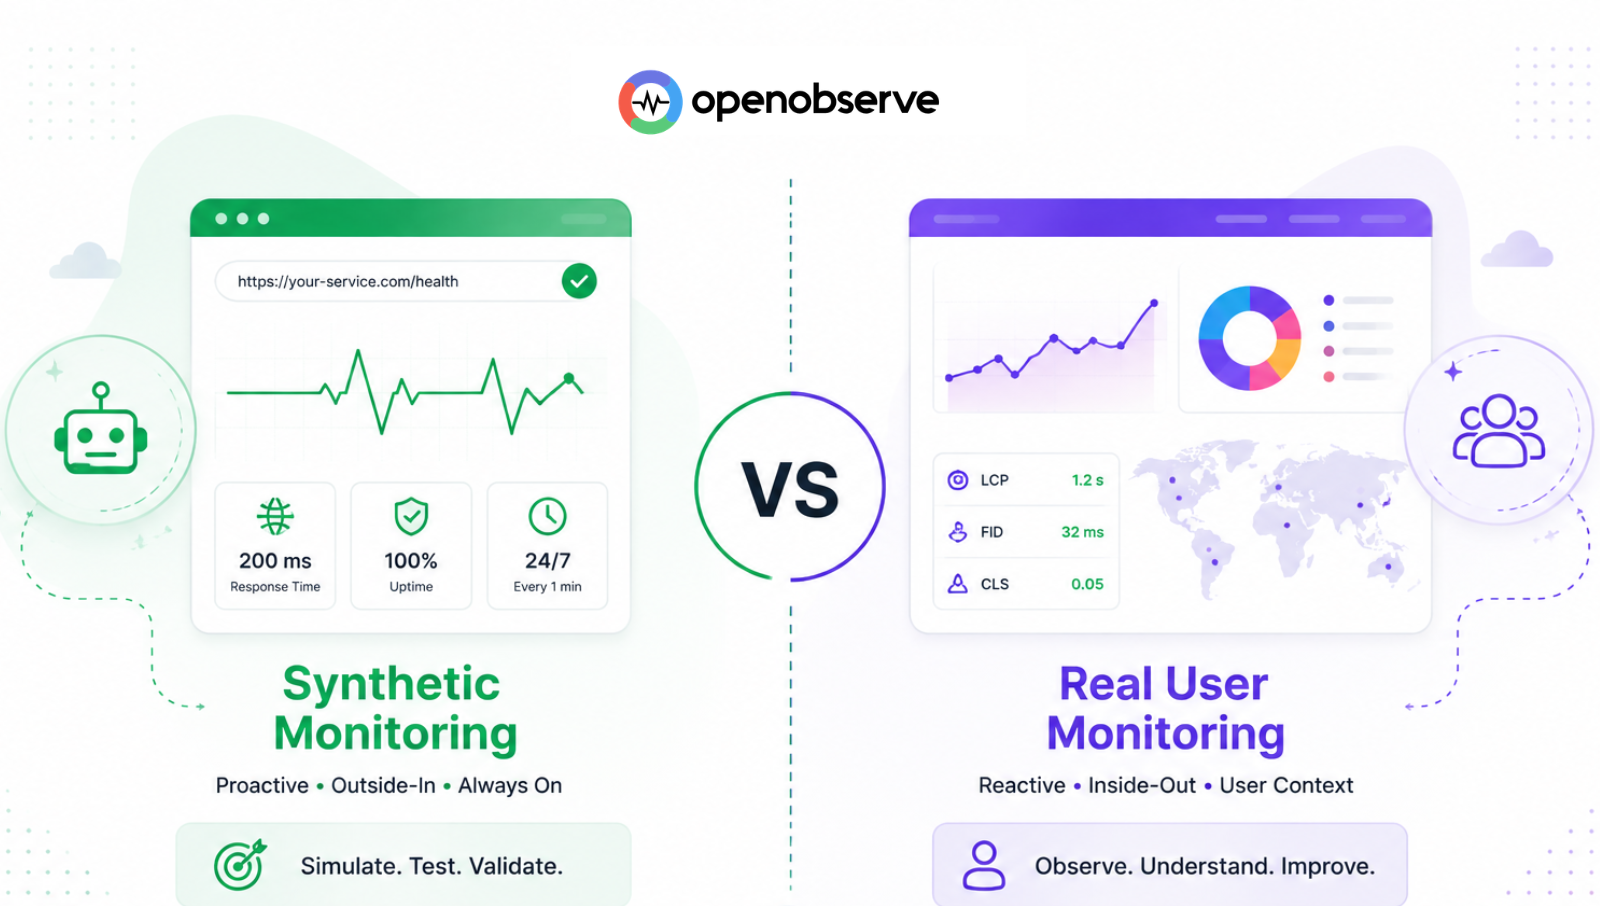
Your homepage returns a 500 error at 3 a.m. Zero visitors are on the site, so no one notices, no error log fires, and Real User Monitoring has nothing to report, because RUM only sees what real users trigger, and no real user has shown up yet. Two hours later, traffic picks up, the first support tickets land, and RUM finally shows the error spike: two hours after the failure started, and about zero minutes before your first angry customer.
That gap is the whole story of synthetic monitoring vs. RUM. They are not competing tools measuring the same thing two different ways; they are two different vantage points on your system, and understanding what each one can and can't see is what separates an alerting strategy that catches failures from one that just documents them afterward.
Related: For a deep dive into tuning RUM in production, see Optimizing OpenObserve RUM; for what's new in OpenObserve's synthetic checks, see Synthetic Monitoring Comes to OpenObserve; and for how the major synthetic monitoring platforms stack up against each other, see Best Synthetic Monitoring Tools in 2026.
TL;DR
Synthetic monitoring runs scheduled, outside-in checks that catch failures even when no real user is around to trigger them. RUM captures what real visitors actually experience, but only once they show up. Neither one covers the other's blind spot, so the answer isn't picking one, it's running both.
- Synthetic monitoring: proactive, traffic-independent, scripted HTTP, TCP, TLS, SSH, and browser checks.
- RUM: reactive, traffic-dependent, real sessions, Core Web Vitals, and session replay from actual visitors.
- Both are needed: OpenObserve ships synthetic checks and RUM natively in one platform, alongside your logs, metrics, and traces.
What Is Synthetic Monitoring?
Synthetic monitoring is scheduled, scripted testing of your systems from the outside, run on a timer, not in response to real user traffic. A synthetic check doesn't wait for a customer to load a page or hit an API; it dials in on its own schedule, HTTP, TCP, TLS, SSH, or a full Playwright browser script, and reports what it found.
That independence from real traffic is the entire point. A system that's down can't alert on its own downness, and a page nobody has visited in the last ten minutes can't generate a RUM error either. Synthetic checks fill exactly that blind spot: they exist to notice failure before a real user does.
How Do Synthetic Checks Work?
Strip away any specific vendor's UI and every synthetic check follows the same basic lifecycle:
- You define a target and a schedule. A URL, a host and port, a certificate, or a scripted browser flow, plus how often it should run: every minute, every five minutes, whatever cadence matches how quickly you need to know.
- A probe executes the check on that schedule. The probe runs independently of your application, from an external location or an agent you control, and it fires whether or not a single real user is around.
- The result is evaluated against assertions. Did the response come back with the right status code, within an acceptable latency, with the expected body, with a certificate that isn't about to expire, or, for a browser flow, did every step complete the way it was scripted to?
- A pass or fail is recorded, along with timing data and, on failure, whatever diagnostic detail the tool captures: the response received, the step that broke, sometimes a screenshot.
- Failures route to alerting, usually with some logic to avoid paging on a single blip, such as requiring a failure to repeat across a location or a retry before it's treated as real.
That loop, schedule, execute, assert, record, alert, is what makes synthetic monitoring proactive: it runs on its own clock, not on your users' clocks.
The check types that make up synthetic monitoring
- HTTP checks: verify an endpoint responds with the right status code, response body, and latency.
- TCP checks: confirm a port is open and accepting connections.
- TLS checks: validate the certificate is valid and catch expiry before it takes down every client that talks to you.
- SSH checks: confirm SSH connectivity to a host is up.
- Browser checks: run a scripted, multi-step browser flow, built from code or captured by clicking through it once, to validate an entire user journey (log in, add to cart, check out) rather than a single endpoint.
Benefits of Synthetic Monitoring
- Catches outages before real users do. A scripted check doesn't need traffic to run, so it can fail (and page on-call) at 3 a.m. on a page nobody has visited yet.
- Consistent, repeatable baseline. The same check runs the same way every time, which makes it reliable for uptime tracking and SLA verification.
- Validates before launch. You can test a critical journey like checkout against a script before any real customer ever touches it.
- Reaches internal endpoints. A private, outbound-only agent inside your network can run the same checks against staging, admin tools, and internal APIs that never generate enough organic traffic for RUM to say anything useful.
- Low-noise signal. Because the path is fixed, a failure means the fixed path broke, not "some unknown fraction of unrelated user behavior changed."
Limitations of Synthetic Monitoring
- Only as good as what you scripted. A check only tests the exact paths, clicks, and assertions you wrote; it has no idea about the ten other ways a real user might use your product.
- Blind to real-world diversity. Probes run from a fixed set of locations and environments, not the full spread of devices, browsers, and network conditions your actual users have.
- Can't quantify business impact. A failed check tells you something broke; it can't tell you how many paying customers that actually affected.
- Scripts go stale. As your UI changes, browser check scripts and recorders need upkeep, or they start failing on outdated selectors instead of real bugs.
What Is RUM (Real User Monitoring)?
RUM is the inside-out counterpart to synthetic monitoring. Instead of a scripted probe, a small SDK runs in the browser of every real visitor and records what actually happens to them: page load times, Core Web Vitals like LCP and INP, JavaScript errors, API call performance, and, when enabled, a pixel-level session replay of exactly what the user saw and clicked.
RUM's strength is also its limit: it only reports on traffic that actually exists. A page with no visitors generates no RUM data, a bug in a code path nobody has exercised yet stays invisible, and an outage that started before anyone loaded the page shows up in RUM only once someone does.
How Does RUM Work?
RUM doesn't generate its own traffic; it observes traffic that's already happening. The general mechanism looks the same across implementations:
- A small SDK loads with the page (or the app, for mobile). It doesn't wait for anything special; it initializes as early in the page lifecycle as it can.
- It hooks into APIs the browser already exposes: Navigation and Resource Timing for load performance, the Performance Observer API for Core Web Vitals like LCP and INP, global error handlers for JavaScript exceptions, and the fetch/XHR layer for network call timing. Nothing is simulated; everything reflects what actually ran.
- Events are batched and sent asynchronously, typically via
sendBeaconor a background XHR/fetch call, so recording telemetry never blocks the page the user is trying to use. - Events are stitched into a session using a session identifier, so a page view, the actions inside it, any errors, and the resources it loaded all reconstruct into one coherent story after the fact, rather than arriving as disconnected data points.
- Optionally, the visual layer is recorded too: a session replay captures DOM mutations or pixel data as they happen, so the session can be played back later.
Because every step in that chain rides along with a real visitor, RUM data is a byproduct of real usage. No visitor, no session, no data, which is the tradeoff for it being ground truth when a visitor does show up.
Benefits of RUM
- Reflects reality, not a script. Every device, browser, network, and geography your actual users have shows up automatically, no one had to think to test it.
- Quantifies real impact. RUM ties a slowdown or error to the exact number of real sessions it touched, and whether those users converted anyway.
- Covers every path, not just scripted ones. Users find the paths through your product you never thought to test, and RUM sees all of them.
- Field data for Core Web Vitals. Search engines weight real-world, field Core Web Vitals data, which by definition only RUM can produce, not a synthetic check.
- Session replay for exact repro. When a bug report comes in, you can watch the actual session instead of trying to guess the steps that caused it.
Limitations of RUM
- Needs real traffic to say anything. A page, feature, or off-hours window with no visitors produces no RUM data, whether or not something is broken.
- Reactive by definition. By the time RUM shows you an error spike, real users have already hit it; there's no way for RUM to warn you before the fact.
- Can't test what doesn't exist yet. There's no real user session to capture for a feature that hasn't launched.
- Blind to low-traffic internal systems. Staging environments and internal tools rarely get enough real sessions for RUM data to be statistically meaningful.
- Full capture adds cost. Recording every session and replay at 100% gets expensive fast, which is why sampling and filtering matter in production.
Synthetic Monitoring vs. RUM: Key Differences
| Synthetic Monitoring | RUM | |
|---|---|---|
| Data source | Scripted checks from external or private probes | Real visitors' browsers |
| Runs when | On a fixed schedule, 24/7, traffic or not | Only when a real user shows up |
| Best at | Catching outages before users see them | Measuring what users actually experienced |
| Needs real traffic? | No | Yes |
| Coverage | Only the paths you script | Every page and flow real users actually touch |
| Typical signals | HTTP status, latency, TLS expiry, SSH connectivity, browser flow pass/fail | Page load time, Core Web Vitals, JS errors, session replay |
| Detects issues | Proactively, before impact | Reactively, as impact happens |
When to Use Synthetic Monitoring vs. RUM
Reach for synthetic monitoring when:
- You need to know about an outage before your customers do, including overnight and on low-traffic pages.
- You're validating a deploy or a critical journey like checkout before real users touch it.
- You're tracking uptime and SLA compliance with a consistent, repeatable check.
- You need to catch a TLS certificate before it expires.
- You're monitoring internal admin tools, staging environments, or APIs that don't get enough organic traffic for RUM to say anything useful.
Reach for RUM when:
- You need to know how slow your app actually feels on a mid-range Android phone on a 3G connection, not just from a probe's data center.
- You're debugging a bug report and need to see the exact session, clicks and all, that triggered it.
- You need to quantify business impact: how many real users hit an error, and did they convert anyway.
- You're tracking Core Web Vitals for SEO, which depends on real-world, field data by definition.
Why You Need Both: Outside-In Meets Inside-Out
Synthetic monitoring and RUM aren't really in competition; they cover opposite blind spots. Synthetic monitoring catches the failure RUM structurally cannot: the outage with no witnesses, the expiring certificate, the internal endpoint with too little traffic to generate a meaningful RUM sample, the checkout flow that breaks before launch. RUM catches what synthetic monitoring structurally cannot: the slow experience on a device and network combination no one thought to script, the unscripted path a real user actually took, the precise count of how many paying customers a five-minute blip actually touched.
Run only synthetic checks, and you'll catch outages fast but have no idea how real users actually experience your product day to day. Run only RUM, and you'll understand real user experience in detail, but you'll find out about outages from support tickets instead of alerts. Together, they cover the full loop: synthetic monitoring tells you something is wrong, RUM tells you who it's hurting and how badly.
How OpenObserve Implements Synthetic Monitoring and RUM
Everything above is the vendor-neutral shape of synthetic monitoring and RUM: what each one is, how it works, and why neither substitutes for the other. This section is the dedicated rundown of how OpenObserve specifically builds both, and how it puts them in one platform instead of two.
OpenObserve Synthetic Monitoring
OpenObserve's synthetic checks cover HTTP, TCP, TLS, and SSH, each with per-type assertions like status code, latency, response body, and certificate expiry, plus full browser checks that run real @playwright/test scripts or a no-code recorder you click through once.
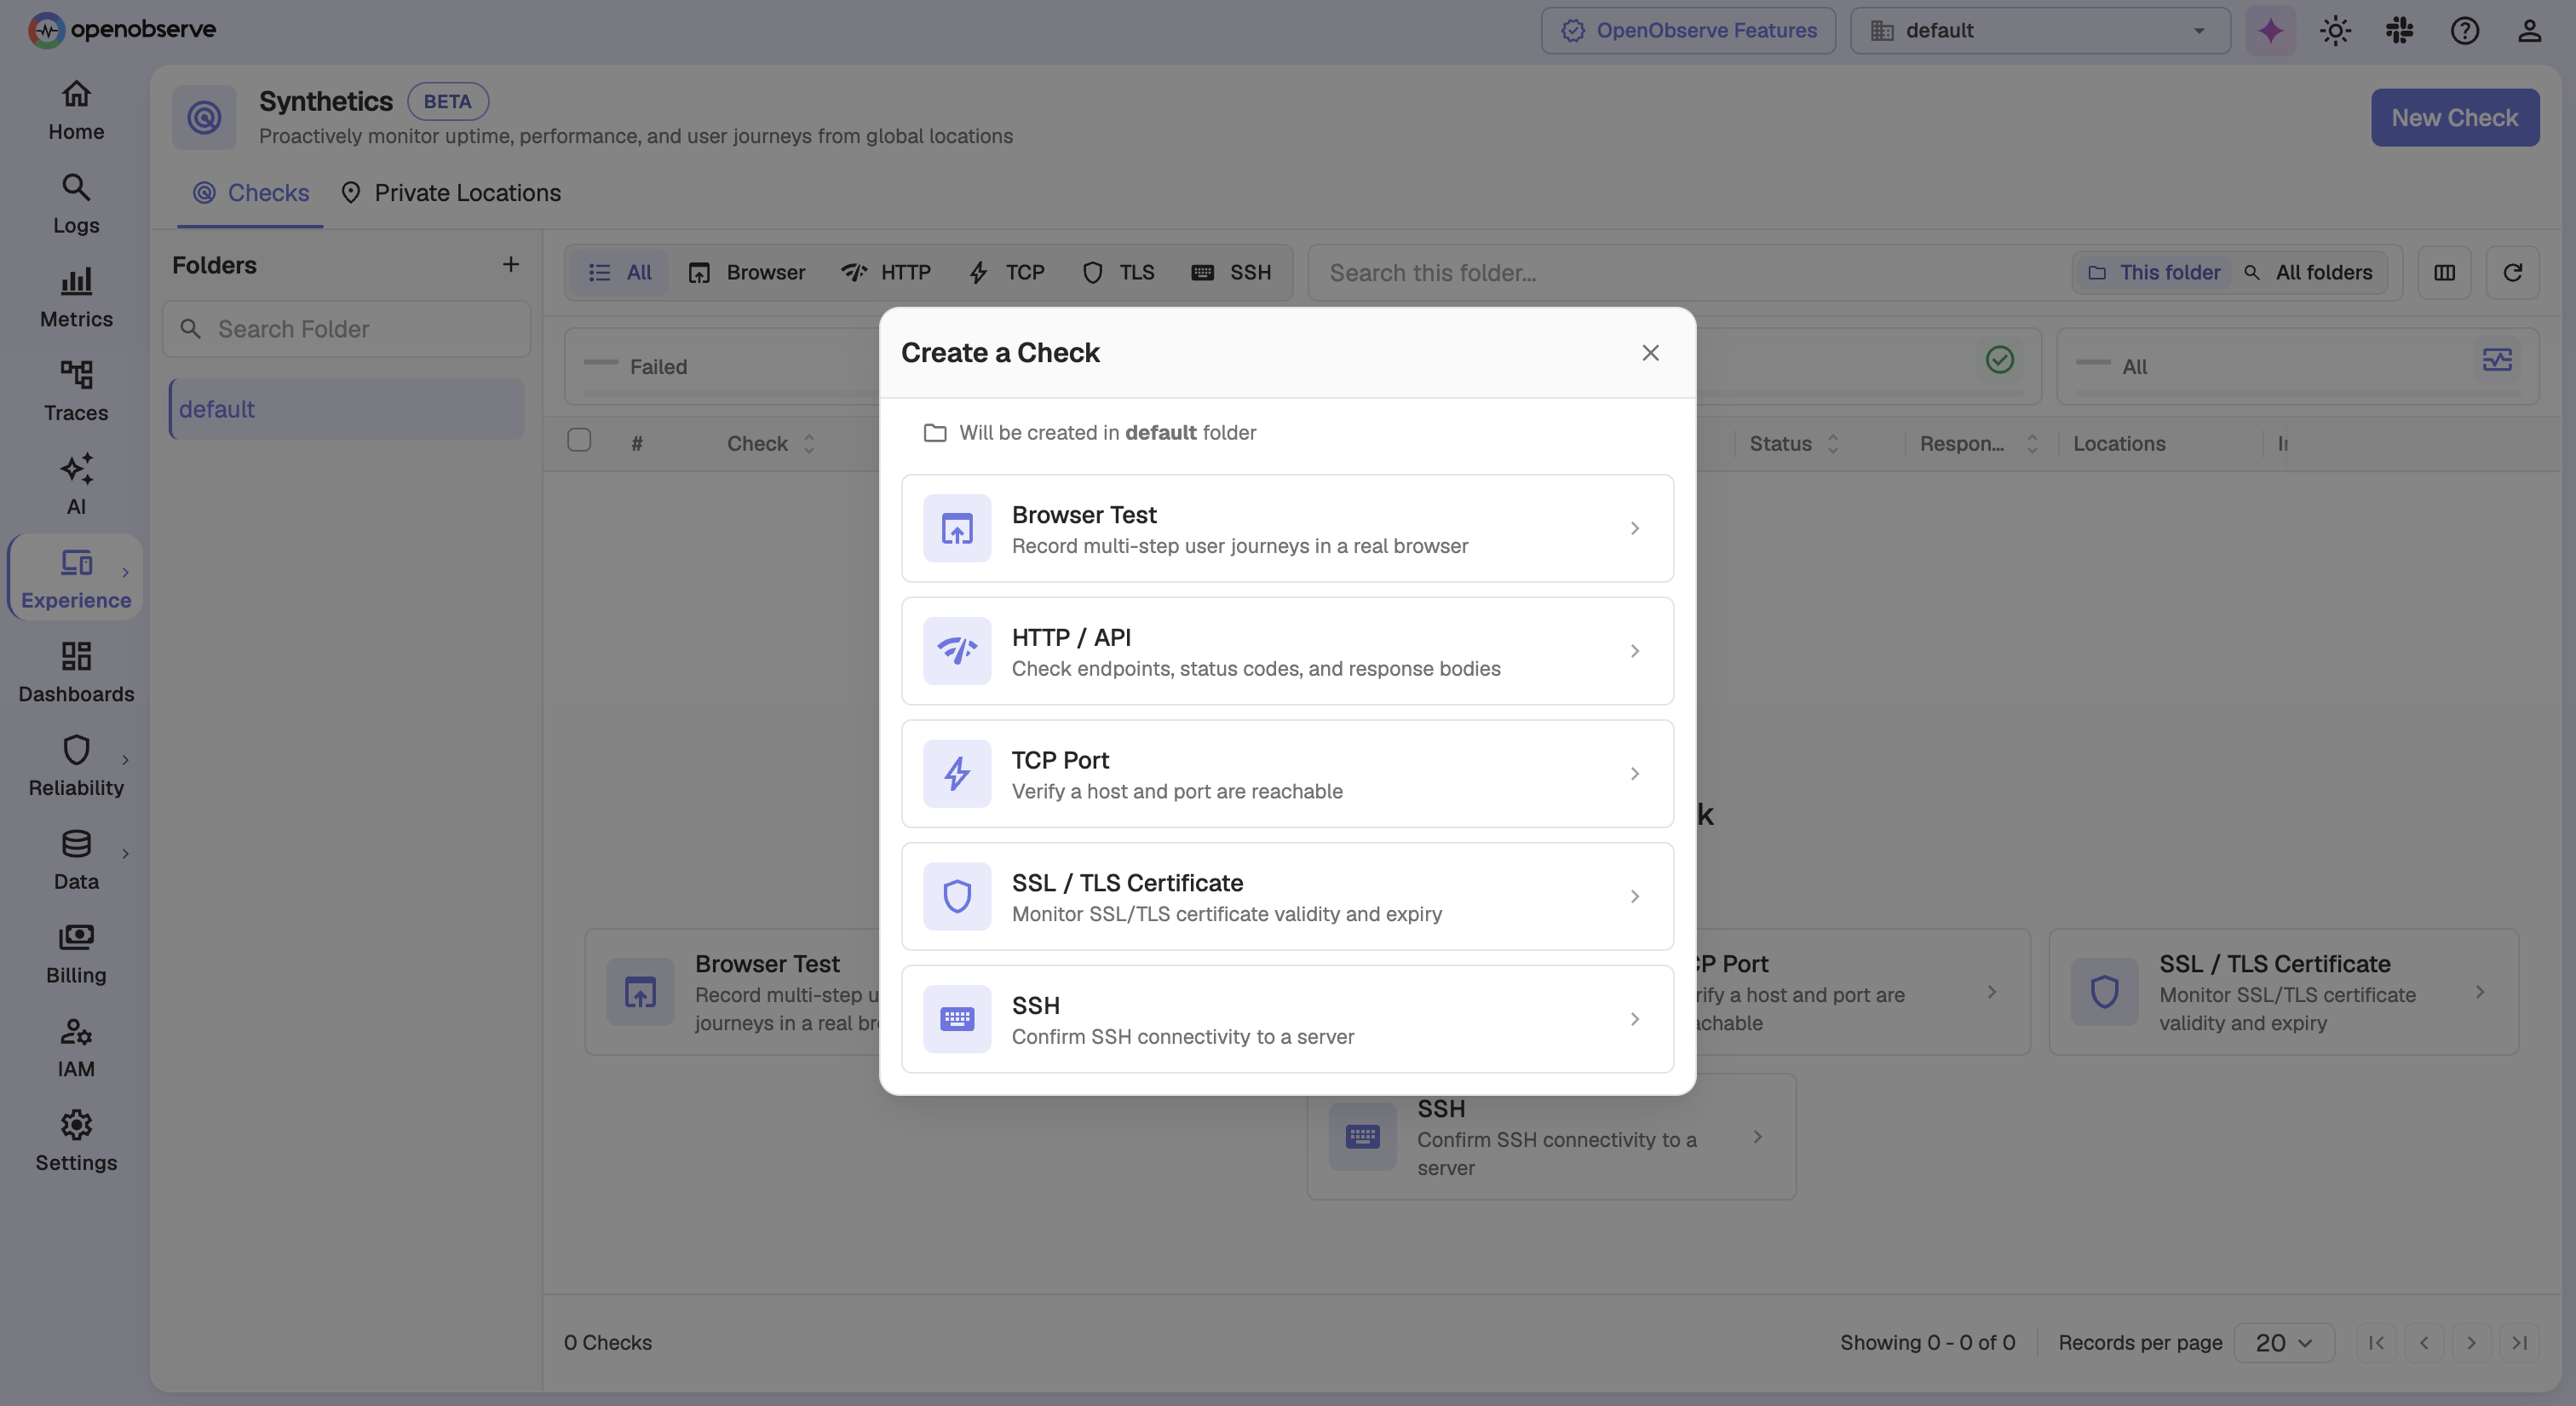
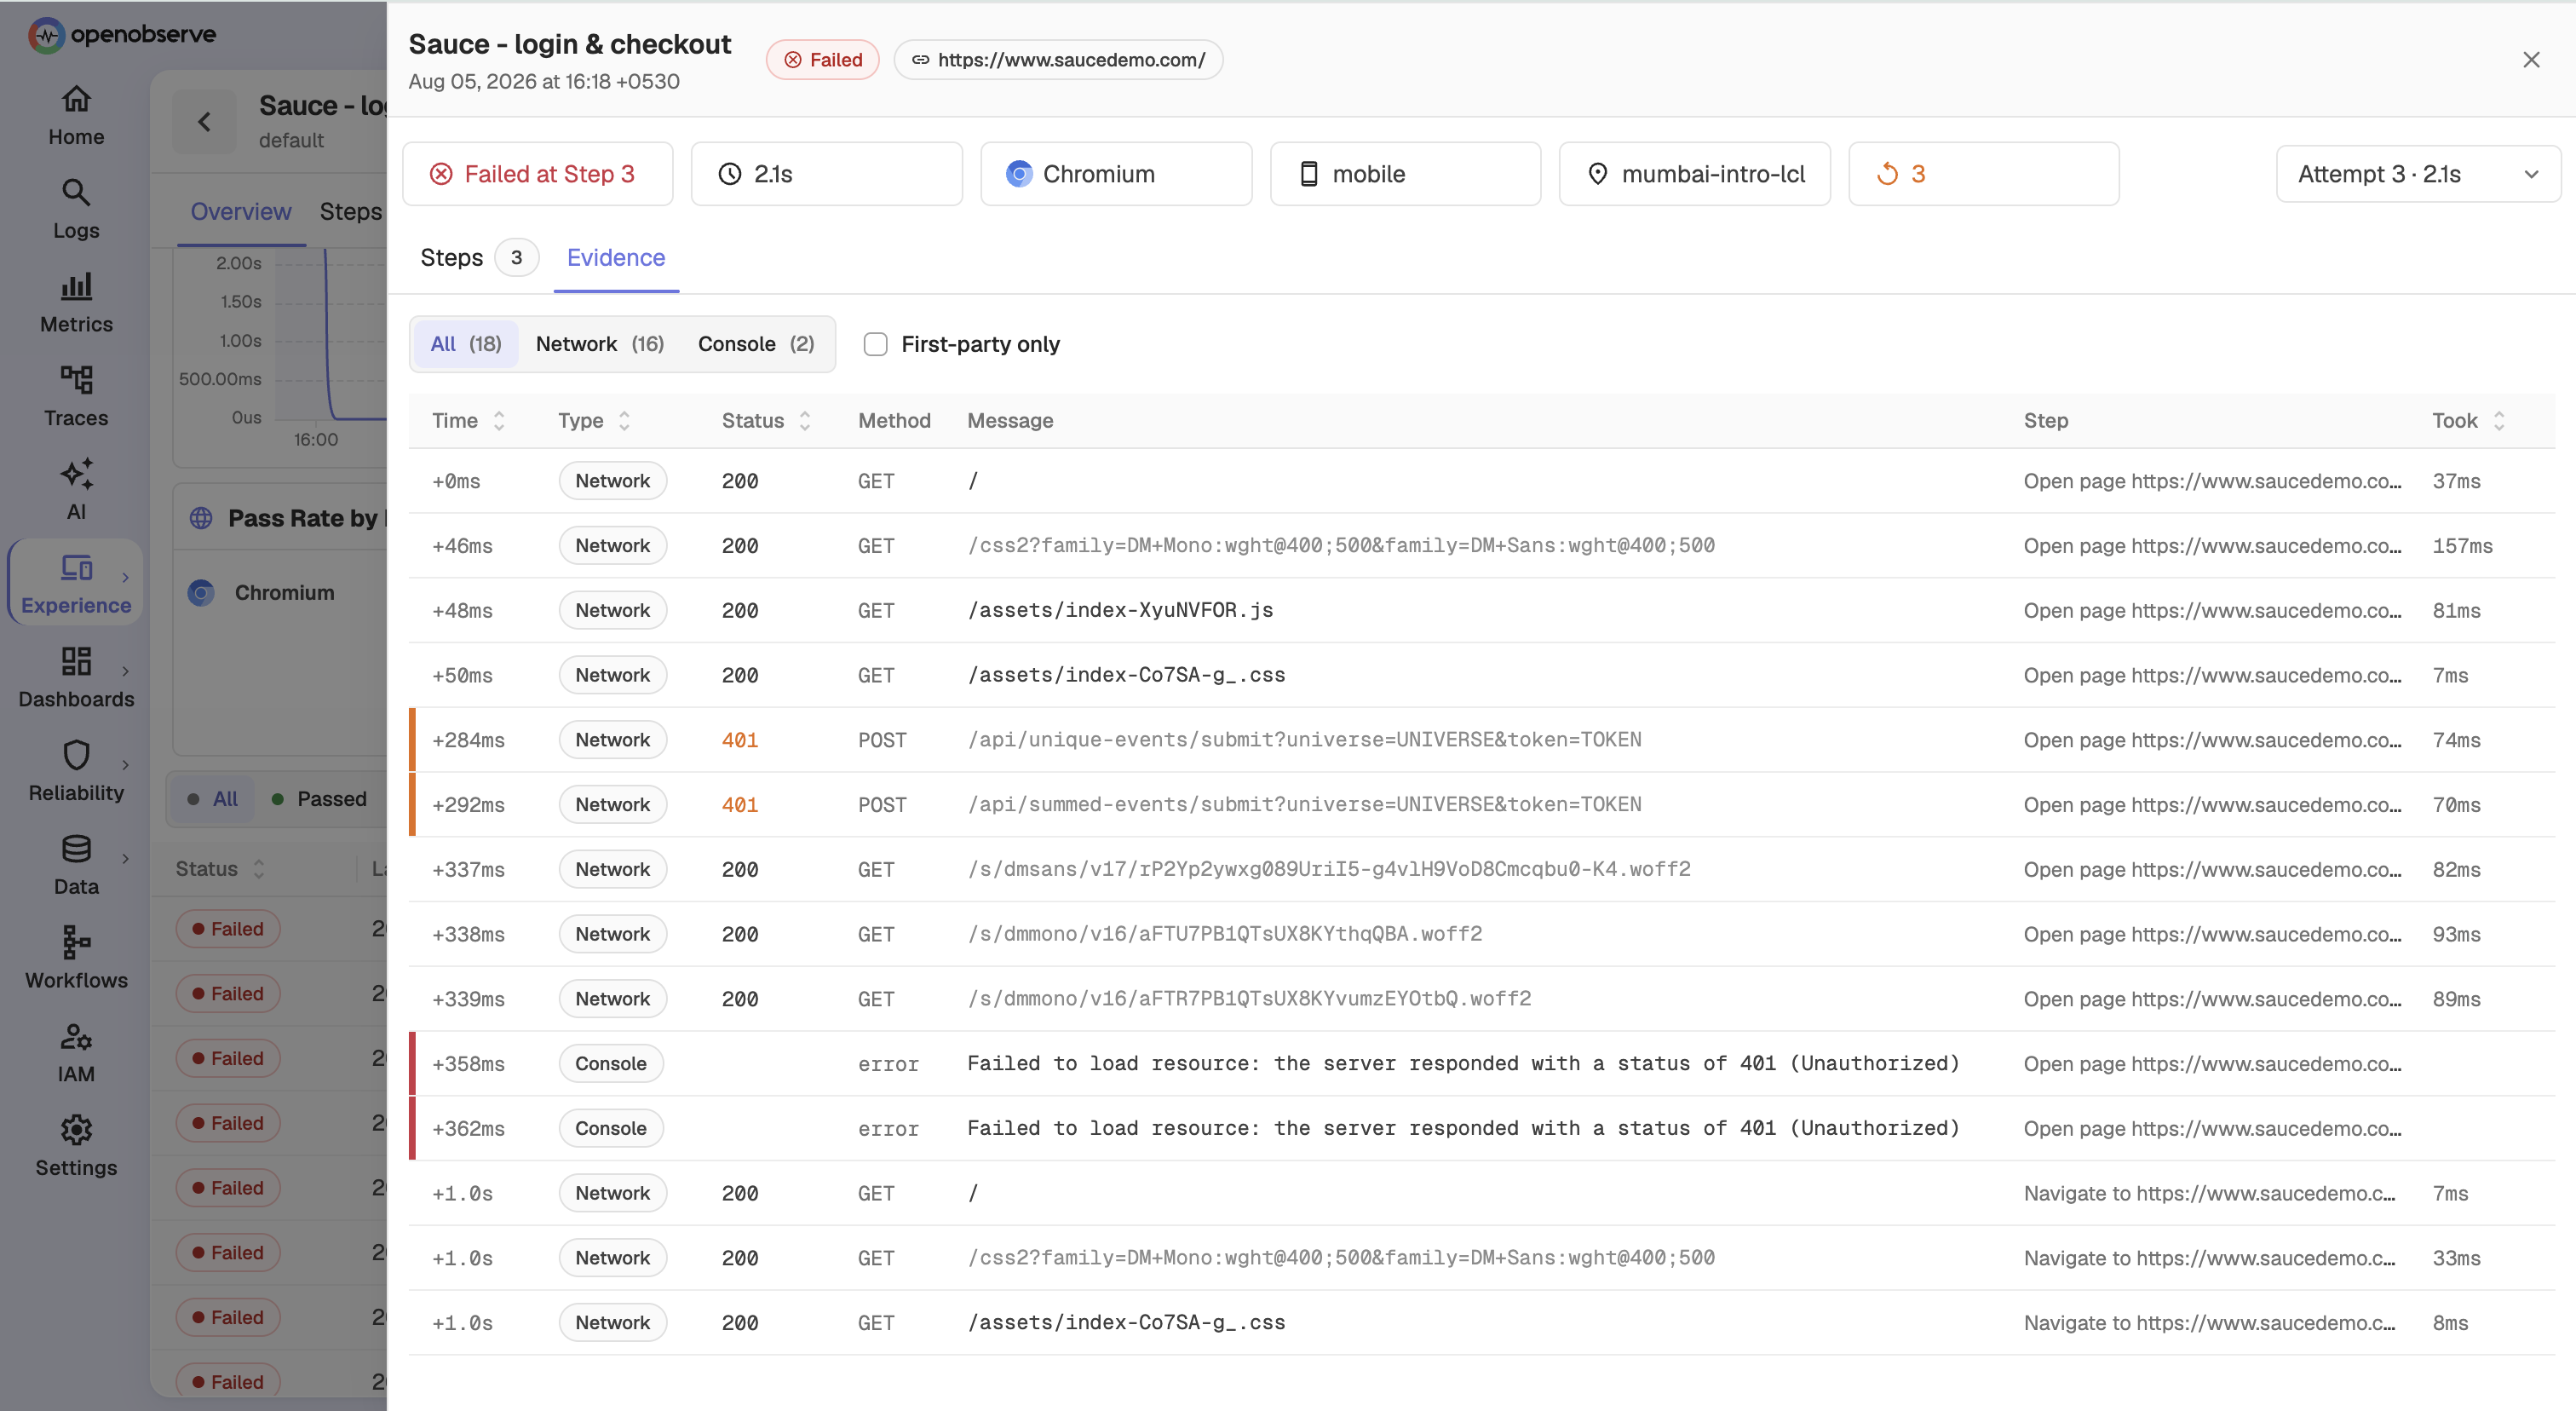
For endpoints a public probe can't reach, staging, internal admin tools, anything behind a firewall, Private Locations run the same checks from a lightweight agent inside your network, connecting outbound over HTTPS only, no inbound port required. When a check does fail, you get a per-step evidence panel: what the check did, where it broke, and a screenshot of the exact moment, so you're reading the failure instead of trying to reproduce it.
OpenObserve RUM
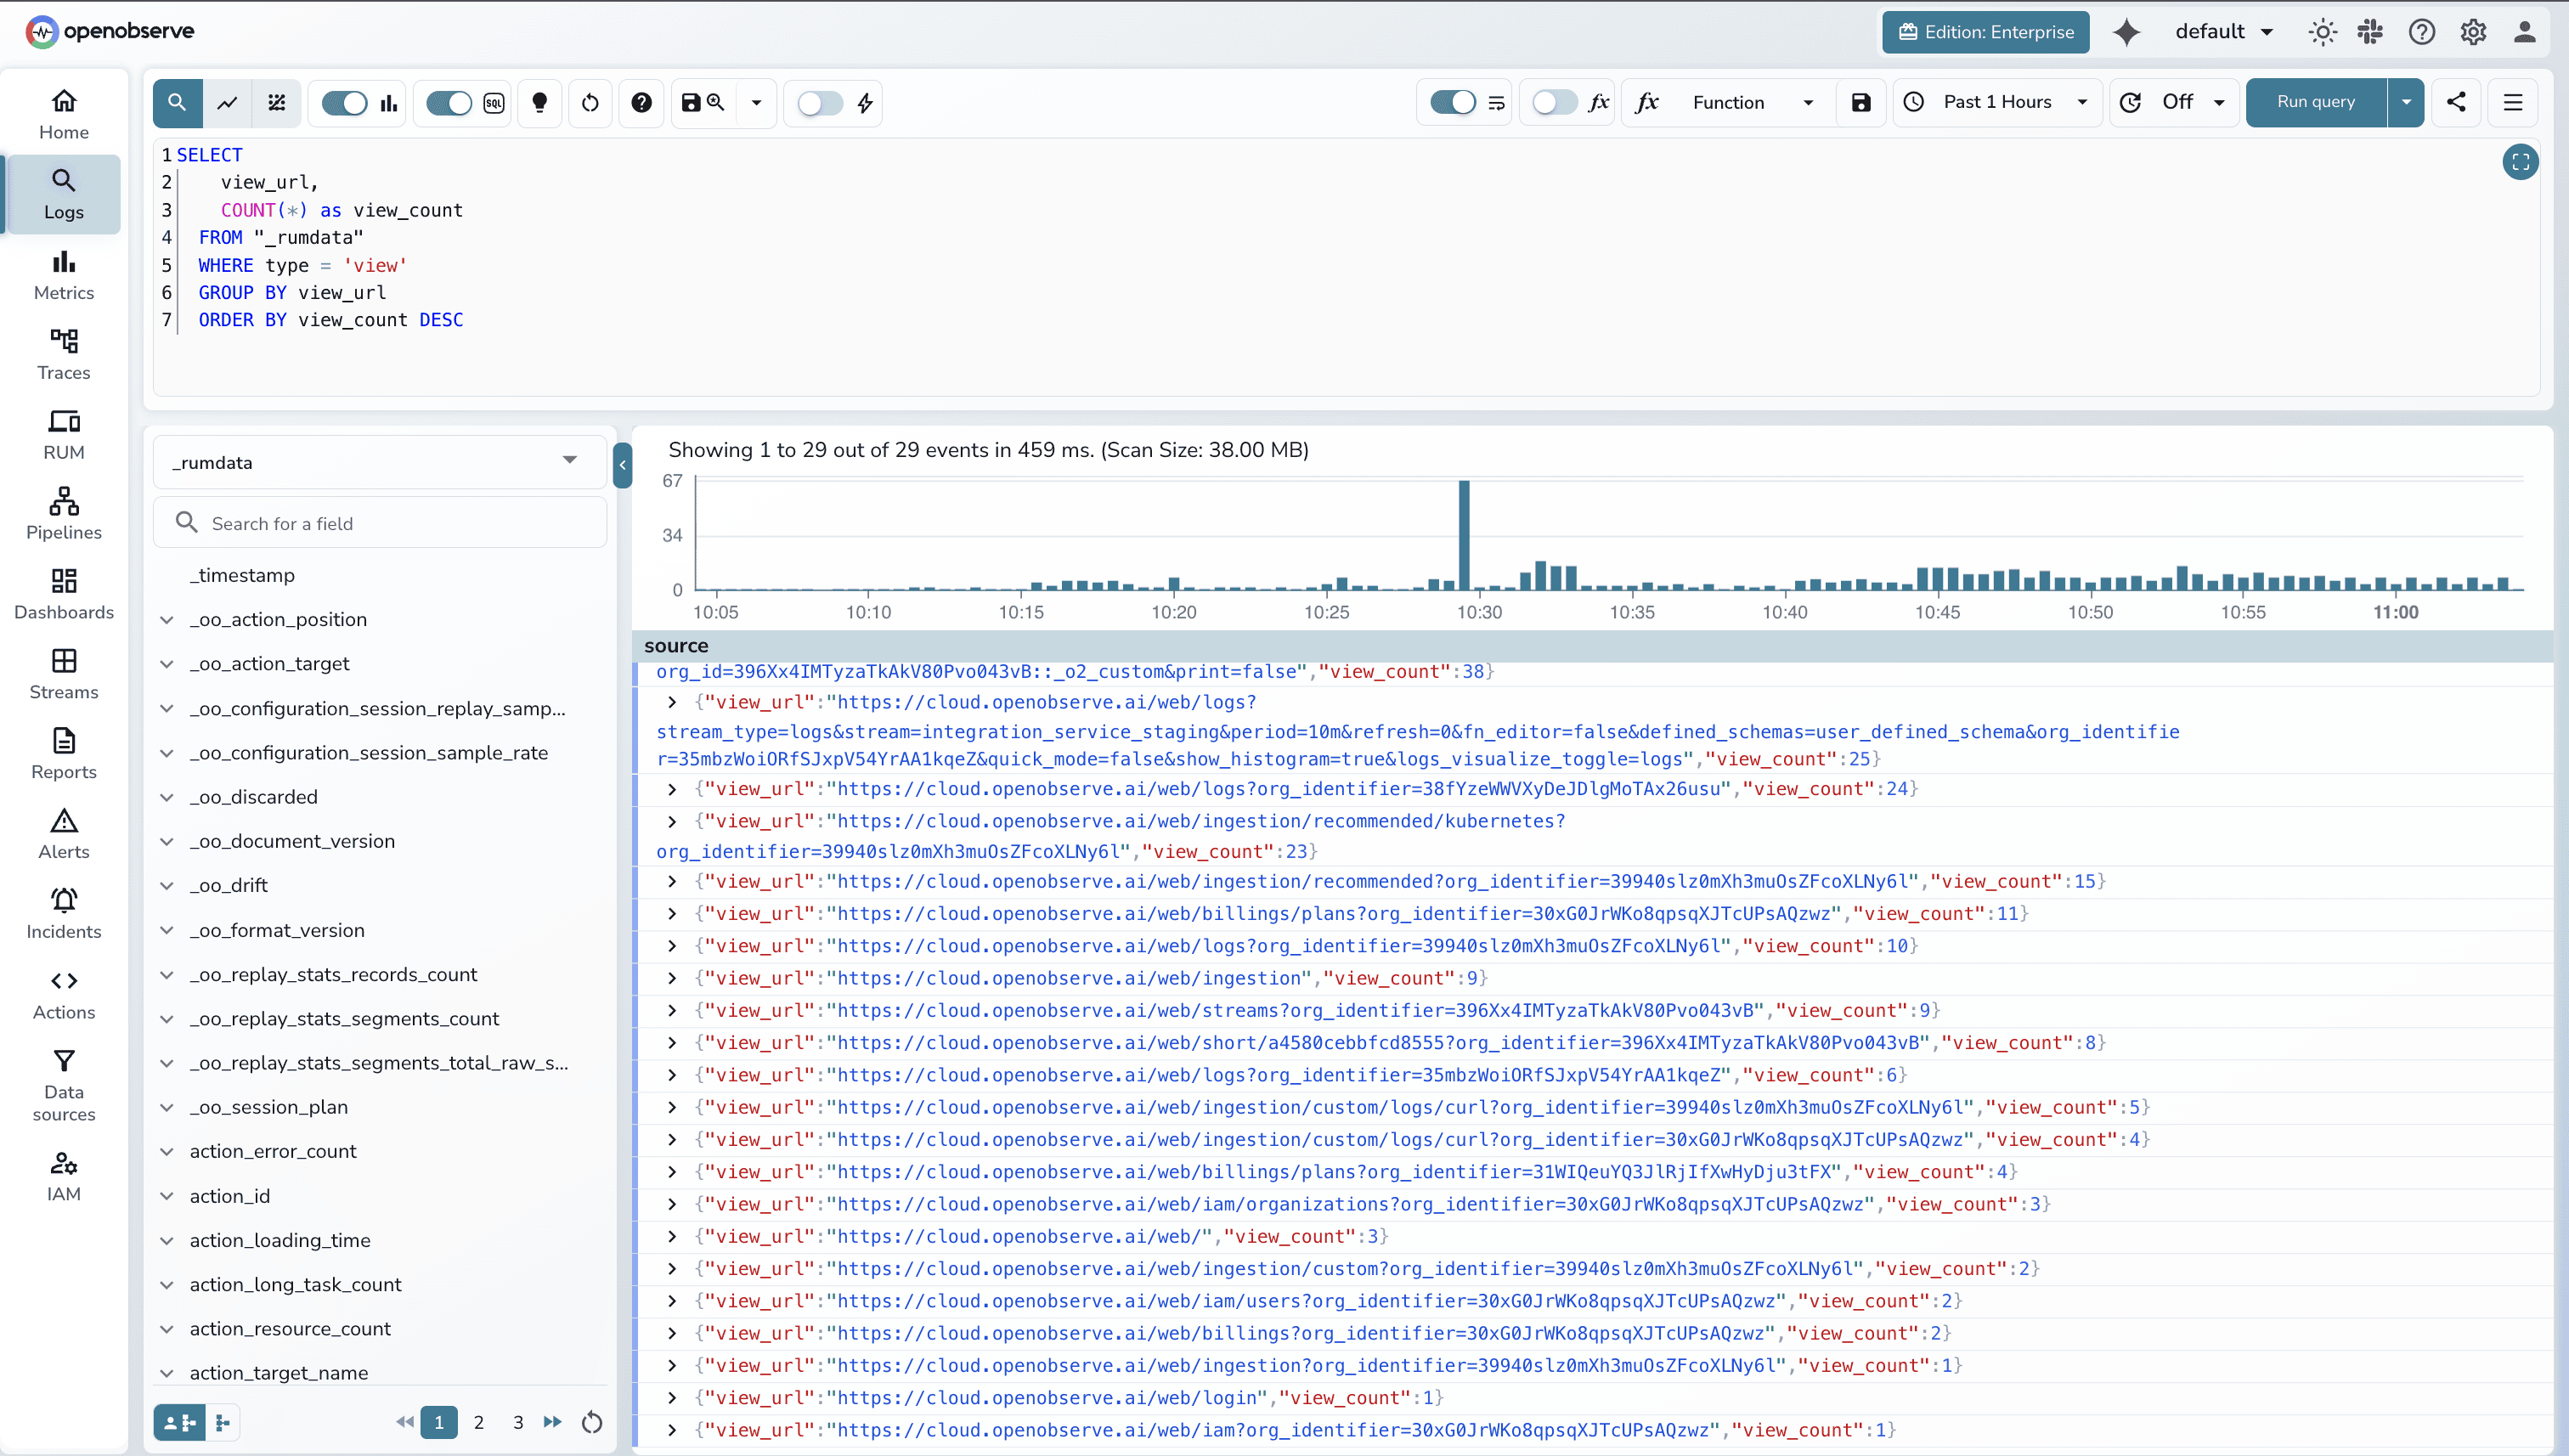
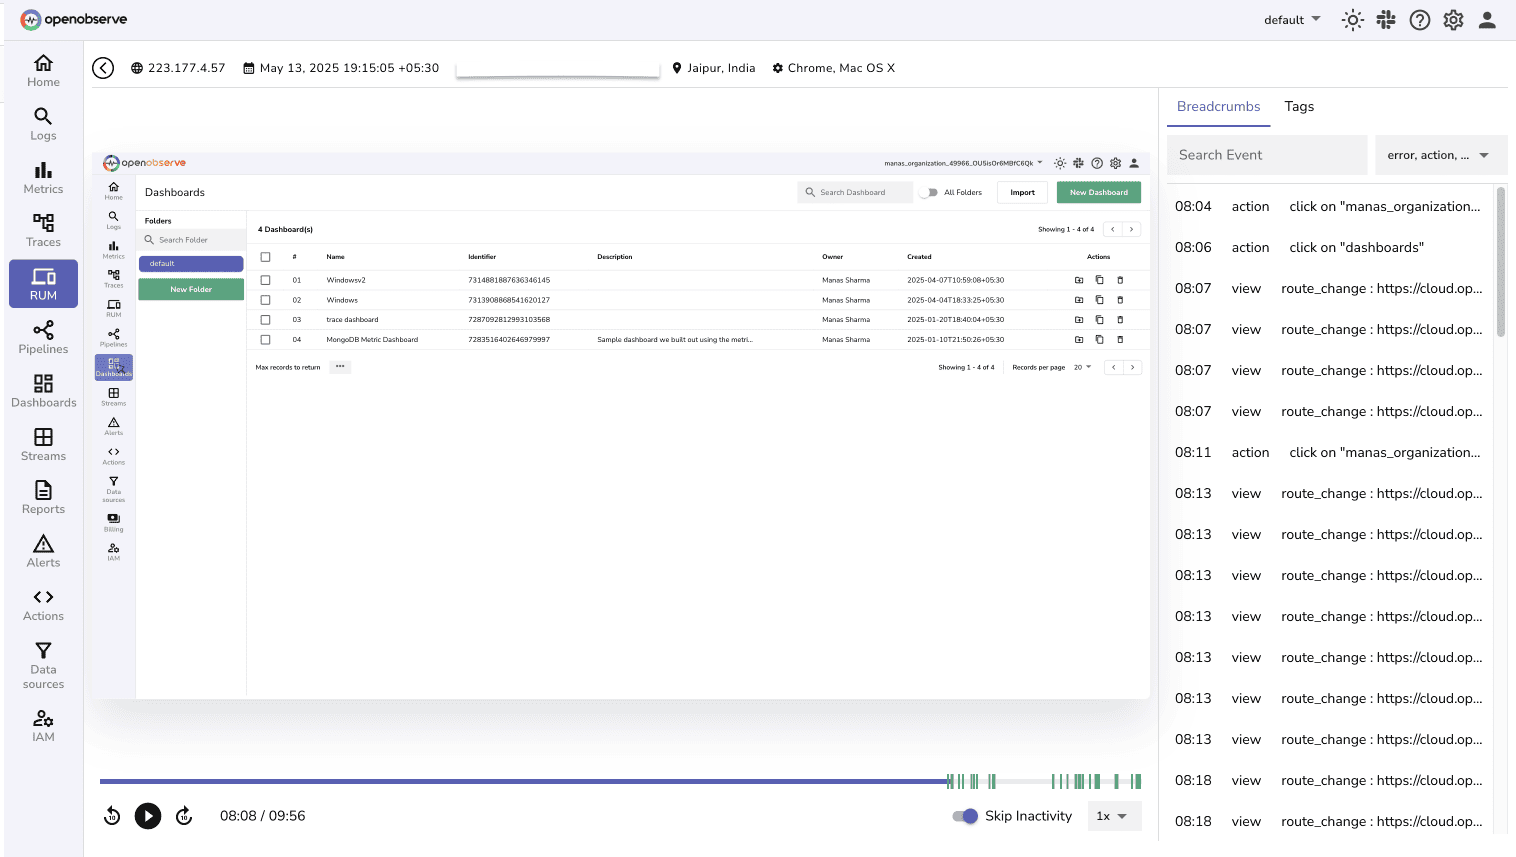
OpenObserve RUM captures page loads, Core Web Vitals, JavaScript errors, and session replay like any RUM SDK, but treats the result as structured, SQL-queryable data instead of locking it behind a proprietary query language. You can query sessions and resources directly:
Session replay is available for watching exactly what a user saw and clicked:
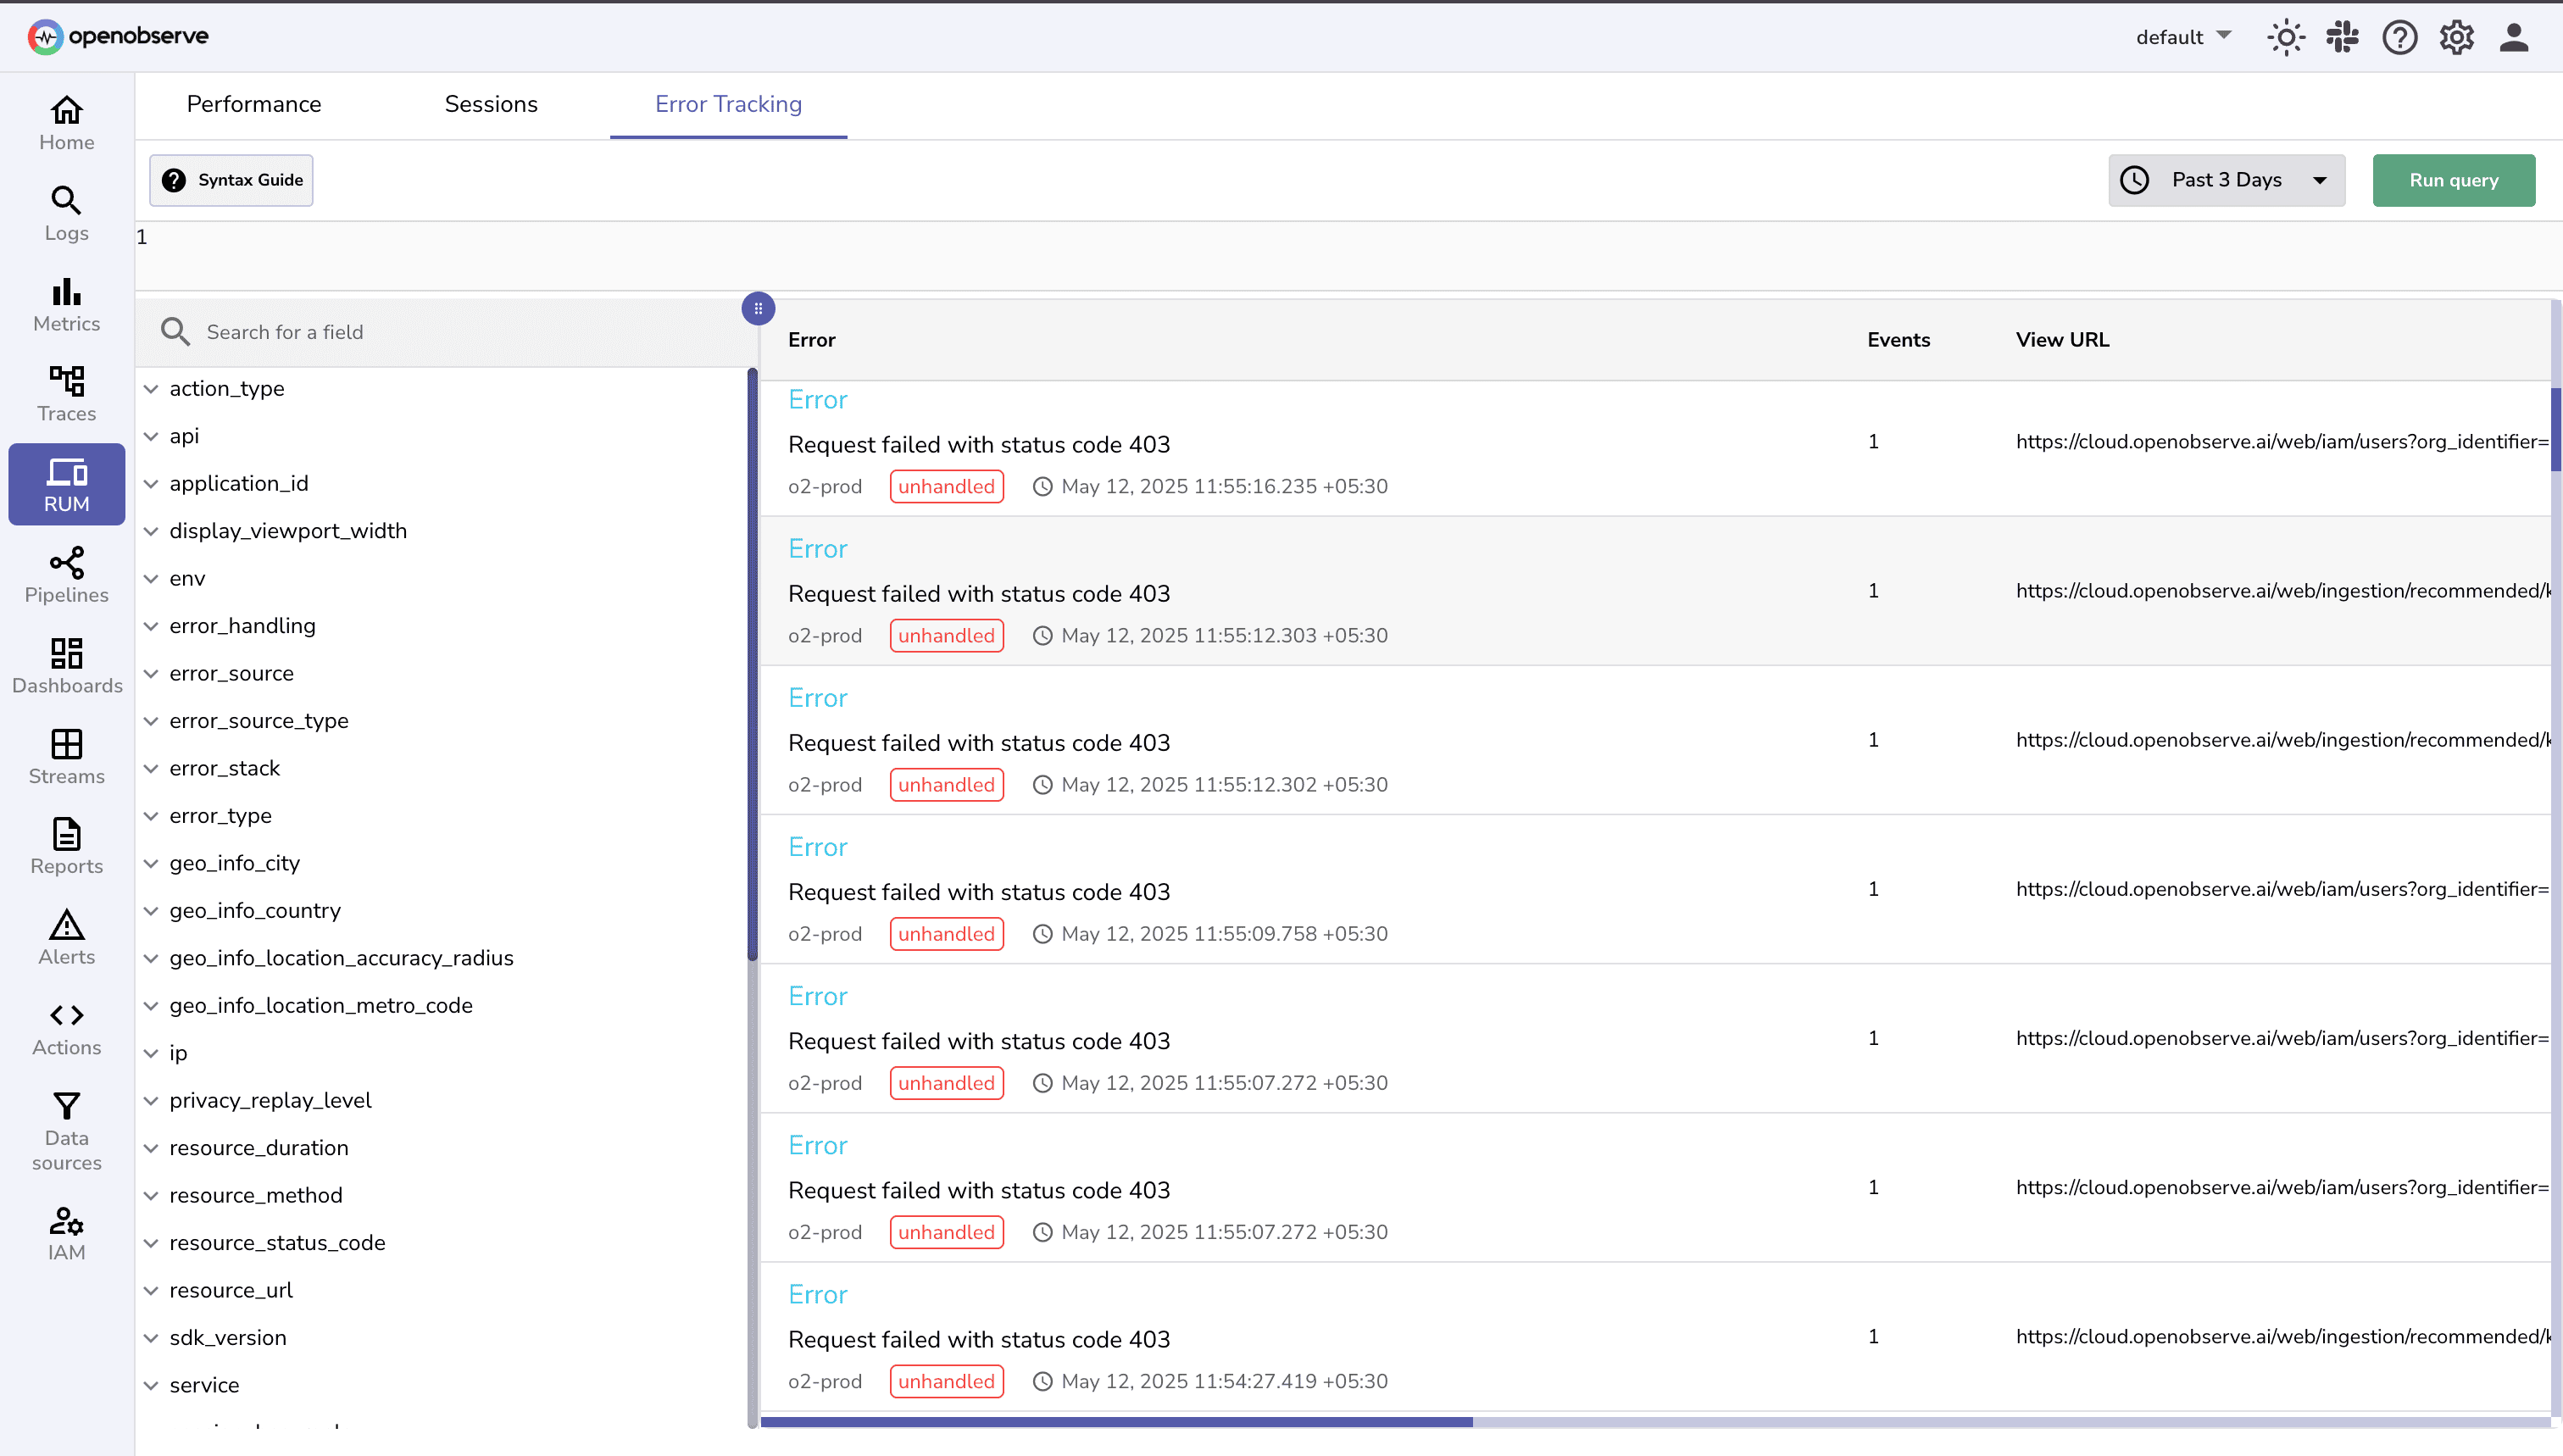
And JavaScript errors get the same SQL-based aggregation, by message, affected session, affected user, and performance impact, instead of a fixed set of pre-built views:
Where They Meet
Most tools sell synthetic monitoring and RUM as separate products, sometimes on separate pricing tiers, sometimes as genuinely separate tools you have to correlate by hand. Datadog, for example, bills synthetic checks per test run, a meter that's entirely independent of RUM's per-session pricing. OpenObserve puts both in the same Experience section of the same platform, next to each other, not bolted together after the fact.
In practice, that means synthetic check results land in a native synthetics_results stream, while RUM sessions, views, actions, errors, and resources land in their own streams right alongside your logs, metrics, and traces, not in a siloed third-party dashboard. Both are stored in the same columnar backend and queried with the same SQL, so you can join a spike in failed synthetic checks against the RUM sessions and backend traces happening in that same window without exporting anything or matching timestamps by hand. Alerts on either one use the same alerting engine, templates, and destinations you already have configured, and the same RBAC governs who can see what, so adding synthetics or RUM to a team's workflow doesn't mean standing up a second permissions model.
Final Thought
Synthetic monitoring and RUM answer different questions: "is it up?" and "what did it feel like?" Treating them as substitutes leaves a gap on one side or the other. Treating them as a pair closes it.
That pairing is exactly what OpenObserve is built for. It's a unified, open-source observability platform, logs, metrics, traces, RUM, and Synthetic Monitoring, all in one place, all queryable with SQL, all covered by the same alerting and RBAC. You're not stitching together a separate synthetics vendor and a separate RUM vendor and hoping the timestamps line up; both ship as native parts of the same product, with OpenObserve's columnar storage keeping the cost of holding all that telemetry low enough to actually retain it long-term instead of sampling it away. Run it as a 14-day cloud trial or self-host it from the open-source repo, either way you're looking at the same platform.
Want to see both in one platform? Try OpenObserve free, read the Synthetic Monitoring release notes, or dig into optimizing OpenObserve RUM for cost, performance, and privacy tuning. For the fundamentals of frontend monitoring more broadly, see Frontend Monitoring Basics.
Get Started with OpenObserve Today!
Sign up for a 14 day cloud trial. Check out our GitHub repository for self-hosting and contribution opportunities.
Frequently Asked Questions
About the Author
Simran Kumari

Passionate about observability, AI systems, and cloud-native tools. All in on DevOps and improving the developer experience.
Follow OpenObserve on Google
Add OpenObserve as a preferred source to see more of our articles in Google Search and Top Stories.












