Self-Hosted vs SaaS vs BYOC Observability: Which Should You Choose?




Ready to get started?
Try OpenObserve Cloud today for more efficient and performant observability.
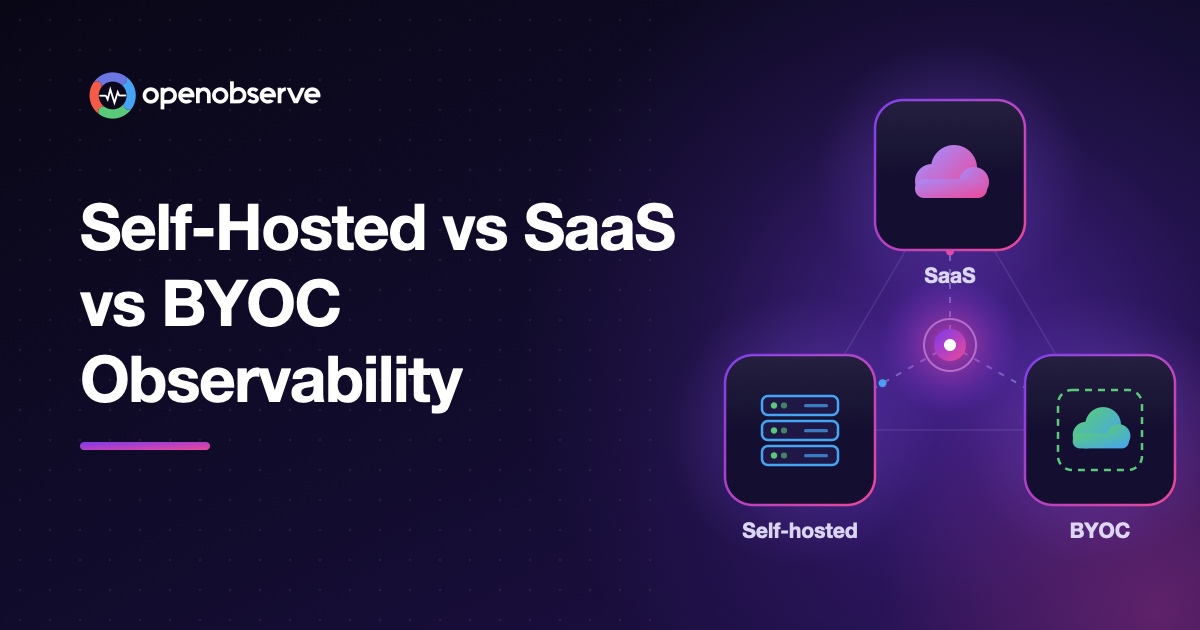
Self-hosted vs SaaS observability is a trade between control and effort. SaaS means the vendor runs everything and you pay per use; self-hosted means you run the platform on your own infrastructure and own every upgrade. BYOC sits between them: the vendor operates the platform inside your cloud account. The right choice depends on volume, compliance, and your team's capacity.
TL;DR
- Lowest effort: SaaS. Nothing to run, billed per use.
- Most control: self-hosted. Your infrastructure, your data, your upgrades.
- Data in your account, without running the platform: BYOC, or BYOB if only storage needs to live with you.
- Best overall: OpenObserve: the same platform as SaaS or self-hosted, with BYOB on Cloud.
What is the difference between self-hosted, SaaS, and BYOC observability?
The three models differ in who runs the software, where your telemetry is stored, and who gets paged when the observability platform itself breaks.
- SaaS observability is a managed service. You send telemetry to the vendor's endpoint, and the vendor runs ingestion, storage, querying, upgrades, and scaling. You pay a usage fee.
- Self-hosted observability is software you deploy and operate on your own servers, VMs, or Kubernetes clusters. You control configuration and data location, and you own capacity planning, upgrades, and incidents.
- BYOC (bring your own cloud) observability is a deployment model where the platform runs inside your own cloud account but the vendor manages it. Data stays in your account, and the operational work stays with the vendor.
| SaaS | Self-hosted | BYOC | |
|---|---|---|---|
| Who runs the platform | Vendor | Your team | Vendor, in your account |
| Where data is stored | Vendor's infrastructure | Your infrastructure | Your cloud account |
| Who pays for infrastructure | Included in the vendor fee | You | You, plus a vendor fee |
| Time to first data | Minutes | Hours (single node) to days (HA cluster) | Depends on vendor onboarding |
| Upgrades and patching | Vendor | Your team | Vendor |
| Who is on call for the platform | Vendor | Your team | Shared, per contract |
| Customisation | What the vendor exposes | Everything | What the vendor exposes |
| Best for | Teams that want zero maintenance | Teams with strict control or on-prem needs | Teams with residency rules and no platform team |
A fourth option is worth knowing: BYOB (bring your own bucket). The platform stays a managed SaaS, but your telemetry is written to object storage in your own account. It answers "our data must live in our account" without moving the whole platform. BYOB is not BYOC: only the storage moves, not the software.
Is self-hosted observability actually less expensive?
Self-hosting changes what you pay for. With OpenObserve open source, or the Self-Hosted Enterprise edition up to 50 GB per day, there is no licence fee, so the bill is your own infrastructure. Above 50 GB per day, Enterprise adds a licence priced by quote, and with any vendor you also pay for the people who run the platform. With OpenObserve, that infrastructure can be as small as one binary, with data in object storage. And if you'd rather not run anything, OpenObserve Cloud is priced on ingest alone.
Here's what each model costs at three daily log volumes, using published prices only. Monthly volume is daily volume times 30.
| Monthly cost (logs only) | 10 GB/day | 100 GB/day | 1,000 GB/day |
|---|---|---|---|
| OpenObserve Cloud (annual contract, $0.50/GB ingested) | $150 | $1,500 | $15,000 |
| OpenObserve Cloud (pay as you go, $0.70/GB ingested) | $210 | $2,100 | $21,000 |
| Datadog: ingest ($0.10/GB) plus indexing, 30-day retention ($2.50 per million events) | $780 | $7,800 | $78,000 |
| Self-hosted OpenObserve: licence | $0 | $0 (open source) or contact sales | $0 (open source) or contact sales |
| Self-hosted OpenObserve: object storage for 30 days, upper bound | $6.90 | $69 | $690 |
How to read this table:
- OpenObserve Cloud adds $0.01 per GB queried and includes 30 days of log and trace retention and 15 months of metrics retention, with no per-host or per-user fees.
- Datadog is shown with 30-day indexed retention to match OpenObserve Cloud's 30 days of searchable logs, and assumes an average event size of 1 KB, so 1 GB is about 1 million events. Datadog's 15-day indexing rate is $1.70 per million events. Infrastructure Pro ($15 per host per month) and APM ($31 per host per month), both billed annually, are charged on top. (Source: Datadog pricing list, November 2026)
- Splunk doesn't publish per-GB prices for Splunk Cloud Platform: it offers activity-based, ingest, or workload pricing by quote. Splunk Observability Cloud starts at $15 (Infrastructure), $60 (App & Infra), and $75 (End-to-End) per host per month, billed annually. (Source: Splunk pricing pages, November 2026)
- Self-hosted OpenObserve is free as open source (AGPL-3.0). The Self-Hosted Enterprise edition adds SSO, RBAC, federated search, audit trail, and other enterprise controls, and is free for up to 50 GB per day of ingestion. Above that, pricing is by quote.
- Object storage is priced at Amazon S3 Standard's $0.023 per GB-month for the first 50 TB (US West, Oregon) and assumes no compression, so it's a ceiling. (Source: AWS S3 pricing, November 2026) OpenObserve stores data as compressed Parquet, so the real figure is lower.
The rest of a self-hosted bill is compute: a single node for most teams, or in HA mode the OpenObserve nodes plus PostgreSQL and NATS. OpenObserve keeps this lean because data lives in object storage rather than on disks you size and replicate, and a single OpenObserve node ingests and searches more than 2 TB per day. Every GB you add costs you object storage, not another licence tier.
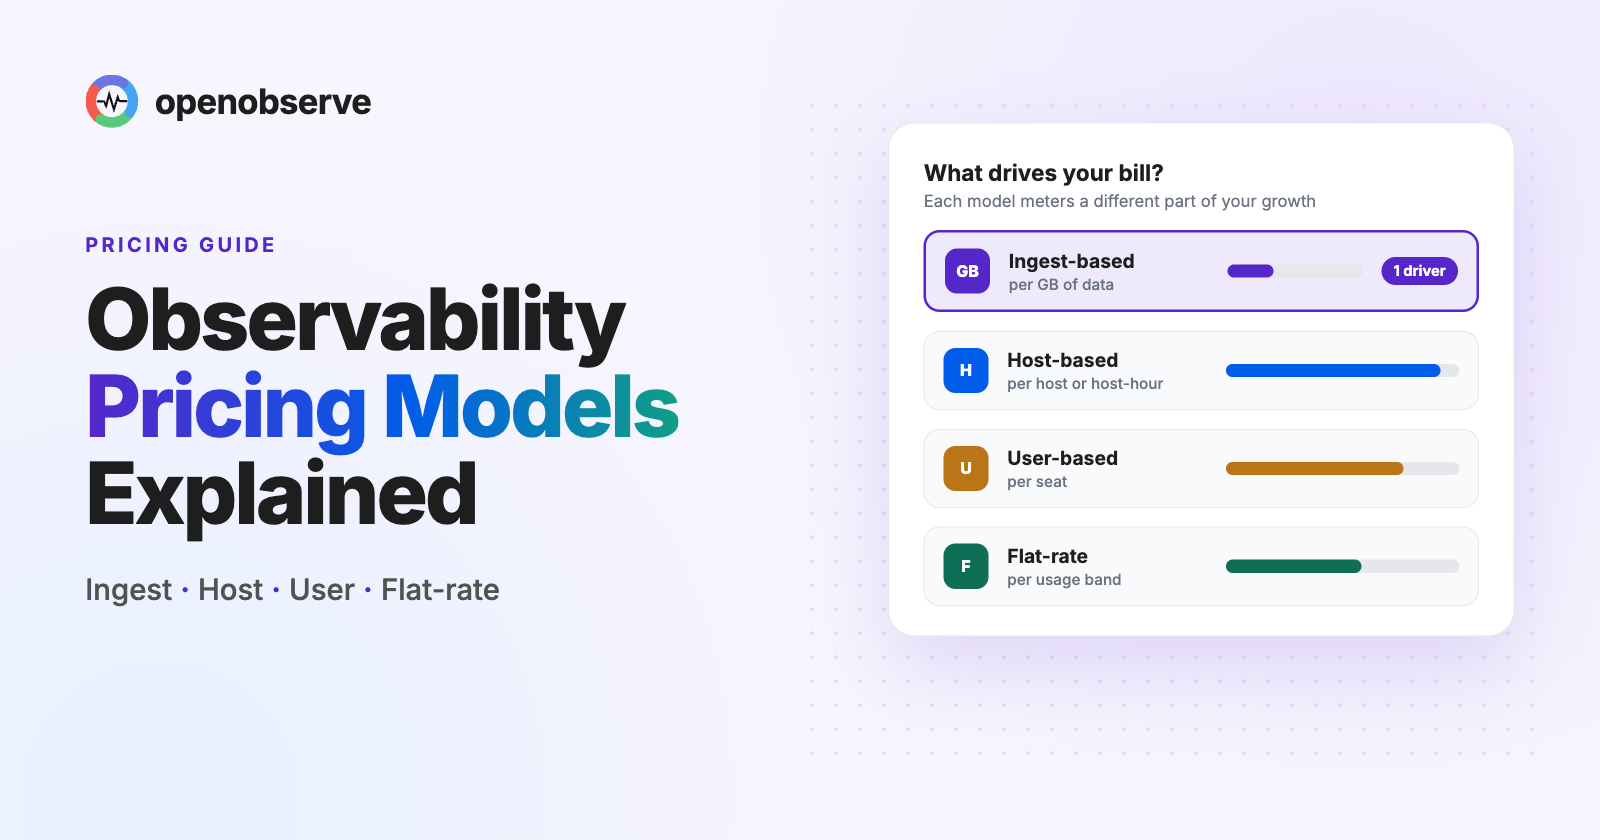
For a breakdown of what a self-hosted build actually involves, see the real cost of self-hosting observability on ClickHouse. For the billing models behind these numbers, see our guide to observability pricing models.
How much ops effort does self-hosted observability take?
It depends on whether you need high availability. A single node is a small job. A production HA cluster is a service your team owns.
Single node. OpenObserve runs as a single binary, with SQLite for metadata and either local disk or object storage for data. A single node ingests and searches more than 2 TB per day. In our tests on an Apple M2 chip with the default configuration, OpenObserve ingested about 31 MB per second, roughly 2.6 TB per day. That covers many production workloads; when you need high availability, move to HA mode. The OpenObserve architecture docs explain both modes.
High availability. HA mode needs more components. Per the HA deployment guide, you need:
- A Kubernetes cluster you have admin access to, plus
kubectlandhelm. - An object storage bucket created beforehand (Amazon S3, GCS, Azure Blob, MinIO, or another supported store). Local disk isn't supported in HA mode.
- The CloudNativePG operator, which the Helm chart uses to provision PostgreSQL (one primary and one replica) for metadata.
- NATS for cluster coordination.
- At least one node of each type: router, ingester, querier, compactor, and scheduler, each of which can scale horizontally.
Here's the honest ops checklist for running any self-hosted observability platform in production:
- Capacity planning. Size ingesters for peak ingest, not average, and queriers for your heaviest dashboards.
- Upgrades. Track releases, test them in staging, and roll them out without dropping data.
- Metadata backups. In HA mode, PostgreSQL holds users, alert rules, stream schemas, and the file list that indexes your Parquet files. Treat it as production data.
- Monitoring the monitor. Your observability platform needs its own alerting, ideally from a separate system.
- On-call. When the platform is down, every other team is flying blind. Someone has to own it.
- Security. Patch the platform and its dependencies, rotate credentials, and control network access.
- Retention and cost controls. Set retention per stream and watch object storage growth.
If you'd rather skip this list entirely, OpenObserve Cloud runs the same platform for you, with the same SQL and PromQL queries and nothing to operate.
When does BYOC make sense?
BYOC makes sense when data must stay inside your cloud account but your team doesn't want to operate the platform. Typical drivers are a security review that rules out sending telemetry to a third party, a data residency rule, or a requirement to use existing cloud spending commitments.
The trade-offs:
- You pay twice in a sense. Your cloud provider bills you for the compute and storage, and the vendor charges for management.
- Operations are shared. The vendor runs the software, but it runs in your account, so incident response depends on the access you grant and on the contract.
- It's often heavier than you need. If the real requirement is "our stored data lives in our account", moving only the storage is simpler.
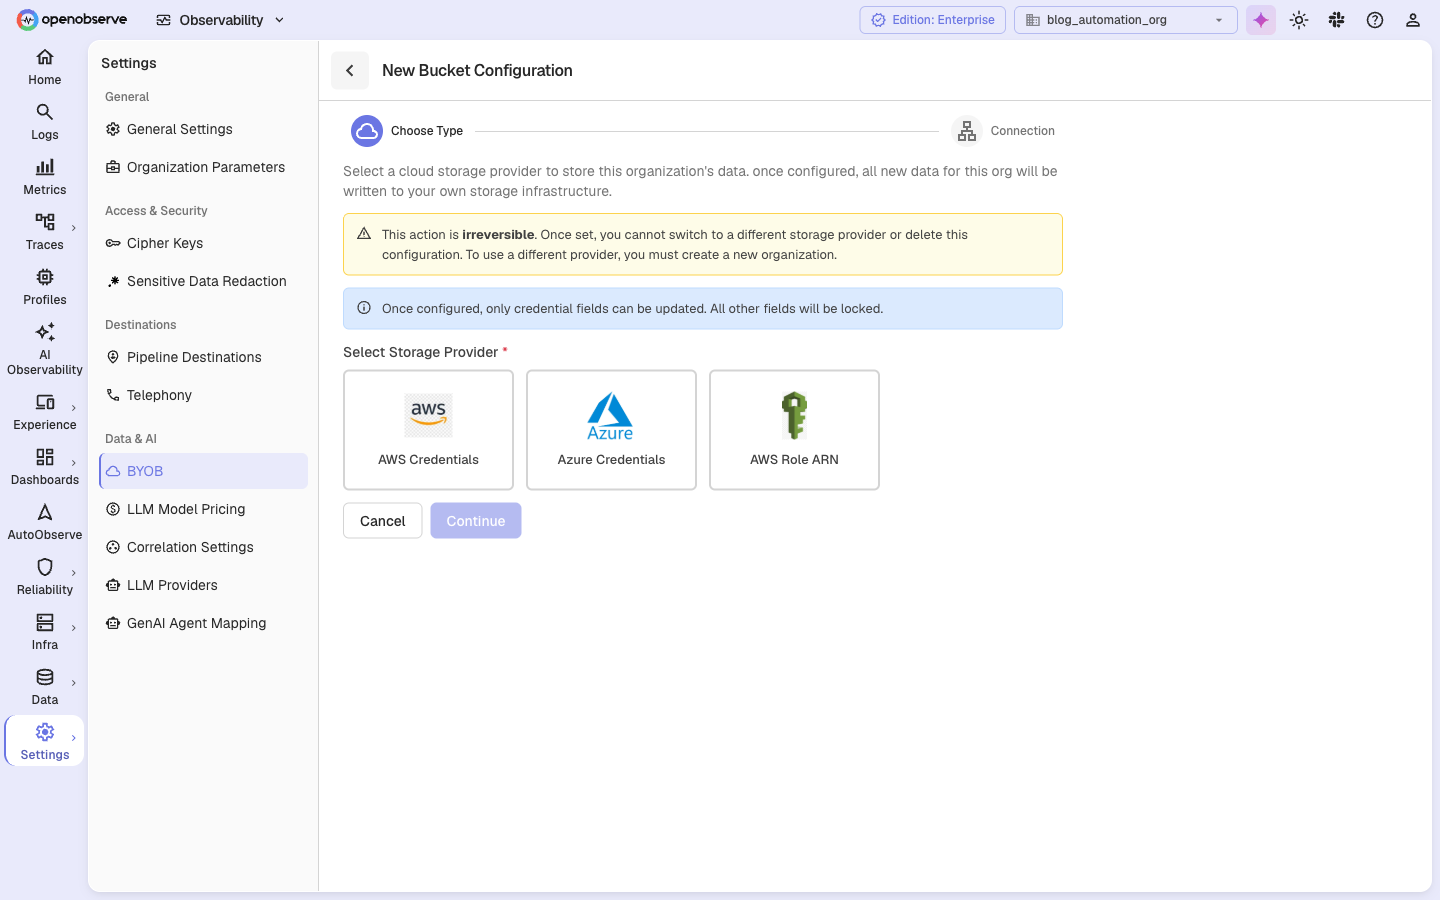
That last case is what BYOB solves. With OpenObserve Bring Your Own Bucket, OpenObserve Cloud writes your telemetry straight to your own Amazon S3 bucket, Azure Blob container, or Google Cloud Storage bucket. Your data stays in your account and region, you can use reserved capacity or negotiated storage rates you already have, and you avoid a data migration if you ever switch platforms. BYOB is available to commercial OpenObserve Cloud customers on request.
You set it up per organization under Settings > BYOB: choose a storage provider, then add the connection details for your bucket.
Self-hosted vs SaaS vs BYOC: how to choose
Start from your hard constraints, then your team's capacity, then cost.
| If your situation is... | Choose | With OpenObserve |
|---|---|---|
| You want telemetry flowing today with no infrastructure to run | SaaS | OpenObserve Cloud |
| You must run on-premises or air-gapped | Self-hosted | OpenObserve open source or Enterprise edition |
| Stored data must live in your cloud account, but you don't want to run the platform | BYOB (or BYOC) | OpenObserve Cloud with BYOB |
| You already run Kubernetes and object storage, at high volume | Self-hosted HA | OpenObserve on Kubernetes with Helm |
| You need EU data residency without self-hosting | SaaS in an EU region | OpenObserve Cloud EU-Central 1 (Frankfurt) |
| You're unsure and want to keep the option open | SaaS first | Start on OpenObserve Cloud; the self-hosted editions are the same platform |
Three questions settle most decisions:
- Does a rule force data into your environment? If yes, self-hosted, BYOC, or BYOB. If no, SaaS is the default.
- Can your team own a production service? If no, avoid self-hosted HA.
- What does your volume cost on each model? Run the numbers from the table above against your own daily volume, including people.
For a full vendor evaluation process, including a weighted scorecard and a 30-day proof of concept, see how to evaluate observability vendors.
How do compliance and data residency affect the choice?
Compliance usually decides the model before cost does.
- SaaS works when the vendor's certifications cover your requirements. Check for SOC 2 Type II and ISO 27001 at minimum, and for regional hosting if you have residency rules.
- Self-hosted puts compliance on you: you control where data lives, but you also own access control, audit logging, and encryption.
- BYOC and BYOB keep data in your account, which simplifies residency, while the vendor's controls still apply to the software layer.
OpenObserve holds SOC 2 Type II and ISO 27001, offers GDPR-aligned EU data residency through its EU-Central 1 (Frankfurt) region, and offers HIPAA and PCI-DSS compliance support on Enterprise (requires an addendum).
How OpenObserve fits every deployment model
OpenObserve is an open-source (AGPL-3.0) observability platform for logs, metrics, traces, continuous profiles, frontend monitoring (RUM, session replay, and error tracking), synthetic monitoring, and AI-powered root cause analysis. It runs as a managed service (OpenObserve Cloud) or self-hosted, and it's the same product in both, so the choice of deployment model doesn't lock you in. It's ingest-based, with no per-host or per-user fees.
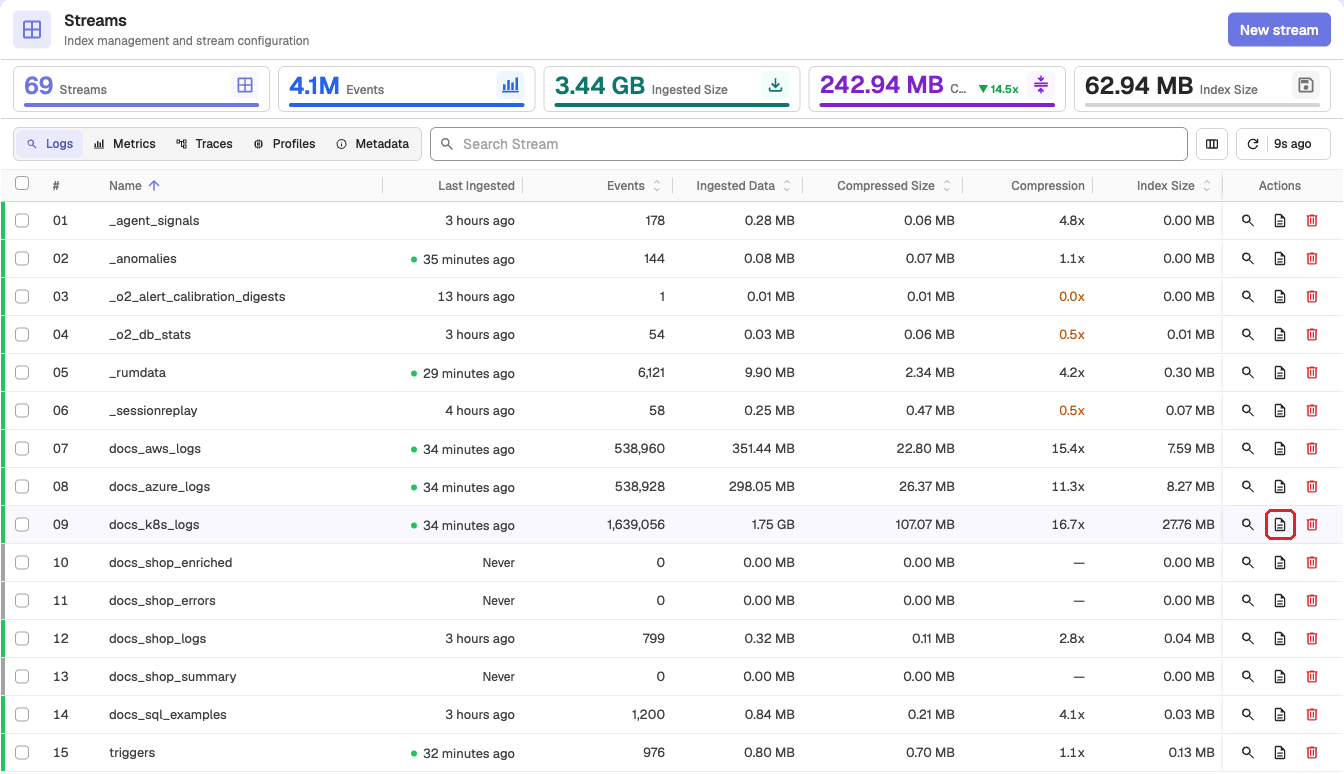
The Streams page shows how much each stream ingested, how much it occupies after compression, and the compression ratio, so you can measure the storage line of a self-hosted bill from your own data instead of estimating it.
Deployment and storage, the areas this decision turns on:
- Deployment options: OpenObserve Cloud, or self-hosted as a single binary, with Docker, or on Kubernetes with Helm in HA mode.
- Storage: data stored as Parquet on object storage (Amazon S3, GCS, Azure Blob, MinIO), BYOB on Cloud, and extended retention for specific time ranges.
- Cost: ingest-based pricing with unlimited users; self-hosted is free as open source, and the Self-Hosted Enterprise edition is free up to 50 GB per day.
The rest of the platform, identical across models:
- Telemetry: logs, metrics, and traces with a service graph and service catalog, plus continuous profiles.
- Frontend monitoring: real user monitoring (RUM), session replay, and error tracking.
- Synthetic monitoring: scheduled browser and protocol checks.
- AI: AI Assistant, SRE Agent for AI root cause analysis, an MCP server, LLM observability and evaluations, anomaly detection, log patterns, and insights.
- Alerting and reliability: scheduled, real-time, composite, and anomaly alerts, incident management, and SLOs with error budgets and burn rates.
- Dashboards and reports: real-time dashboards and scheduled PDF, PNG, or CSV reports.
- Data processing: pipelines, VRL functions, enrichment tables, and metrics downsampling.
- Security and governance: SSO, RBAC, multi-tenancy, sensitive data redaction, audit trail, cipher keys, and federated search.
- Compliance: SOC 2 Type II, ISO 27001, and GDPR via the EU region.
- Open standards: OpenTelemetry-native ingestion, PromQL and SQL querying, and open source under AGPL-3.0.
Some of these, such as SSO, RBAC, the AI features, and federated search, are part of the commercial editions. Because the platform is the same everywhere, you can move between Cloud and self-hosted as your requirements change, without retraining your team or rebuilding dashboards.
Get started with OpenObserve
- Try the managed option: sign up for OpenObserve Cloud and send data in minutes.
- Run it yourself: download OpenObserve open source or Enterprise edition, follow the OpenObserve quickstart for a single binary or Docker, then the HA guide for production.
- Compare costs for your volume on the OpenObserve pricing page.
- Related reading: Datadog pricing explained.
Frequently Asked Questions
About the Author
Simran Kumari

Passionate about observability, AI systems, and cloud-native tools. All in on DevOps and improving the developer experience.
Follow OpenObserve on Google
Add OpenObserve as a preferred source to see more of our articles in Google Search and Top Stories.