How to Evaluate Observability Vendors: A 2026 Buyer's Checklist




Ready to get started?
Try OpenObserve Cloud today for more efficient and performant observability.
Evaluating observability vendors means scoring each platform against the same weighted criteria, testing it with your own telemetry, and pricing the same workload on every option. The criteria that matter most are cost model, OpenTelemetry support, scale, retention, query language, lock-in, and security. This checklist gives you the criteria, a scorecard, and a 30-day POC plan.
TL;DR
- Criteria: score nine areas, weighted for your team, not a feature checklist.
- Cost: price one identical workload on every vendor, with 12 months of growth.
- POC: 30 days with real production telemetry and real incident drills.
- Switching: OpenTelemetry instrumentation turns migration into a config change.
- Best overall fit: OpenObserve: OpenTelemetry-native, ingest-based pricing, open source.
What should you look for when evaluating observability vendors?
Most vendor comparisons fail because teams compare feature lists. Every major platform can ingest logs and draw a dashboard. What separates them is how they charge, how much they lock you in, and how they behave at your scale.
Score each vendor on these nine criteria. The default weights below suit a team running cloud-native services with a few terabytes of telemetry a month; adjust them to your priorities, but keep the total at 100.
| # | Criterion | Default weight | What it decides |
|---|---|---|---|
| 1 | Cost model and total cost | 20 | How the bill grows as data, hosts, and team grow |
| 2 | OpenTelemetry and open standards | 15 | Whether you can change vendors without re-instrumenting |
| 3 | Signal coverage | 10 | How many tools you need for full visibility |
| 4 | Scale and performance | 10 | Query speed and reliability at your data volume |
| 5 | Retention and storage | 10 | How long you can keep data and what it costs |
| 6 | Query language and usability | 10 | How fast engineers get answers during an incident |
| 7 | Lock-in and portability | 10 | The cost of leaving later |
| 8 | Security and compliance | 10 | Whether security and legal will approve it |
| 9 | Deployment options | 5 | SaaS, self-hosted, data residency, own storage |
If you want a list of platforms to put through this framework, start with our guide to the top observability tools and platforms.
The nine observability vendor evaluation criteria
1. Cost model and total cost
The unit a vendor charges for matters more than its headline price. Host-based pricing grows with your infrastructure, user-based pricing grows with your team, and ingest-based pricing grows with your data. Most vendors combine two or more.
For example, Datadog charges per host for infrastructure ($15 per host per month for Infrastructure Pro, billed annually) and separately for logs ($0.10 per GB ingested plus $1.70 per million indexed events with 15-day retention). New Relic charges per user, with Full platform users on Pro at $349 per user per month on an annual commitment, plus data beyond 100 GB a month. (Source: Datadog pricing list page and New Relic pricing page, November 2026) See our Datadog pricing breakdown for how those lines add up.
Questions to ask:
- Which units do you bill on: GB ingested, GB indexed, GB scanned, hosts, users, active series, events?
- What do query, retention beyond the default, and data egress cost?
- What happens to the bill when we autoscale, hire, or add a high-cardinality label?
Red flag: you can't model next year's bill from your current usage numbers.
2. OpenTelemetry and open standards
OpenTelemetry (OTel) is the open standard for generating and collecting telemetry. A vendor that accepts OTLP natively lets you instrument once and send the same data anywhere.
Questions to ask:
- Do you ingest OTLP for logs, metrics, and traces, or only some signals?
- Do you require your own agent for any feature?
- Do you accept Prometheus remote write and support PromQL?
Red flag: key features (APM, profiling, RUM) only work with the vendor's proprietary agent or SDK.
3. Signal coverage
Count how many products you need for full visibility: logs, metrics, traces, profiles, real user monitoring (RUM), session replay, synthetic checks, alerting, incident management, SLOs, and AI-assisted analysis. Every extra product adds a contract, a meter, and a context switch during incidents.
Questions to ask:
- Which signals are in the base product, and which are separately priced add-ons?
- Can I jump from a trace to its logs and metrics in one click?
- Are SLOs, incident management, and AI features included or extra?
4. Scale and performance
Test with your real volume, not the vendor's demo dataset. Query speed on a few gigabytes says nothing about query speed on a few terabytes.
Questions to ask:
- How does query latency change at 10x our current volume?
- Is the architecture highly available, and what happens during a node failure?
- Are there limits on ingest rate, query concurrency, or cardinality?
5. Retention and storage
Retention decides whether you can investigate a slow-burning issue from two months ago or answer an auditor's question from last year. It is also where storage architecture shows up in the bill.
Questions to ask:
- What retention is included for each signal, and what does each extra month cost?
- Can I keep only specific time ranges (an incident window) for longer?
- Is data stored in a format I can read without the vendor?
6. Query language and usability
During an incident, the query language is the interface. A proprietary language your team doesn't know slows every investigation.
Questions to ask:
- Do you support SQL and PromQL, or only a proprietary language?
- Can engineers build dashboards and alerts without vendor-specific training?
- Is there natural-language querying, and does it show the generated query?
7. Lock-in and portability
Lock-in is the sum of everything you'd rebuild to leave: instrumentation, queries, dashboards, alerts, and historical data.
Questions to ask:
- Can we export dashboards and alerts in an open format?
- Can we export historical data, and is there an egress fee?
- Is the platform open source, so we can run it ourselves if pricing changes?
8. Security and compliance
Security review often decides the outcome late in the process. Bring the requirements in at the start.
Questions to ask:
- Do you support SSO (SAML, OIDC, LDAP) and role-based access control?
- Is there an audit trail of user and API activity?
- Which certifications do you hold (SOC 2 Type II, ISO 27001), and do you support HIPAA or PCI-DSS requirements?
- Can sensitive data be redacted at ingestion?
9. Deployment options
Some teams need data in a specific region, inside their own cloud account, or fully self-hosted.
Questions to ask:
- Is there a self-hosted option, and is it the same product as the SaaS?
- Can the SaaS store data in our own object storage bucket?
- Which regions are available for data residency?
Observability vendor scorecard template
Score each vendor from 1 (poor) to 5 (excellent) on every criterion. The weighted score is the weight multiplied by the score, divided by 5, so a perfect vendor scores 100.
Download the observability vendor scorecard (CSV). It opens in Excel or Google Sheets with the formulas in place.
| Criterion | Weight | Vendor A (1-5) | Vendor B (1-5) | Vendor C (1-5) |
|---|---|---|---|---|
| Cost model and total cost | 20 | |||
| OpenTelemetry and open standards | 15 | |||
| Signal coverage | 10 | |||
| Scale and performance | 10 | |||
| Retention and storage | 10 | |||
| Query language and usability | 10 | |||
| Lock-in and portability | 10 | |||
| Security and compliance | 10 | |||
| Deployment options | 5 | |||
| Weighted total (out of 100) | 100 |
Two rules keep the scorecard honest:
- Fix the weights before the POC starts. Changing weights after you've seen the results usually means you're scoring toward a favorite.
- Score from evidence, not demos. Every score should point to something you measured or a document the vendor provided.
How do you run a fair observability POC?
A proof of concept (POC) is where vendor claims meet your data. Run every shortlisted vendor through the same plan, in parallel if you can.
- Week 1: send real telemetry. Route a representative slice of production data (one service or one cluster) to each vendor through the same OpenTelemetry Collector, so the data is identical. Record setup time and anything that needed vendor support.
- Week 2: rebuild what you use daily. Recreate your five most-used dashboards and ten most important alerts. Note what you couldn't express.
- Week 3: run incident drills. Replay two or three real past incidents. Time how long engineers take to find the root cause on each platform, and include engineers who weren't part of the setup.
- Week 4: measure and score. Compare query speed on your largest time ranges, the projected monthly bill at current and 12-month volume, and team feedback. Fill in the scorecard.
Sending identical data through one collector is the key to fairness. It also proves the switching story: if you can point the same collector at two backends during the POC, you can do it again later.
How hard is it to switch observability vendors?
Switching cost has four parts, and you can estimate each one before you sign.
| Switching cost | High when | Low when |
|---|---|---|
| Instrumentation | Services use a proprietary agent or SDK | Services use OpenTelemetry; switching is a collector config change |
| Queries and alerts | Everything is written in a proprietary query language | Queries use SQL or PromQL |
| Dashboards | Dashboards only exist in the vendor's format | Dashboards can be exported or recreated from standard queries |
| Historical data | Data can't be exported, or egress is billed | Data is stored in an open format you control |
Questions to ask every vendor before signing:
- If we leave in two years, what do we have to rebuild?
- How do we export dashboards, alerts, and historical data, and what does it cost?
- Do any features stop working if we use OpenTelemetry instead of your agent?
For a practical view of the dashboard part, see our guide to migrating dashboards from Datadog, Grafana, Kibana, and CloudWatch.
Common mistakes when choosing an observability platform
- Comparing headline prices. A low per-GB price with indexing, query, and retention fees can cost more than a higher all-in rate.
- Testing with demo data. Performance and cost only show up at your real volume and cardinality.
- Ignoring seat costs. User-based pricing pushes teams to share logins or limit access, which slows incident response.
- Leaving security review to the end. A late SSO or compliance gap can reset the whole evaluation.
- Skipping the exit plan. The best time to measure lock-in is before you're locked in.
How OpenObserve scores against the checklist
OpenObserve is an open source (AGPL-3.0) observability platform that runs as a managed cloud service or self-hosted. Here is how it maps to each criterion:
| Criterion | OpenObserve |
|---|---|
| Cost model | Ingest-based: you pay for data ingested and queried, with unlimited users and no per-host fees. On OpenObserve Cloud, $0.50 per GB ingested on an annual contract plus $0.01 per GB queried |
| OpenTelemetry and open standards | OpenTelemetry-native ingestion for logs, metrics, traces, and profiles; Prometheus remote write and PromQL |
| Signal coverage | Logs, metrics, traces with service graph and service catalog, continuous profiling, RUM with session replay and error tracking, synthetic monitoring |
| AI and incident workflow | AI Assistant, SRE Agent for AI root cause analysis, MCP server, LLM observability and evaluations, anomaly detection, log patterns, incident management |
| Alerting and reliability | Scheduled, real-time, composite, and anomaly alerts; SLOs with error budgets and burn rate |
| Dashboards and reporting | Dashboards with variables and custom charts; scheduled PDF, PNG, or CSV reports |
| Data processing | Pipelines that filter, transform, and route data at ingestion, VRL functions, enrichment tables, metrics downsampling |
| Scale and performance | Object storage architecture that runs as a single binary or as a highly available deployment on Kubernetes |
| Retention and storage | Data stored as Parquet on S3, GCS, Azure Blob, or MinIO; 30 days of logs and traces and 15 months of metrics included on Cloud; extended retention for specific time ranges |
| Query language | SQL for logs, SQL and PromQL for metrics, natural-language queries through the AI Assistant |
| Lock-in and portability | Open source, OpenTelemetry-native, open Parquet format, and Bring Your Own Bucket to keep Cloud data in your own bucket |
| Security and compliance | SSO, RBAC, multi-tenancy, audit trail, sensitive data redaction; SOC 2 Type II and ISO 27001; HIPAA and PCI-DSS compliance support on Enterprise (requires addendum) |
| Deployment options | OpenObserve Cloud (including an EU-Central Frankfurt region) or self-hosted; move between them at any time |
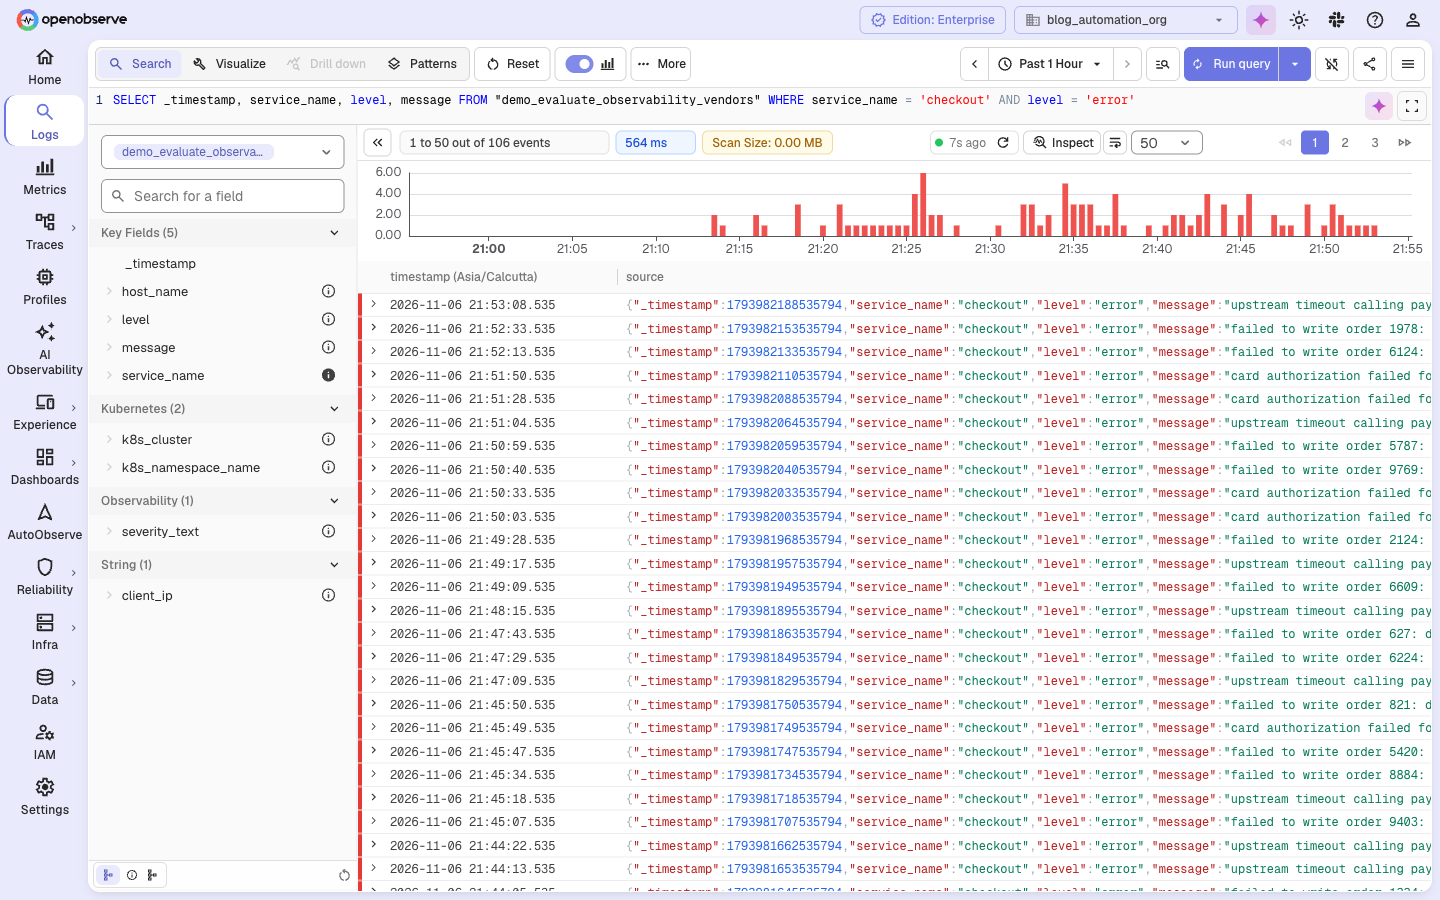
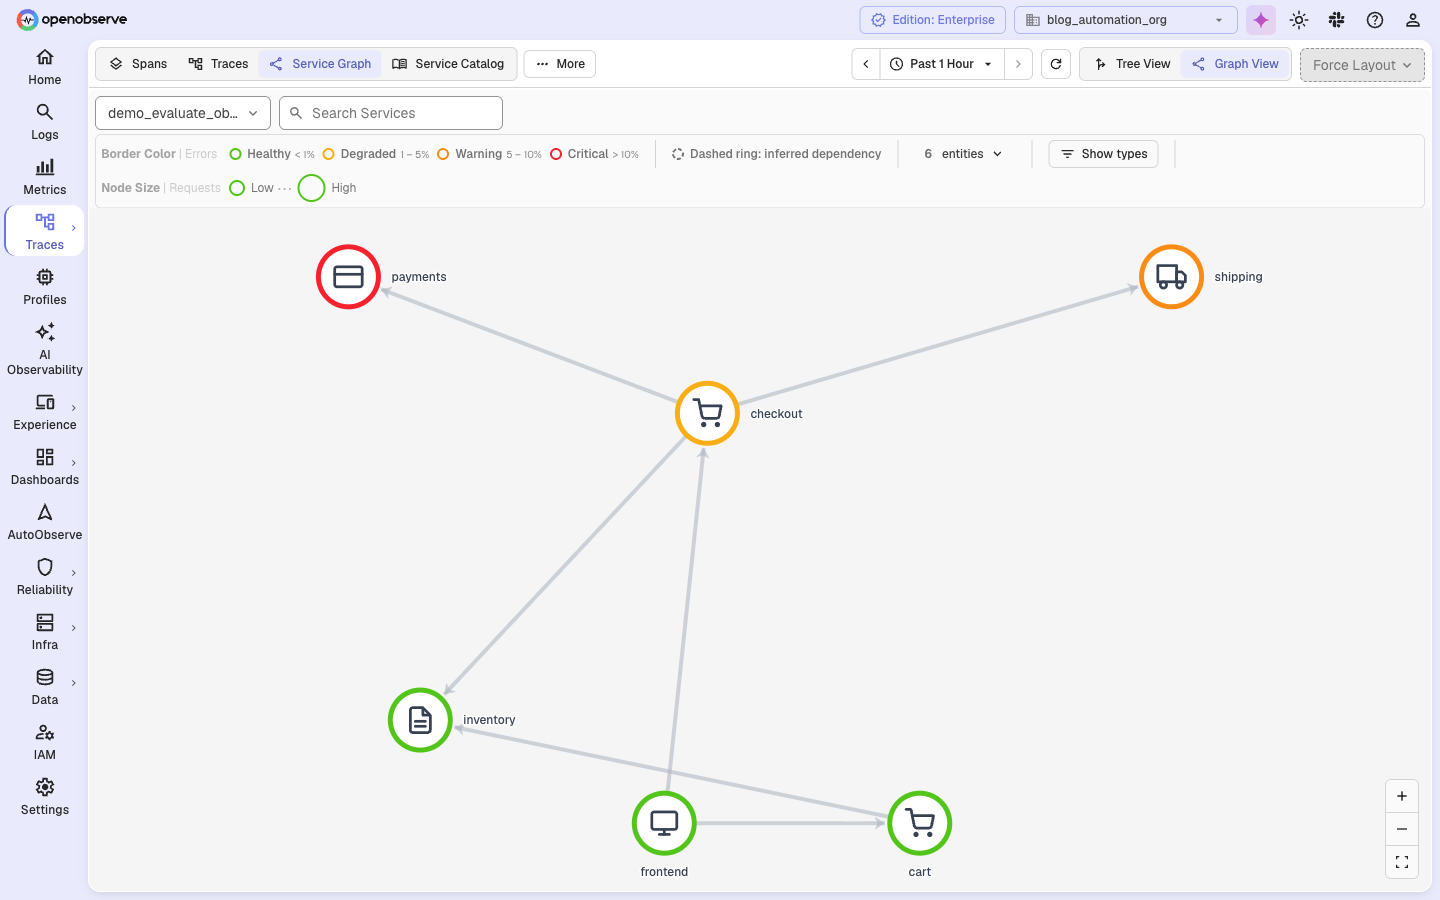
Because OpenObserve is OpenTelemetry-native, it also fits the fair POC above: point a second exporter in your existing collector at OpenObserve and compare it side by side with your current platform, using the same data.
Get started with OpenObserve
- Download the vendor scorecard and fix your weights before you start.
- Compare plans on the OpenObserve pricing page.
- Start a 14-day free trial of OpenObserve Cloud, or run OpenObserve self-hosted.
- Weighing self-hosting? Read the real cost of self-hosting observability on ClickHouse.
Frequently Asked Questions
About the Author
Simran Kumari

Passionate about observability, AI systems, and cloud-native tools. All in on DevOps and improving the developer experience.
Follow OpenObserve on Google
Add OpenObserve as a preferred source to see more of our articles in Google Search and Top Stories.