Observability Pricing Models: Ingest, Host, User & Flat-Rate




Ready to get started?
Try OpenObserve Cloud today for more efficient and performant observability.
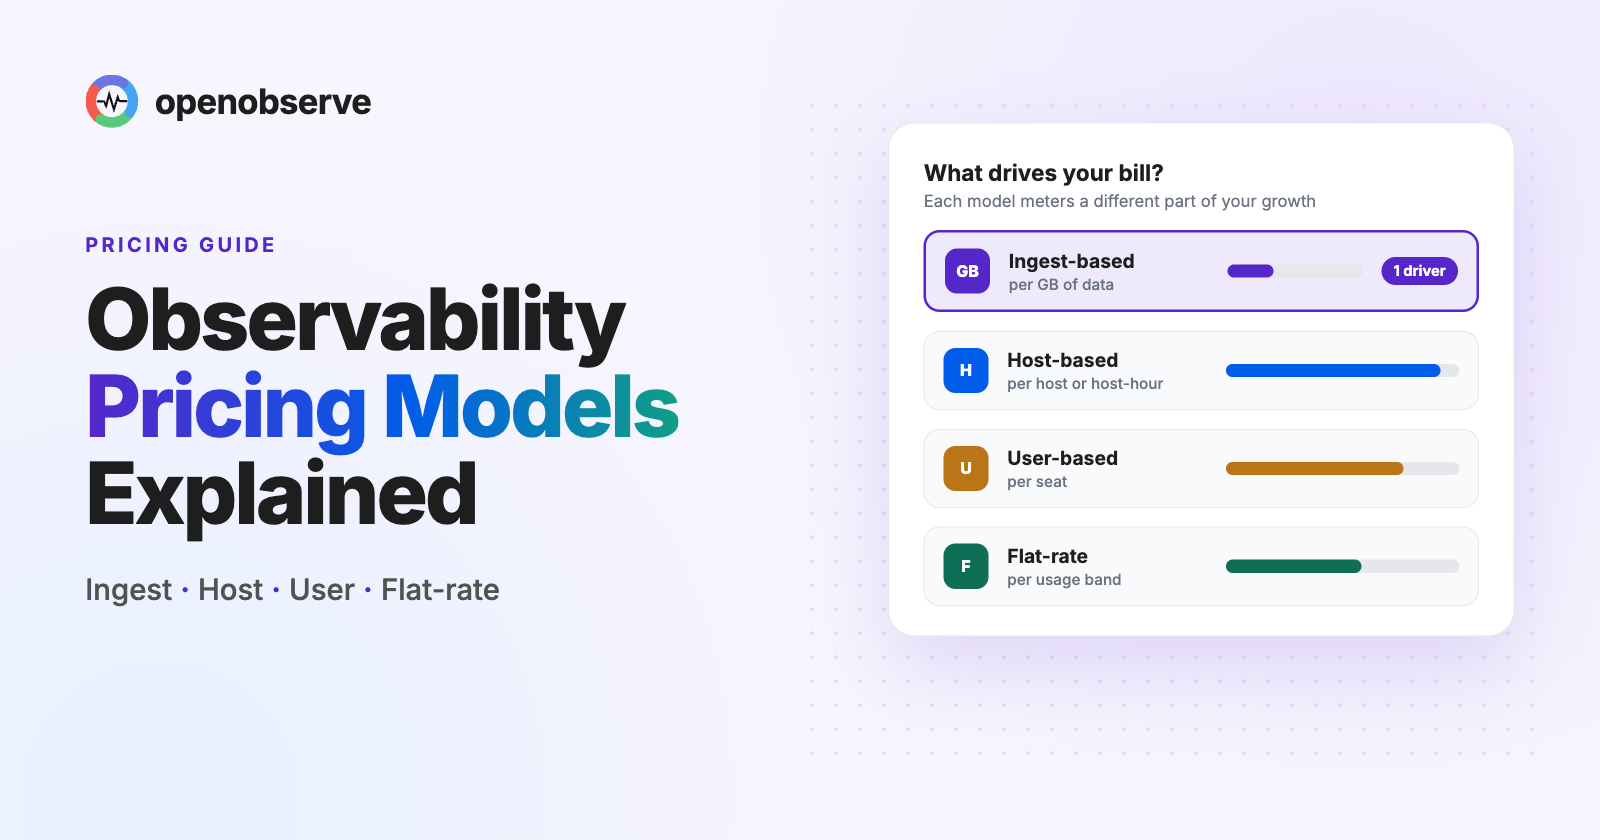
Observability pricing models are the ways vendors turn your telemetry into a bill: per GB ingested, per monitored host, per user seat, or a flat fee for a capacity band. Most vendors mix two or more. Your model decides which part of your growth (data, infrastructure, or headcount) drives cost, and how hard next year's bill is to predict.
TL;DR
- Ingest-based: you pay per GB sent. One driver, easy to forecast and control.
- Host-based: you pay per server or container host, plus separate data fees. Autoscaling moves the bill.
- User-based: you pay per seat. Cost grows with team size, not data.
- Flat-rate or tiered: fixed price inside a band; overages or tier jumps above it.
- Most predictable at scale: OpenObserve: ingest-based, no host or user fees.
What are observability pricing models?
An observability pricing model is the unit a vendor charges for. That unit matters more than the headline price, because it decides which part of your business makes the bill grow.
| Model | You pay for | Grows with | Common in |
|---|---|---|---|
| Ingest-based | GB of logs, metrics, and traces sent | Data volume | Log platforms, OpenTelemetry-native backends |
| Host-based | Each monitored host, per month or per hour | Infrastructure size | Infrastructure monitoring and APM |
| User-based | Each person with access | Team size | Full-platform suites |
| Flat-rate / tiered | A fixed price for a capacity band (events, GB, or hosts) | Crossing into the next band | Event-based tracing tools, enterprise contracts |
| Scan / query-based | Data scanned by searches and dashboards | How often and how widely you query | Newer log analytics tiers |
In practice, almost every vendor combines models. A per-host infrastructure fee plus a per-GB log fee is the most common pairing.
How does ingest-based pricing work?
Ingest-based pricing charges per GB of telemetry the platform receives. Retention for a default period is usually included, and query or long-term storage is billed separately.
Strengths:
- One main driver (GB ingested) that you can measure at the source.
- You control it directly: drop debug logs, sample traces, and filter noisy fields before they are billed.
- No penalty for adding engineers or scaling hosts.
Watch for:
- Separate query or scan charges.
- Short included retention with paid extensions.
- Different rates for logs, metrics, and traces.
OpenObserve is ingest-based: you pay for the data you ingest and query, with no per-host, per-user, or per-seat fees. On OpenObserve Cloud, that's $0.50 per GB ingested on an annual contract ($0.70 pay-as-you-go) plus $0.01 per GB queried, with 30 days of retention for logs and traces and 15 months for metrics included.
How does host-based pricing work?
Host-based pricing charges for each monitored host (a VM, bare-metal server, or container node) per month, or per hour of host uptime. Log and trace volume is usually billed on top.
Examples from vendor list prices:
- Datadog Infrastructure Pro is $15 per host per month billed annually ($18 month-to-month), and APM is $31 per host per month billed annually. Logs are billed separately: $0.10 per GB ingested plus $1.70 per million indexed log events with 15-day retention. (Source: Datadog pricing list page, November 2026)
- Splunk Observability Cloud tiers start at $15 (Infrastructure), $60 (App & Infra), and $75 (End-to-End) per host per month, billed annually. (Source: Splunk Observability Cloud pricing page, October 2026)
- Dynatrace charges Full-Stack Monitoring at $0.01 per memory-GiB-hour and Infrastructure Monitoring at $0.04 per hour for any size host. (Source: Dynatrace rate card, November 2026)
Strengths:
- Simple when the fleet is stable and long-lived.
- Infrastructure metrics are often bundled into the host fee.
Watch for:
- Autoscaling and short-lived nodes, which raise host counts or host-hours without changing what you observe.
- Memory-based host sizing (as with Dynatrace's GiB-hours), where moving to larger instances raises the bill with no change in host count.
- A second, separate bill for logs and traces.
For a full breakdown of one host-based vendor, see our Datadog pricing guide.
How does user-based pricing work?
User-based pricing charges for each person who can use the platform, often with seat types at different prices. Data ingest is usually billed too, after a free allowance.
Example: New Relic includes 100 GB of data ingest per month, then charges $0.40 per GB (Original Data) or $0.60 per GB (Data Plus) on Standard and Pro. Users are priced by type: Basic users are free, Core users are $49 per user per month, and Full platform users on Pro are $349 per user per month on an annual commitment or $418.80 on monthly pay-as-you-go. (Source: New Relic pricing page, November 2026)
Grafana Cloud Pro also has a user element: a $19 monthly platform fee, Grafana visualization from $8 per active user after the first 3, and usage fees for logs, metrics, and traces. (Source: Grafana Cloud pricing page, November 2026)
Strengths:
- Data-heavy, small teams pay little for headcount.
Watch for:
- Pressure to share logins or limit access, which slows incident response.
- Seat-type audits: who really needs a full-platform seat?
- Headcount growth raising the bill even when data stays flat.
How does flat-rate and tiered pricing work?
Flat-rate or tiered pricing charges a fixed price for a band of usage (events, GB, or hosts). Inside the band, the bill doesn't move. Crossing it means an overage rate or a jump to the next tier.
Example: Honeycomb's Free plan covers up to 20M events per month. Pro starts at $150 per month for up to 750M events, priced from $150 per 50M events, and Enterprise is custom. All plans include unlimited seats and unlimited querying. (Source: Honeycomb pricing page, November 2026)
Flat-rate contracts also appear as committed annual spend: you buy a fixed amount of capacity or credits upfront. Sumo Logic, for example, bills in credits and offers a Flex option with $0 ingest where cost depends on analytics scans; it doesn't publish per-credit prices. (Source: Sumo Logic pricing page, October 2026)
Strengths:
- Budget certainty inside the band.
Watch for:
- The step at the top of each band.
- Unused capacity in committed contracts (you pay for it either way).
- Event-based units that are hard to convert from your current GB or host numbers.
What hidden fees exist in observability pricing?
The headline rate is rarely the whole bill. These five line items cause most surprises, and each one has its own driver.
| Hidden fee | What triggers it | Vendor examples (list prices) |
|---|---|---|
| Query / scan charges | Searches, dashboards, and alerts reading data | OpenObserve: $0.01 per GB queried. Dynatrace: $0.0035 per GiB scanned. Sumo Logic Flex: billed on scans per GB ingested, no published price |
| Retention beyond the included period | Keeping data longer than the default | OpenObserve: $0.02 per GB per extra 30 days for non-metrics data. Dynatrace: $0.0007 per GiB-day. Elastic Serverless Complete: $0.019 per GB retained monthly. Grafana Cloud logs: from $0.10 per GB |
| Indexing fees | Making logs searchable, separate from ingest | Datadog: $1.06 to $2.50 per million indexed logs depending on retention (3 to 30 days), billed annually |
| Custom metrics / active series | High-cardinality labels and custom metrics | Datadog: $5 per 100 custom metrics. Grafana Cloud: from $6.50 per 1k active series beyond 10k |
| Egress | Moving data out of the platform | Dynatrace: $0.15 per GiB egressed. Elastic Serverless: 50 GB free, then $0.05 per GB transferred monthly. Datadog: $0.25 per GB to forward logs to each custom destination. New Relic: no egress charge |
Sources: OpenObserve pricing page; Dynatrace rate card, Elastic Observability Serverless pricing page, Grafana Cloud pricing page, Datadog pricing list page, and New Relic pricing page, November 2026; Sumo Logic pricing page, October 2026.
Custom metrics fees are the hardest to forecast, because one new label can multiply series counts.
Observability pricing by vendor: which model does each use?
| Vendor | Primary model | Data fees | User fees | Notable extra charges |
|---|---|---|---|---|
| OpenObserve | Ingest-based | Cloud: $0.50/GB (annual), $0.70/GB (pay-as-you-go) | None, unlimited users | $0.01/GB queried; extra retention $0.02/GB per 30 days |
| Datadog | Host-based + ingest | Logs $0.10/GB ingested + $1.70 per 1M indexed | Observability products not priced per user | Custom metrics $5 per 100 |
| Splunk Observability Cloud | Host-based tiers | No per-GB rate published | Not listed | Add-ons priced by contacting sales |
| Dynatrace | Host-hours (memory-based) + usage | Logs $0.20/GiB ingest | Not listed | Retain $0.0007/GiB-day; query $0.0035/GiB scanned; egress $0.15/GiB |
| New Relic | User-based + ingest | 100 GB free, then $0.40 or $0.60/GB | Core $49; Full platform $349 (Pro, annual) | Compute (CCU) charges, no published price |
| Grafana Cloud | Usage + users + platform fee | Logs and traces: $0.05/GB processed, $0.40/GB written, $0.10/GB retained | Visualization from $8 per active user | $19/month platform fee; active series from $6.50 per 1k |
| Elastic Observability Serverless | Ingest + retention | From $0.07/GB (Logs Essentials), from $0.09/GB (Complete) | Not listed | Retention per GB-month; egress above 50 GB |
| Honeycomb | Event-based tiers | Events, not GB | Unlimited seats | Tier steps at plan limits |
| Sumo Logic | Credits; scan-based Flex option | $0 ingest on Flex | Not listed | Scans and storage; no published prices |
All third-party figures are list prices from each vendor's own pricing page or rate card (Splunk and Sumo Logic October 2026, the rest November 2026). Discounts, commitments, and regional pricing change real bills.
Ingest, query, retention, and egress charges compared
The four charges that decide most log bills are ingest, query, retention, and getting data out. Here is how each vendor prices them, from their own pricing pages.
| Vendor | Ingest | Query / scan | Retention | Egress / data out |
|---|---|---|---|---|
| OpenObserve Cloud | $0.50/GB (annual), $0.70/GB (pay-as-you-go) | $0.01/GB queried | Included: 30 days logs and traces, 15 months metrics; then $0.02/GB per 30 days | Not listed; Bring Your Own Bucket keeps data in your own bucket |
| Datadog | Logs $0.10/GB, plus $1.06 to $2.50 per 1M indexed events | No log query charge listed | Set by index tier: 3, 7, 15, or 30 days; Flex Logs storage from $0.05 per 1M events | $0.25/GB per custom forwarding destination |
| Dynatrace | $0.20/GiB ingest and process | $0.0035/GiB scanned | $0.0007/GiB-day | $0.15/GiB |
| New Relic | 100 GB free, then $0.40/GB (Original Data) or $0.60/GB (Data Plus); EU region +$0.05/GB | Compute (CCU), no published price | Data Plus adds up to 90 days of extended retention | None ("we don't charge for data egress or hydration") |
| Grafana Cloud Pro | Logs and traces: $0.05/GB processed + $0.40/GB written, 50 GB included | Not listed | 30 days included for logs and traces, then $0.10/GB retained; 13 months for metrics | Not listed |
| Elastic Observability Serverless | From $0.07/GB (Logs Essentials) or $0.09/GB (Complete) | No query charge listed | From $0.017/GB-month (Essentials), $0.019/GB-month (Complete) | 50 GB free, then $0.05/GB |
| Honeycomb | Events, not GB: Pro from $150 per 50M events | Unlimited querying | Not listed | Not listed |
Sources: each vendor's pricing page or rate card, November 2026. "Not listed" means the vendor's pricing page doesn't state a price for that charge.
A low ingest price can hide a high total. Dynatrace's $0.20/GiB ingest looks close to the others, but retention is billed per GiB-day and every search is billed per GiB scanned. Datadog's $0.10/GB ingest rises to $1.80 per GB-equivalent once 1 KB logs are indexed for 15 days.
Worked example: one workload, three pricing models
To compare models fairly, take one workload and price it on each, using list prices.
The workload (monthly):
- 50 hosts, 16 GiB memory each, running all month (730 hours)
- 20 engineers: 6 need full platform access, 14 need core access
- 900 GB logs (about 900M events at roughly 1 KB each), 300 GB traces, 100 GB metrics: 1,300 GB total
- Searches, dashboards, and alerts scan 5,000 GB
| Host-based (Datadog) | User-based (New Relic Pro) | Ingest-based (OpenObserve Cloud) | |
|---|---|---|---|
| Hosts | Infra Pro 50 × 15 = $750; APM 50 × 31 = $1,550 | 0 | 0 |
| Data | Logs ingest 900 × 0.10 = $90; indexing 900M events × 1.70 per 1M = $1,530 | (1,300 - 100 free) × 0.40 = $480 | 1,300 × 0.50 = $650 |
| Users | 0 | 6 × 349 + 14 × 49 = $2,780 | 0 |
| Query | Not billed separately | Compute charges not published | 5,000 × 0.01 = $50 |
| Monthly total | $3,920 | $3,260 | $700 |
Source: calculated from list prices on the Datadog, New Relic, and OpenObserve pricing pages, November 2026.
What's excluded, so you can adjust: Datadog custom metrics and any span ingestion or indexing beyond what the APM host fee includes; New Relic compute (CCU) charges; OpenObserve retention beyond the included 30 days (logs, traces) and 15 months (metrics). All rates use annual-commitment list prices. On pay-as-you-go, the OpenObserve Cloud total is 1,300 × 0.70 + 50 = $960.
The point isn't the totals. Each model puts weight on a different line: hosts and indexing for host-based, seats for user-based, data volume for ingest-based. For a deeper comparison of one pairing, see Datadog vs OpenObserve: cost. To model your own invoice, use the Bill Analyzer.
How to predict next year's observability bill
- List every billing driver in your contract: GB ingested, GB queried, hosts or host-hours, users by seat type, metrics series, retention.
- Measure each driver today from your current invoice or usage page.
- Pick a growth rate per driver. Data, infrastructure, and headcount rarely grow at the same pace.
- Multiply by unit price, and add the tier steps or overage rates you'll cross.
- Add a margin for each driver you can't control. More drivers means more margin.
Applying illustrative growth rates to the workload above (data +40%, hosts +20%, engineers +25%):
| Model | This year (monthly) | Next year (monthly) | Change | Drivers to forecast |
|---|---|---|---|---|
| Host-based (Datadog) | $3,920 | $5,028 | +28% | Hosts, log GB, indexed events |
| User-based (New Relic Pro) | $3,260 | $4,163 | +28% | Users by seat type, GB ingested |
| Ingest-based (OpenObserve Cloud) | $700 | $980 | +40% | GB ingested, GB queried |
The ingest-based bill grows in line with data, because data is its only real driver. That is what makes it predictable: one number to forecast, measured at the source, and one you can reduce before it's billed. For ways to lower that number, see 12 observability cost optimization tactics.
Which observability pricing model is most predictable at scale?
Predictability comes down to two questions: how many drivers does the bill have, and can you control them?
- Ingest-based: one driver, controllable at the source with filtering, sampling, and routing. Most predictable.
- Flat-rate / tiered: predictable inside a band, with a step at the edge.
- User-based: predictable while headcount is stable; hiring and access requests move it.
- Host-based: least predictable on autoscaling or containerized infrastructure, and usually paired with a separate data bill.
Which observability tools have no per-host or per-user pricing?
Most vendors meter at least one of hosts or seats on top of data. Here is what each vendor's pricing page lists:
| Vendor | Per-host fees | Per-user fees |
|---|---|---|
| OpenObserve | None | None, unlimited users |
| Honeycomb | None listed (priced by events) | None, unlimited seats |
| Elastic Observability Serverless | None listed | None listed |
| Grafana Cloud | None listed | From $8 per active user after the first 3 |
| New Relic | None listed | Core $49; Full platform $349 (Pro, annual) |
| Datadog | Infrastructure and APM per host | Not priced per user |
| Dynatrace | Per memory-GiB-hour or host-hour | Not listed |
| Splunk Observability Cloud | Per host tiers | Not listed |
Sources: each vendor's pricing page or rate card, November 2026 (Splunk, October 2026).
Removing both meters leaves data as the only driver. Adding an on-call engineer, giving a product team read access, or scaling a node pool for a traffic spike doesn't change the bill.
Which pricing model gives the lowest total cost of ownership?
Total cost of ownership (TCO) is the subscription or license, plus the infrastructure you run, plus the engineering time to operate it. The pricing model shapes the first part; the deployment model shapes the other two.
- SaaS, priced per unit you can reduce: ingest-based pricing lets you cut cost by filtering and sampling before data is billed. In the worked example above, the ingest-based bill is $700 a month against $3,260 and $3,920 for the user-based and host-based options.
- SaaS, priced per host or seat: the bill follows infrastructure or headcount, which you can't trim without losing coverage or access.
- Self-hosted: no per-GB fee, but you pay for compute, storage, and the people who run it. Storage format matters most at scale: a platform that writes compressed columnar files to object storage usually costs less to retain than one that keeps indexed data on block storage. Our breakdown of the real cost of self-hosting observability on ClickHouse shows where those costs land.
OpenObserve gives the most cost-efficient result on both paths. On Cloud, you pay per GB with no host or seat fees. Self-hosted, the Open Source edition is free and the Self-Hosted Enterprise edition is free for up to 50 GB of ingestion per day, with data stored as Parquet on object storage. You can move between Cloud and self-hosted at any time.
How OpenObserve keeps observability pricing predictable
OpenObserve is an open source (AGPL-3.0) observability platform for logs, metrics, traces, and RUM. Its pricing follows one driver: how much data you ingest.
- One driver, no seat or host fees: you pay for data ingested and queried, with unlimited users. On Cloud, that's $0.50 per GB ingested on an annual contract plus $0.01 per GB queried.
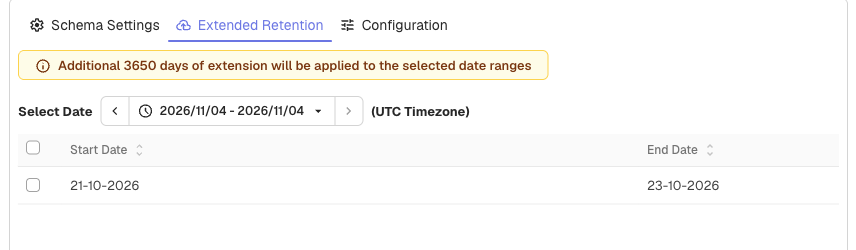
- Retention included: 30 days for logs and traces, 15 months for metrics. Extending non-metrics retention costs $0.02 per GB per extra 30-day period, and extended retention lets you keep specific time ranges of a stream longer, such as data from an incident.
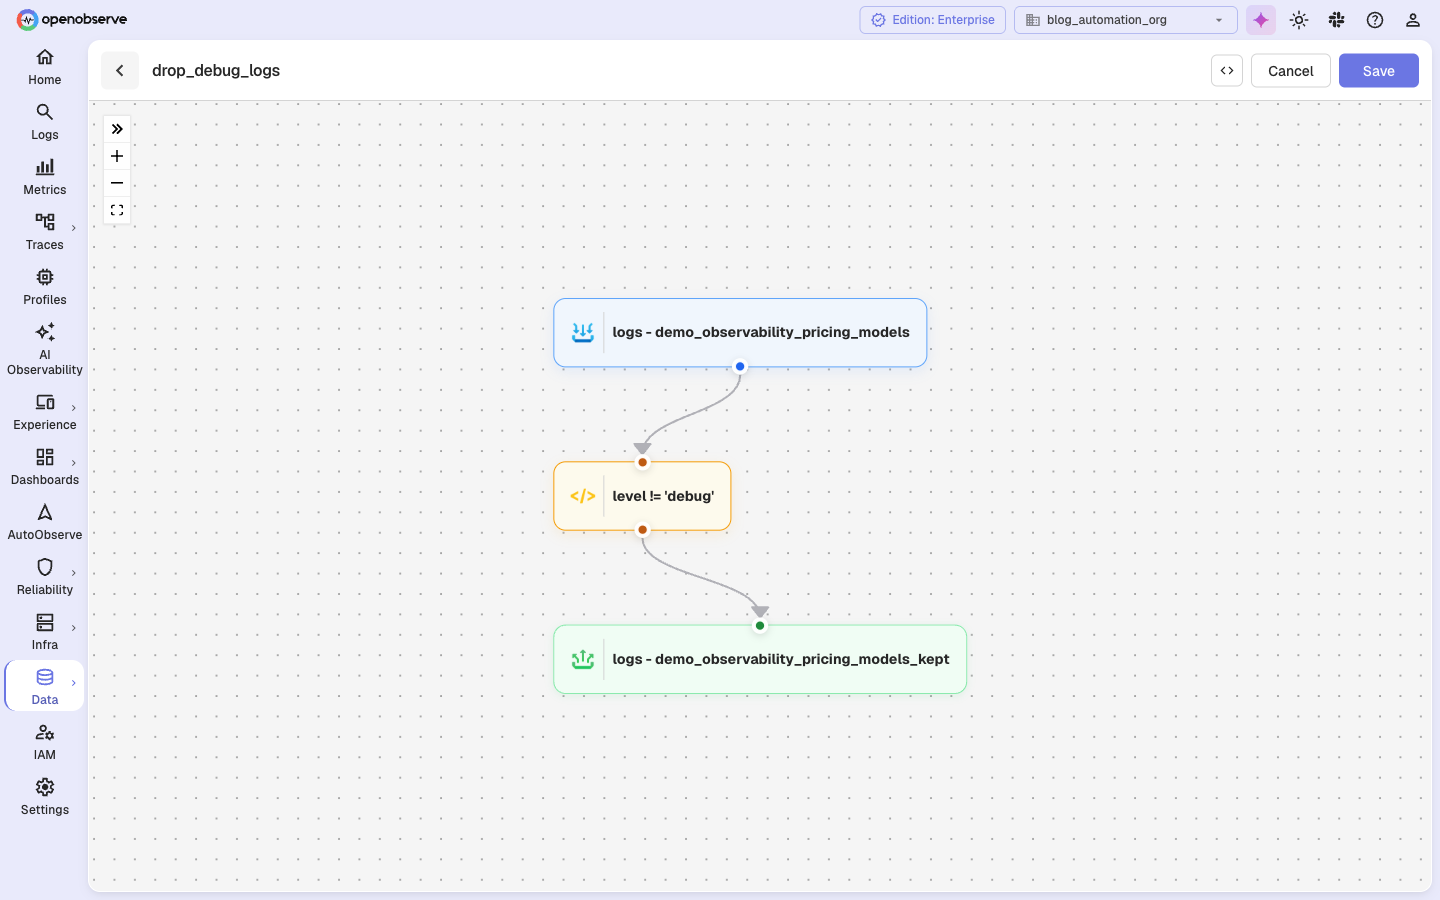
- Control the driver before it's billed: pipelines filter, transform, and route data during ingestion, so you can drop noisy logs before they count.
- Object storage underneath: telemetry is stored as Parquet files on object storage (S3, GCS, Azure Blob, MinIO).
- Own the storage: with Bring Your Own Bucket writes telemetry to your own S3, Azure Blob, or Google Cloud Storage bucket, so you can use storage commitments you already have.
One platform instead of a product per signal
Host-based and user-based bills often grow because each signal is a separate product with its own meter. OpenObserve covers the full stack in one platform:
| Area | What's included |
|---|---|
| Logs, metrics, traces | Log search with SQL, PromQL and SQL for metrics, distributed tracing with a service graph and service catalog, continuous profiling |
| Frontend monitoring | Real User Monitoring (RUM), session replay, and error tracking |
| Synthetic monitoring | Scheduled browser and protocol checks from global and private locations |
| AI | AI Assistant, SRE Agent for AI root cause analysis, MCP server, LLM observability and evaluations, anomaly detection, log patterns |
| Alerting and reliability | Scheduled, real-time, composite, and anomaly alerts; incident management; SLOs with error budgets and burn rate |
| Dashboards and reports | Dashboards with custom charts, scheduled PDF, PNG, or CSV reports |
| Data processing | Pipelines, VRL functions, enrichment tables, metrics downsampling |
| Storage and retention | Object storage, Bring Your Own Bucket, extended retention |
| Security and governance | SSO, RBAC, multi-tenancy, sensitive data redaction, audit trail, federated search |
| Compliance | SOC 2 Type II, ISO 27001, and an EU-Central (Frankfurt) Cloud region for GDPR and data residency |
| Open standards | OpenTelemetry-native ingestion, Prometheus remote write and PromQL |
Get started with OpenObserve
- Compare plans on the OpenObserve pricing page.
- Start a 14-day free trial of OpenObserve Cloud, or run OpenObserve self-hosted.
- Weighing a full-platform suite? Read our New Relic alternatives guide.
Frequently Asked Questions
About the Author
Simran Kumari

Passionate about observability, AI systems, and cloud-native tools. All in on DevOps and improving the developer experience.
Follow OpenObserve on Google
Add OpenObserve as a preferred source to see more of our articles in Google Search and Top Stories.