Datadog Synthetic Monitoring Pricing: The Per-Test Trap




Ready to get started?
Try OpenObserve Cloud today for more efficient and performant observability.
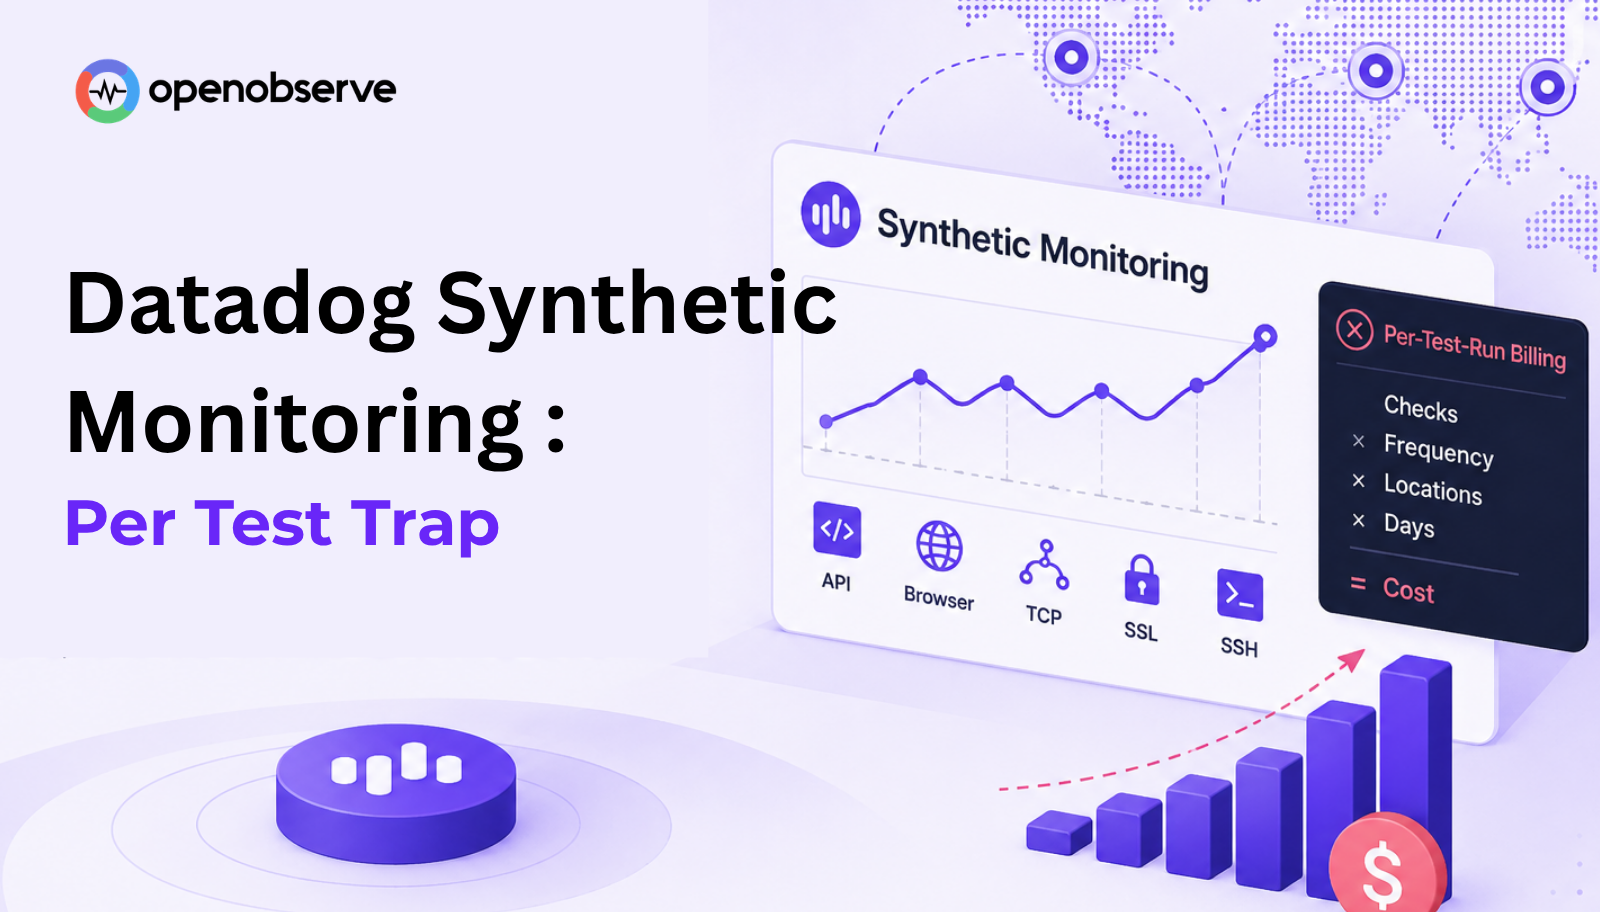
A team running 25 API checks every 2 minutes from 3 locations is not paying for 25 checks. They're paying for 1.6 million test runs a month, because Datadog bills per test run, every scheduled execution of a check, from every location it runs from, not per check you've configured. One check pinged every minute from three locations isn't one billable thing, it's three runs a minute. Add a handful of browser journeys at the same cadence, and a monitoring setup that looked cheap on the pricing page turns into a five-figure annual line item nobody budgeted for.
This is the part per-test pricing hides until you do the math yourself: the bill isn't a function of how many things you monitor, it's a function of how many things you monitor, multiplied by how often, multiplied by how many places you check from. Every lever you'd normally pull to monitor better, tighter frequency, more locations, more coverage, is also a lever that multiplies your cost.
TL;DR: Key Takeaways
Datadog bills synthetic checks per test run: $5.00 per 10,000 API runs, $12 per 1,000 browser runs, so cost multiplies with check frequency and location count, not just how many things you monitor. A modest 25-endpoint API and 8-journey browser setup already runs about $4,128/month.
Try Synthetic Monitoring free →
- Best for predictable cost as monitoring rigor increases: OpenObserve: synthetics ride usage-based platform pricing, no per-test-run meter to multiply.
- Best for teams staying on Datadog for now: segment check frequency by criticality, cut redundant checks, commit annually.
- Best for avoiding vendor lock-in: OpenObserve: browser checks are
@playwright/testscripts, not a proprietary recorder format.
How Datadog Synthetic Monitoring Pricing Works
Datadog prices synthetic checks per test run, not per test. A "test run" is one execution of one check from one location. Set up a single API check, run it every minute from three locations, and you've generated three test runs per minute, 4,320 per day, before you've added a second check.
The published list rates:
- API tests: $5.00 per 10,000 test runs, on an annual commitment
- Browser tests: $12 per 1,000 test runs on an annual commitment, roughly $15 to $18 per 1,000 on pay-as-you-go pricing
Enterprise buyers with high volume can often negotiate 30 to 40% off list price, but that requires a sales conversation and a committed contract, not something available to a team just trying to estimate next month's bill.
For related reading on how this fits Datadog's broader pricing structure, see Datadog Pricing in 2026: What It Really Costs and the Synthetic Monitoring launch in OpenObserve for how a usage-based alternative approaches the same problem.
Worked Examples: What Per-Test Billing Actually Costs
API Checks at Moderate Scale
A mid-size team monitoring 25 critical API endpoints, checked every 2 minutes, from 3 locations for resilience:
- Runs per endpoint per location per day: 1,440 minutes ÷ 2 = 720
- Total daily runs: 25 endpoints × 3 locations × 720 = 54,000
- Monthly runs (30 days): 54,000 × 30 = 1,620,000
- Monthly cost: 1,620,000 ÷ 10,000 × $5.00 = $810
Browser Checks on a Critical Journey
The same team also runs 8 browser journeys (login, search, add to cart, checkout, and similar flows), checked every 5 minutes, from 4 locations for global coverage:
- Runs per journey per location per day: 1,440 minutes ÷ 5 = 288
- Total daily runs: 8 journeys × 4 locations × 288 = 9,216
- Monthly runs (30 days): 9,216 × 30 = 276,480
- Monthly cost at annual-commit rate ($12/1,000): 276,480 ÷ 1,000 × $12 = $3,318
- Monthly cost at pay-as-you-go rate (~$16.50/1,000): 276,480 ÷ 1,000 × $16.50 = $4,562
The Combined Bill and Why It Compounds
| Monthly | Annualized | |
|---|---|---|
| API checks | $810 | $9,720 |
| Browser checks (annual commit) | $3,318 | $39,816 |
| Total | $4,128 | $49,536 |
That's roughly $50,000 a year for synthetic checks alone, before a single dollar of Datadog's APM, infrastructure, or log costs. And it moves fast: double browser journey coverage from 8 to 16, the same growth a team sees after adding a few more critical user flows post-launch, and the browser portion alone climbs to roughly $6,636/month with no other change. The check count didn't grow the bill on its own, the multiplication did.
Why Per-Test Pricing Becomes a Trap
The trap isn't that Datadog charges for synthetic checks, every vendor does in some form. It's that the pricing model punishes the exact behaviors good monitoring requires:
- Tighter check frequency to catch outages sooner directly multiplies cost, with no ceiling
- More test locations to rule out regional network issues multiplies cost again on top of frequency
- More coverage as the application grows adds a third multiplier
None of these are optional extras. They're what "monitor this properly" actually means. A team that under-provisions frequency or locations to control cost is making a reliability tradeoff to manage a billing model, not a monitoring decision.
How to Reduce Datadog Synthetics Costs (If You're Staying)
If migrating isn't on the table yet, the practical levers are:
- Segment check frequency by criticality. Run 1-minute checks only on revenue-critical paths; drop everything else to 5 or 10 minutes.
- Audit for redundant checks. Multiple checks hitting the same underlying dependency (a shared auth service, for example) can often collapse into one.
- Right-size your location count. Checking from 6 locations when your users and infrastructure span 2 regions is paying for coverage you don't need.
- Commit annually if you're staying long-term. The annual-commit rate for browser tests is meaningfully lower than pay-as-you-go.
The Alternative: Usage-Based Pricing with OpenObserve
OpenObserve includes Synthetic Monitoring as part of the same usage-based platform pricing that covers logs, metrics, and traces, currently in beta on OpenObserve Cloud. There's no separate per-test-run meter stacked on top of your existing telemetry spend, so tightening check frequency or adding a monitoring location doesn't independently multiply a line item the way it does under Datadog's model. Here's what that actually changes:
- Frequency and locations stop being cost decisions. Because checks aren't metered per run, moving a critical endpoint from a 5-minute to a 1-minute interval, or adding a third check location for resilience, is a monitoring decision again, not a billing tradeoff you have to justify separately.
- Checks are portable, not vendor-locked. Browser checks are
@playwright/testscripts, either written by hand or generated with a no-code recorder, rather than a proprietary DSL. If requirements change later, the check logic isn't stuck in a format only one vendor's runner understands. - Every check type lives in one place. HTTP/API, TCP port, SSL/TLS certificate, SSH, and browser checks all run on the same schedule and alerting surface, instead of API and browser monitoring being priced and configured as separate products.
- A failed check comes with its own evidence. Results, including the failing step, screenshot, and console/network events for browser checks, land in a native, SQL-queryable stream alongside your logs, metrics, and traces. Correlating a failure with its cause doesn't mean opening a second tool and matching timestamps by hand, see why logs, traces, and metrics correlation matters.
- Internal endpoints don't need a separate pricing tier. Private Locations run a lightweight, outbound-only agent inside your network to check staging environments, internal APIs, or anything behind a VPN, without opening an inbound port or shipping credentials to a third party.
- Alerting doesn't multiply with check frequency. Flaky failures are classified separately from genuinely degraded checks, with cooldown controls, so tightening a check's schedule to catch outages faster doesn't also mean forty pages for one bad minute.
Run OpenObserve's Bill Analyzer to see what switching could save on your overall Datadog spend, and see the Synthetic Monitoring launch post for what's included in the beta today. For a full feature and pricing comparison across the category, see Best Synthetic Monitoring Tools in 2026.
Ready to Get Started?
Try Synthetic Monitoring free on OpenObserve Cloud or talk to us about moving off per-test-run billing.
Frequently Asked Questions
About the Author
Simran Kumari

Passionate about observability, AI systems, and cloud-native tools. All in on DevOps and improving the developer experience.
Follow OpenObserve on Google
Add OpenObserve as a preferred source to see more of our articles in Google Search and Top Stories.












