Grafana vs Datadog (2026): Features, Pricing & Which to Choose




Ready to get started?
Try OpenObserve Cloud today for more efficient and performant observability.
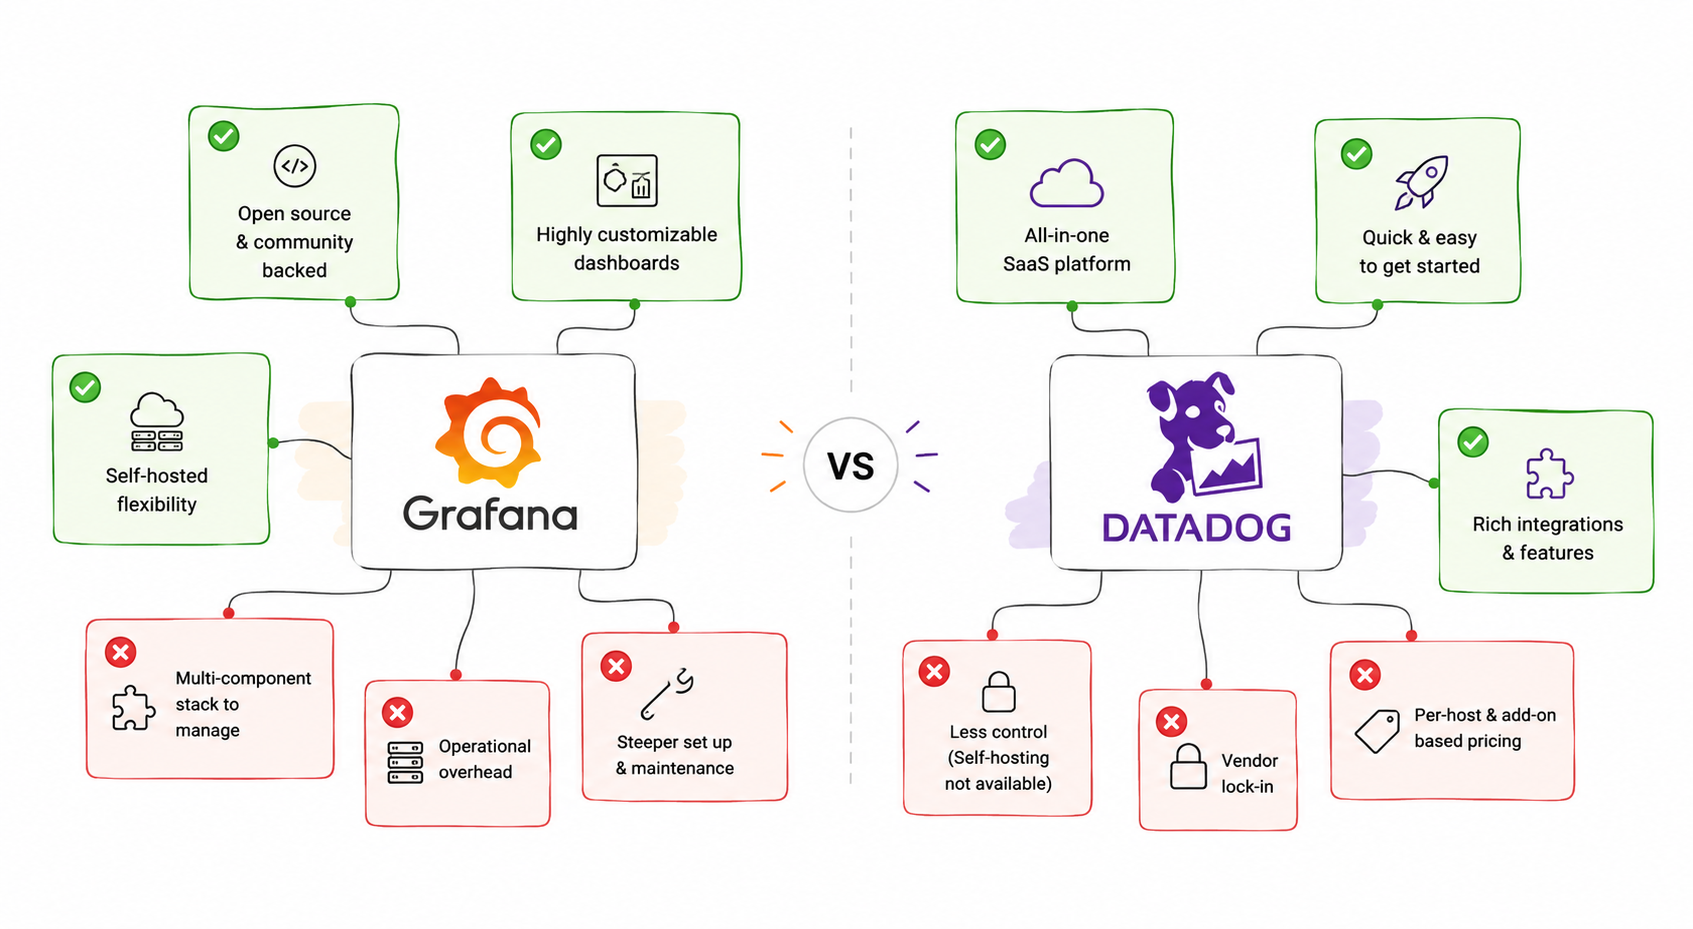
Grafana and Datadog get evaluated against each other more often than their category labels suggest they should. Grafana started as a dashboarding tool for other people's data; Datadog started as an all-in-one SaaS platform. But Grafana Labs has spent years building out Loki, Tempo, and Mimir to cover logs, traces, and metrics natively, and that expansion is exactly why the two now show up on the same shortlist.
This is a direct comparison: what each platform actually is, how their pricing works down to the per-host and per-GB level, and which one fits which team, before looking at where a unified platform like OpenObserve changes the calculus entirely.
TL;DR
Grafana (via Grafana Cloud or a self-hosted Grafana/Loki/Tempo/Mimir stack) is the more cost-flexible, open-source-rooted option, strongest for teams that want control over deployment and are comfortable assembling components. Datadog is the more turnkey, all-in-one SaaS platform, strongest for teams that want everything working out of the box and are willing to pay per host for that convenience. Both come with real trade-offs at scale: Grafana's flexibility means more operational ownership; Datadog's simplicity means a pricing model that multiplies fast.
Grafana vs Datadog at a Glance
| Grafana | Datadog | |
| Origin | Open-source dashboarding tool, expanded into a full stack (Loki, Tempo, Mimir) | Built from the start as an all-in-one commercial SaaS platform |
| Deployment | Self-hosted (free/open-source) or Grafana Cloud (managed) | SaaS only, no self-hosted option |
| Pricing model | Usage-based (Cloud) or infrastructure cost (self-hosted) | Per-host, per-GB, and per-product, layered together |
| Query language | PromQL (metrics), LogQL (logs), TraceQL (traces), one per signal | Proprietary query builder and DQL |
| Best known for | Dashboards, Kubernetes-native metrics via Prometheus | Turnkey APM, broad integration library, unified UI |
What Is Grafana?
Grafana is, at its core, a visualization layer. What most people mean by "Grafana" today is the broader Grafana stack: Grafana for dashboards, Loki for logs, Tempo for traces, and Mimir (or plain Prometheus) for metrics. These are separate components with separate query languages that Grafana Labs sells bundled as Grafana Cloud, or that you can self-host individually as open source. Loki and Grafana itself are licensed AGPLv3.
What Is Datadog?
Datadog is a single, vertically integrated SaaS platform covering infrastructure monitoring, APM, log management, RUM, synthetics, and a long list of add-on products, all under one UI and one account, with no self-hosted option at any tier. The trade-off for that integration is that Datadog's pricing has a separate meter for nearly every product you turn on.
Grafana vs Datadog: Feature Comparison
| Feature | Grafana | Datadog |
| Dashboards | Best-in-class, the category's original strength | Strong, pre-built dashboards per integration |
| Metrics | Native PromQL via Mimir/Prometheus, the Kubernetes standard | Native, plus a separate custom-metrics billing meter |
| Logs | Loki, label-indexed (not full-text by default) | Full-text indexed, billed separately from ingestion |
| Traces / APM | Tempo, solid but less turnkey than Datadog's APM | Mature APM with deep code-level profiling |
| RUM / Synthetics | Available via Grafana Cloud, less mature than Datadog's | Mature, well-integrated with APM traces |
| Alerting | Unified alerting across data sources | Strong, integrated with the broader incident workflow |
| Self-hosting | Fully supported, open source | Not available at any tier |
Grafana vs Datadog Pricing: Per-Host, Per-GB, and Per-Metric
This is where the two philosophies diverge most. Datadog prices are drawn from its published pricing; Grafana Cloud figures reflect its publicly listed usage-based rates at time of writing, always confirm current numbers before budgeting, since usage-based pricing on both sides shifts.
| Cost Dimension | Grafana Cloud | Datadog |
| Free tier | Yes: limited metrics series, logs, and traces included permanently | 14-day trial only, no permanent free tier |
| Per-host (infrastructure) | No per-host meter; usage is metrics-series and GB based | ~$15/host/month (Infrastructure Pro) |
| Per-host (APM) | N/A, priced by trace volume instead | ~$31/host/month |
| Logs (ingest) | Metered per GB, generally lower list price than Datadog's ingest fee | ~$0.10/GB ingested |
| Logs (index/search) | Included in the same per-GB metric (no separate index charge) | ~$1.70 per million indexed events, on top of ingest |
| Custom metrics | Priced per 1,000 active metrics series/month | ~$5.00 per 100 custom metrics/month (overage) |
| RUM | Available, metered by session | ~$1.50 per 1,000 sessions |
| Synthetics | Available, metered by check run | ~$5.00 per 10,000 API test runs |
| Self-hosted option | Yes, free (open source), infrastructure cost only | Not offered |
The pattern: Datadog's per-host and per-product structure is simple to reason about at small scale and expensive to reason about at large scale, since a fleet that doubles in host count doubles infrastructure and APM cost simultaneously, before logs, custom metrics, RUM, or synthetics are even factored in. Grafana Cloud's usage-based, no-per-host model avoids that specific multiplier, but self-hosting the underlying stack to avoid Cloud fees entirely shifts the cost into engineering time spent running four separate systems instead of one bill.
A Worked Example: 50 Hosts, 500GB of Logs a Month
Concrete numbers make the pattern easier to feel than a rate card does. Take a mid-size fleet: 50 hosts running infrastructure monitoring and APM, 500GB of log ingest a month with roughly 60% of that indexed for search, and a modest 200 custom metrics.
- Datadog: ~$750/month infrastructure (50 × $15) + ~$1,550/month APM (50 × $31) + ~$50/month log ingest (500GB × $0.10) + roughly $510/month log indexing (300GB indexed at ~$1.70/million events, workload-dependent) + custom metrics overage on top. Before RUM or synthetics, this fleet is already well past $2,800/month, and every one of those meters moves independently as usage grows.
- Grafana Cloud: no per-host charge at all; cost is driven by metrics series count and GB ingested for logs and traces. The same fleet typically lands meaningfully lower on the infrastructure and APM side specifically because there's no host multiplier, though log costs still scale with volume the same way.
- Self-hosted Grafana stack: no licensing cost at any scale, but now four systems (Grafana, Loki, Tempo, Mimir/Prometheus) to size, upgrade, and keep highly available, which is a real cost, just one that shows up as infrastructure and headcount rather than a vendor invoice.
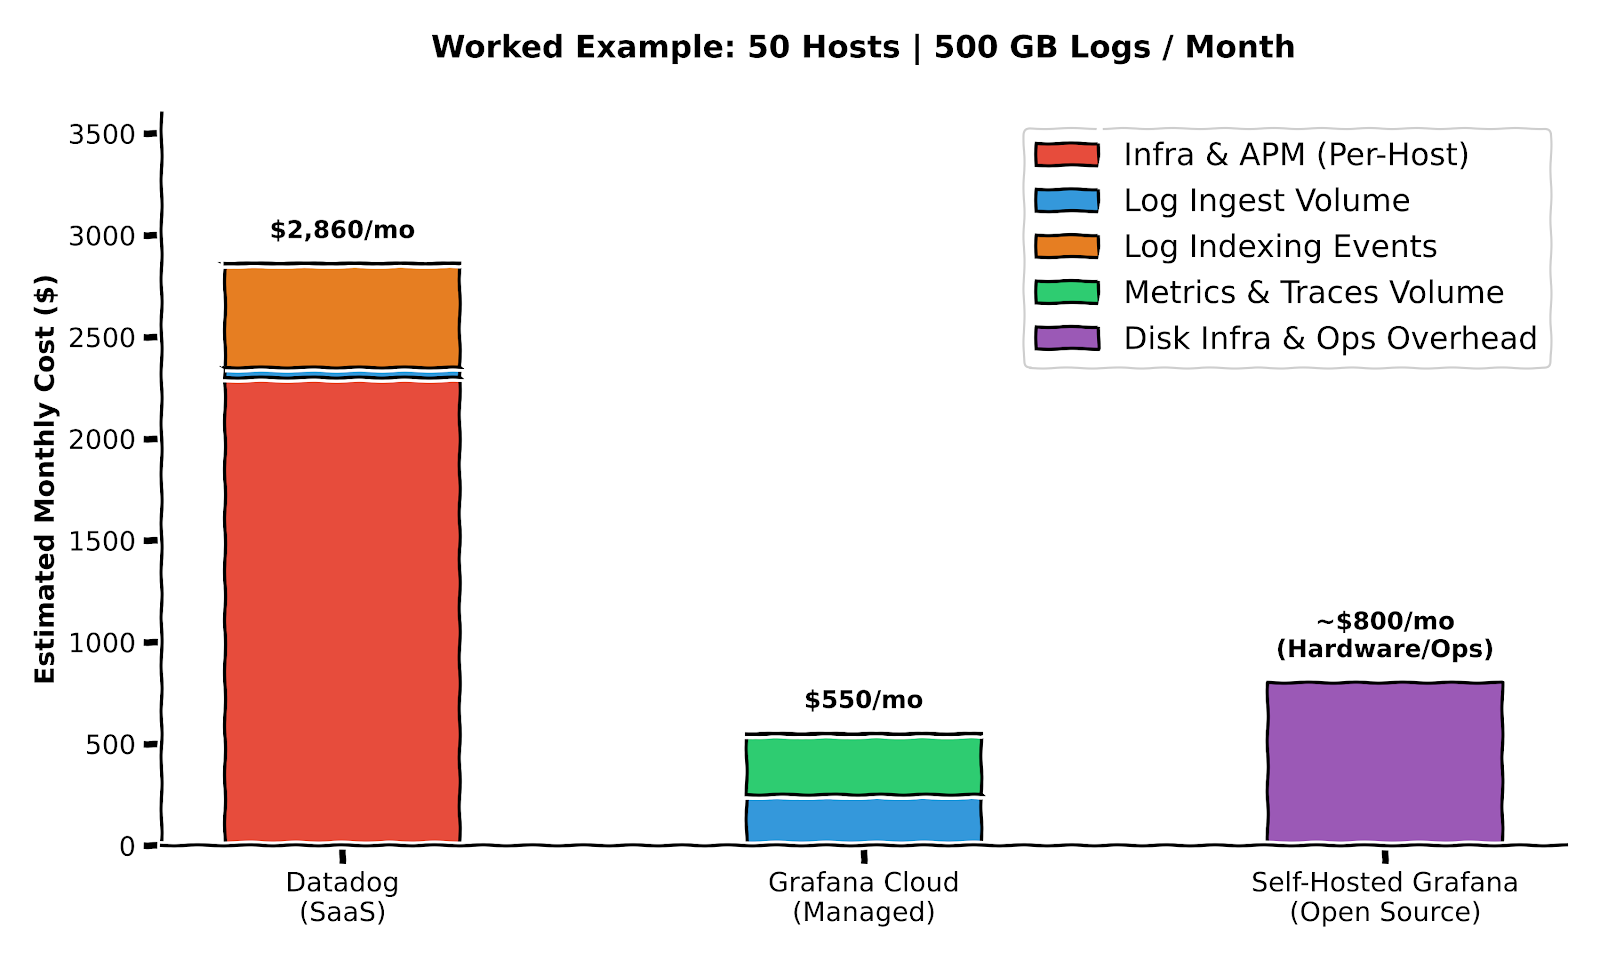
The exact totals shift with your workload and current list prices, confirm against each vendor's calculator before budgeting, but the structural takeaway holds regardless of the specific numbers: Datadog's cost surface has more independent dials, and each one moves in the same direction as your fleet grows.
Self-Hosted vs. Cloud-Only: The Deployment Difference
This is the structural difference that most feature-by-feature comparisons undersell. Datadog offers no self-hosted deployment at any price. Every byte of telemetry leaves your network, which is a non-starter for teams with strict data residency or air-gapped requirements, full stop, regardless of budget.
Grafana can be fully self-hosted, and open source at that: Grafana, Loki, Tempo, and Prometheus all run on your own infrastructure with no license fee. The honest trade-off is operational: you're now running and upgrading four distributed systems, each with its own storage backend, scaling characteristics, and failure modes, instead of one. Grafana Cloud exists precisely to sell that operational burden back to you as a managed service, which puts you closer to Datadog's SaaS-only model on the convenience axis, just with the option to walk back to self-hosted later.
Grafana Pros and Cons
Pros: open-source core with no license cost; strongest-in-class dashboards; PromQL is the de facto standard for Kubernetes metrics; genuine self-hosting option; usage-based Cloud pricing with no per-host multiplier.
Cons: four separate components with four separate query languages instead of one; Loki's label-only indexing makes full-text log search slower than a purpose-built log backend; RUM and synthetics are newer and less mature than Datadog's; self-hosting the full stack is real operational overhead.
Datadog Pros and Cons
Pros: genuinely turnkey, works out of the box with minimal configuration; deep, mature APM and code-level profiling; the largest integration library in the category; one UI, one account, one place to look during an incident.
Cons: no self-hosted option at any tier; per-host, per-GB, per-metric, per-product pricing compounds quickly and is notoriously hard to forecast; 15-day default log retention before extra cost applies; vendor lock-in to a fully proprietary platform.
Grafana vs Datadog: Which Should You Choose?
Choose Grafana if you're Kubernetes-native and already standardized on Prometheus, want a genuine self-hosting path, or need to avoid Datadog's per-host multiplier at fleet scale and can absorb running (or paying Grafana Cloud to run) four components instead of one.
Choose Datadog if turnkey setup and a single vendor relationship matter more than cost predictability, you don't have data residency constraints ruling out SaaS-only, and you're prepared to actively manage which products and hosts you turn on to keep the bill in check.
Neither is the obvious answer if what you actually want is one platform, one query language, and predictable cost regardless of which signal type is growing fastest, which is the specific gap the next section covers.
OpenObserve: A Unified Alternative to Grafana and Datadog
OpenObserve sits in a different spot than either: unlike Grafana's four-component stack, it's one system for logs, metrics, traces, RUM, and synthetics; unlike Datadog, it's fully self-hostable and open source, with no forced SaaS-only dependency.
Three specifics worth knowing:
- Columnar storage, lower cost at scale. OpenObserve's Parquet-based columnar format on object storage cuts storage costs significantly compared to Elasticsearch-based stacks, making full-fidelity retention affordable instead of a line item you ration.
- One query language, not three. Standard SQL across logs, metrics, and traces, no separate PromQL/LogQL/TraceQL split to maintain expertise in, and no proprietary query builder to learn.
- Deployment choice that neither incumbent offers together. Self-host for full data control, or run OpenObserve Cloud managed, with the same usage-based pricing model either way, no per-host tax, no per-product meter stack.
For teams currently comparing Grafana or Datadog specifically to reduce cost or consolidate tooling, the fuller picture is worth a direct look: our Grafana alternatives and Datadog alternatives pages break down the wider competitive field, and OpenObserve's pricing is public and usage-based with no sales call required to see it.
Conclusion
Grafana and Datadog solve the same underlying problem from opposite directions: Grafana assembles open, self-hostable components into a stack you control; Datadog sells one polished, SaaS-only platform you configure. Both are legitimate choices, and the right one depends more on your deployment constraints and operational appetite than on any single feature gap.
If what's actually driving the evaluation is cost predictability, deployment flexibility, or just being tired of stitching together (or paying separately for) logs, metrics, and traces, that's exactly the gap OpenObserve is built to close. See the full Datadog pricing comparison for a detailed cost breakdown against your own usage.
Frequently Asked Questions
About the Author
Simran Kumari

Passionate about observability, AI systems, and cloud-native tools. All in on DevOps and improving the developer experience.
Follow OpenObserve on Google
Add OpenObserve as a preferred source to see more of our articles in Google Search and Top Stories.












